
Monitoring has become an essential part of the IT infrastructure today, but have you ever wondered how monitoring happens for distributed applications over many functions and services? Add in agents and wrappers to the mix, and you have one of the most complex setups in the IT world.
This is a unique challenge with the following characteristics.
- You need granular information to stay on top of the performance of an application in every function
- The information you want must be available at the earliest
- The process of data collection and processing must not impact the performance of the application in any way.
- The information collected and its resultant analysis must be convertible into different formats to meet the requirements of various stakeholders.
In all, you need an advanced monitoring tool that will monitor serverless applications working across multiple functions and generate accurate reports that will not impact the working or performance of the application in any way.
Such tools are called serverless monitoring tools, and here’s a look at some of the popular choices available in the market today.
Here is our list of the Best Serverless Monitoring Tools:
- ManageEngine Applications Manager – FREE TRIAL This software package is able to monitor serverless platforms in the context of the activities of the functions that the host and other applications, services, and servers. Runs on Windows Server, Linux, AWS, and Azure. Get a 30-day free trial.
- Site24x7 – FREE TRIAL Advanced monitoring tool that provides detailed insights into the performance of many cloud-based platforms such as Azure, AWS, and Google Cloud. It collects metrics, analyzes them, and presents them in visually stunning ways without impacting the platforms’ operations in any way. Start a 30-day free trial.
- Datadog Serverless Monitoring This cloud-based package is a service that can interact with AWS Lambda, API Gateway, and DynamoDB, among other serverless management mechanisms to provide end-to-end performance monitoring and troubleshooting for layers of serverless functions.
- Amazon CloudWatch Νatively integrates with more than 70 AWS services to give detailed insights on the performance of different services not just on the cloud but also on-prem and in a hybrid environment.
- Lumigo Α debugging and monitoring tool is designed to help developers identify problems and fix them as soon as possible.
- SenseDeep Α tool for tracking and debugging serverless applications in real-time so that troubleshooting can be done at the earliest.
- Dashbird Μonitors serverless applications at any scale and provides comprehensive observability and real-time error tracking for all AWS applications.
- NewRelic One Α tool for monitoring serverless architecture and optimizing the operations and performance of these applications.
- Sentry Α serverless application tool that provides detailed insights into logs so that issues can be addressed at the earliest.
- Stackdriver Measures the health of cloud resources and applications by diving deep into various metrics such as CPU usage, disk I/O, uptime, and more.
- AWS X-Ray Specializes in analyzing and debugging distributed applications and those built using a microservice architecture.
Now, let’s jump into an in-depth analysis of the features and pricing of each of these tools.
The Best Serverless Monitoring Tools
1. ManageEngine Applications Manager – FREE TRIAL
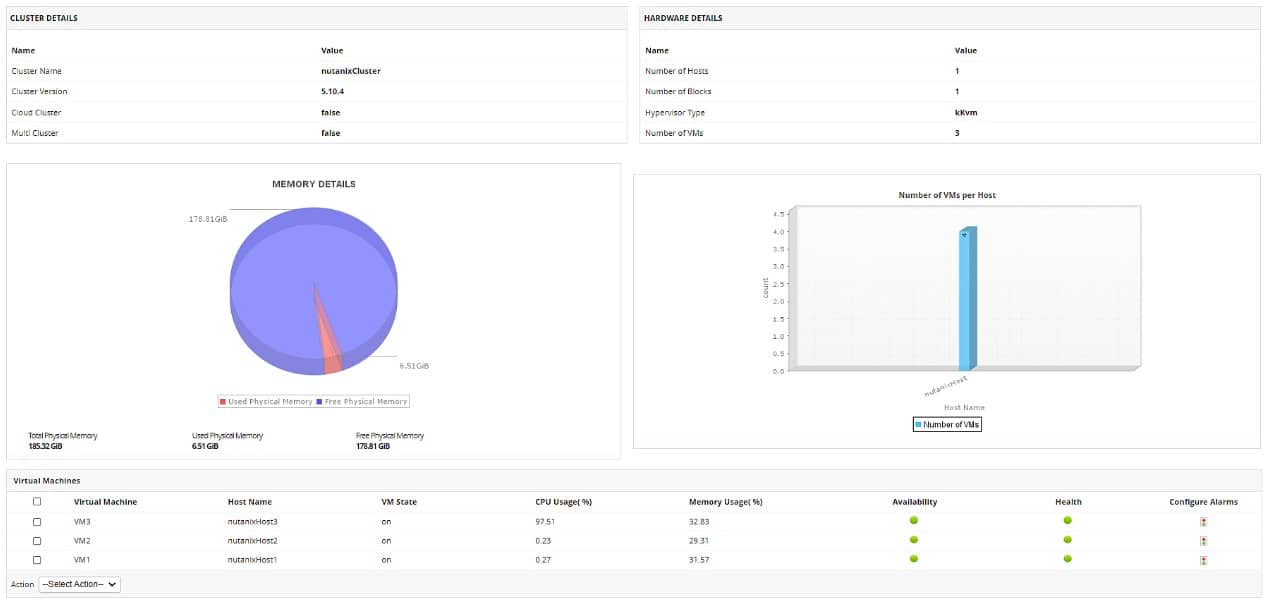
ManageEngine Applications Manager includes the ability to monitor serverless systems as well as other cloud services and platforms, on-premises servers, services, middleware, and software. The package discovers all applications and their supporting systems. In the case of serverless monitoring, that involves looking for the functions and microservices that they host and can also extend to other functions on which those hosted systems incorporate – which could be hosted elsewhere.
Key Features
- Monitors AWS Lambda and AWS SQS serverless systems
- Tracks activity on DynamoDB, Oracle Autonomous Database, and Node.js
- Discovers all systems and creates an application dependency map
- Tracks all other applications and platforms alongside serverless monitoring
- Notes the maximum number of invocations allowed per function and warns of approaching limits
- Cold start monitoring, noting their duration
- Error rate tracking with warnings
- Memory availability and usage
- Serverless account resource capacity tracking
- Memory activity monitoring
- Tracks service level agreement compliance
- Operates across networks and the internet
- Alerts that can be forwarded by SMS, email, Slack, and Service Desk ticketing
Why do we recommend it?
ManageEngine Applications Manager provides an all-in-one monitoring solution, covering not just serverless systems but also a wide array of cloud services, on-premises servers, and software. It offers in-depth insights with features such as cold start monitoring, error rate tracking, and memory activity monitoring, making it incredibly versatile.
Who is it recommended for?
This tool is a strong fit for organizations that operate in mixed environments consisting of serverless architectures, traditional servers, and cloud services. It’s especially useful for IT admins and DevOps teams who need a comprehensive monitoring solution that can adapt to a wide range of platforms and services.
There are three editions of Applications Manager:
- Free (to monitor five assets)
- Professional – from $395 per year
- Enterprise – from $9,595 per year
Access a 30-day free trial for installation on Windows Server, Linux, AWS, or Azure.
2. Site24x7 – FREE TRIAL
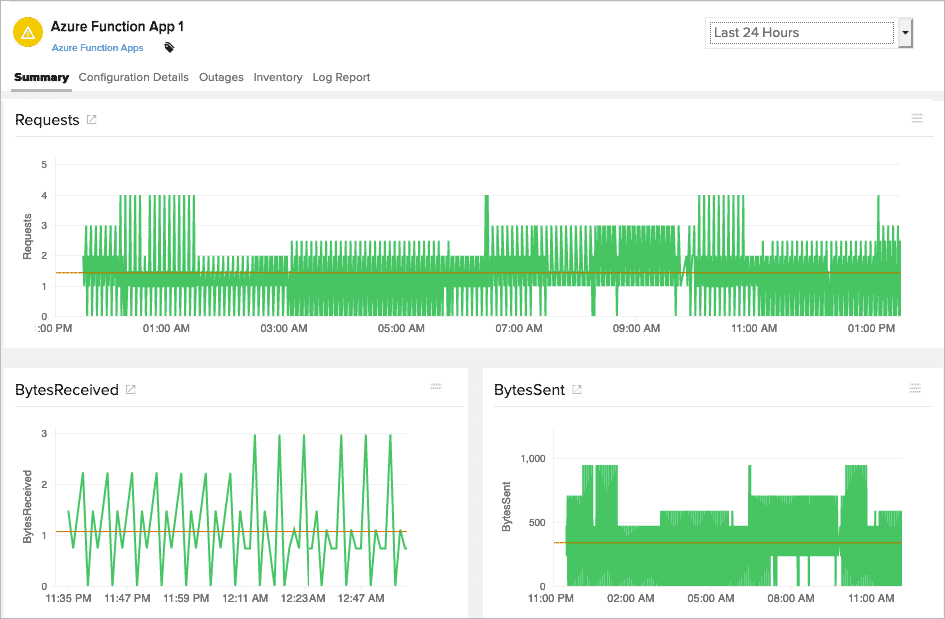
Site24x7 monitors the health and performance of all cloud applications and provides detailed insights into the working of prominent serverless applications like AWS Lambda, Google Cloud Functions, and Azure Functions. Since you pay only for what you monitor, Site24x7 works as a cost-effective option as well.
Key Features
Here’s a look at the salient features of Site24x7’s serverless monitoring.
- Provides real-time visibility into the performance of many platforms such as Azure, AWS, and Google Cloud
- Keeps track of the total requests, including the bytes sent and received by these applications
- Measures performance counters to ease the process of app development
- Gives the uptime status of function apps
- Collects metrics on a range of activities such as function activity, code execution time, errors, and more
- Measures critical performance metrics such as errors, throttles, latency, and more
- Sends notifications automatically when thresholds are breached
- Ensures the peak performance of cloud infrastructure
- Its AI engine identifies the root cause of a problem quickly so that you can get to it right away
- Auto resolves problematic resources
- Provides end-to-end visibility
- Auto discovers applications
Why do we recommend it?
Site24x7 offers real-time monitoring across multiple cloud platforms and detailed insights into serverless applications. It stands out for its cost-effectiveness and AI-driven capabilities for quickly identifying and resolving issues.
Who is it recommended for?
Site24x7 is ideal for businesses of all sizes that rely on cloud-based applications, particularly serverless platforms like AWS Lambda, Google Cloud Functions, and Azure Functions. It’s a strong choice for teams that require immediate alerts and auto-resolution features to maintain peak performance.
The base plan starts at $9 per month. You can add the services you want to customize the offering, and the cost will vary accordingly. Register for the 30-day free trial.
3. Datadog Serverless Monitoring
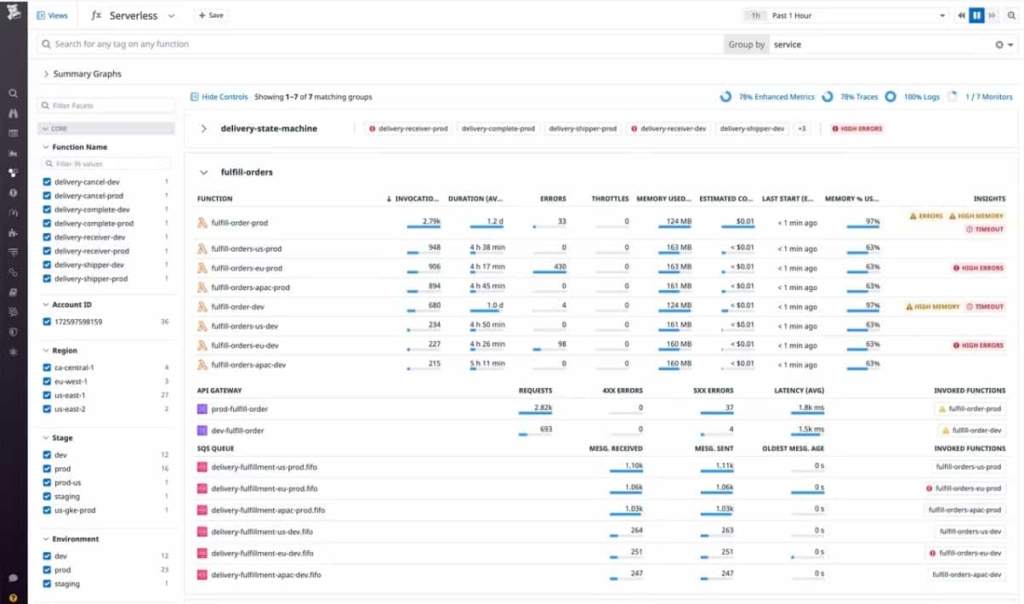
Datadog Serverless Monitoring is a cloud-based system that interacts with other cloud platforms that are widely used for microservices hosting, particularly AWS Lambda. The system begins by tracing all dependencies starting at a front-end application and then drilling down through service layers to reveal all supporting functions. Once monitoring begins, it operates with distributed tracing, which writes YouTube to log files.
Key Features
- The most important attributes of the Datadog Serverless Monitoring service are:
- A Service Map showing discovered functional dependencies
- Code-level profiling where function programs are accessible
- Distributed tracing of program executions
- Live trace feedback is shown in the dashboard
- Traces written out to files, with trace correlation
- Trace data available for analysis over a 15-minute time frame
- Machine learning for anomaly detection
- Alerts for performance problems
- Customizable tags for issue tracking
- Adapts to DevOps environments
- Correlation to managed application performance
- Integration with Datadog Log Management
Why do we recommend it?
Datadog Serverless Monitoring excels in offering a comprehensive view of your serverless architecture, especially for AWS Lambda environments. With features like distributed tracing, code-level profiling, and machine learning for anomaly detection, it provides invaluable insights into system performance.
Who is it recommended for?
This tool is highly recommended for teams using serverless architectures, particularly those using AWS Lambda. Its advanced features make it suitable for DevOps professionals and engineers who require deep visibility into application performance, as well as real-time alerting capabilities.
The base price for the service is $5 per million invocations per month when paid annually in advance as a service credit purchase. That plan includes a 15-month data retention period with data recall for analysis within the Datadog dashboard or for export. The price is $7.20 per million invocations on a month-to-month payment plan. Assess an online 14-day free trial.
4. Amazon CloudWatch
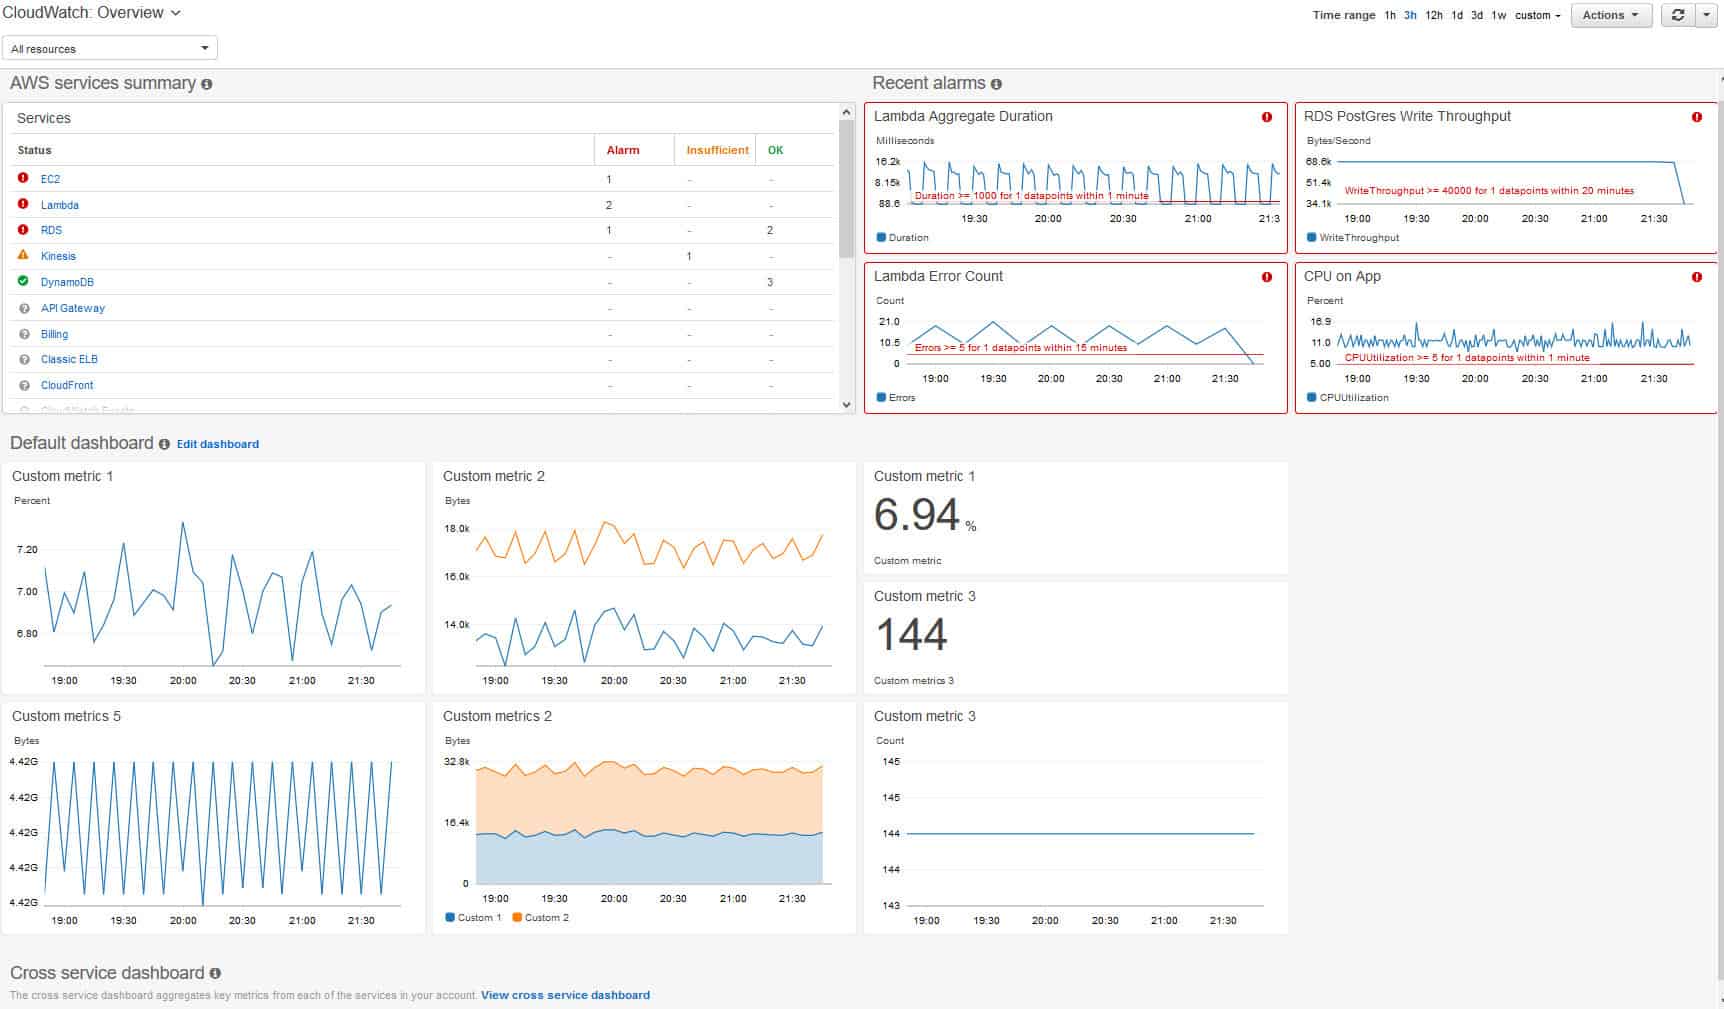
Amazon CloudWatch is an observability tool explicitly built for DevOps engineers, developers, site engineers, IT managers, and data analysts to give them the data and actionable insights needed to stay on top of the health and performance of applications that run on AWS.
Key Features
Some of the salient features of Amazon CloudWatch are:
- Collects, analyzes, and correlates data from different applications to give you meaningful insights
- Natively integrates with more than 70 AWS services
- Makes it easy to deep dive into the logs to get the information you want
- Works well on the cloud, on-premises, and hybrid architectures
- Breaks down silos to get system-wide visibility
- Sends alarms based on the established thresholds
- Uses machine learning algorithms to identify abnormal behavior
- Automates actions based on the given instructions
- Optimizes performance and resource utilization
- Comes with advanced dashboards to give high levels of operational visibility
Why do we recommend it?
Amazon CloudWatch offers comprehensive observability features tailored for AWS, providing actionable insights for DevOps engineers, IT managers, and data analysts. Its machine-learning algorithms and native integration with 70+ AWS services make it a powerful tool for monitoring and optimizing performance.
Who is it recommended for?
CloudWatch is particularly suited for organizations heavily invested in the AWS ecosystem. It is an excellent fit for DevOps engineers, developers, and IT managers who need detailed operational visibility and real-time alarming capabilities for their cloud, on-premises, and hybrid architectures.
CloudWatch has a free and a paid tier.
The paid tier depends on your usage, and the cost per unit goes down when you use more. The breakdown is as follows.
- First 10,000 metrics – $0.30/metric/month
- Next 240,000 metrics – $0.10/metric/month
- Next 750,000 metrics – $0.05/metric/month
- Over 1,000,000 metrics – $0.02/metric/month
Click here to get started.
5. Lumigo
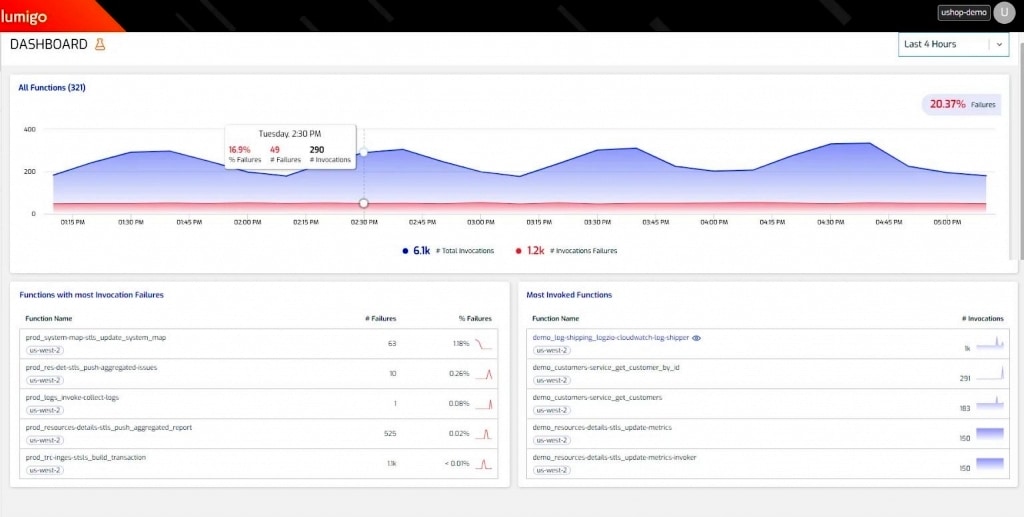
Lumigo is a developer-centric tool that makes it easy for developers to find and fix issues at the earliest in a serverless and monitorless environment.
Key Features
Some of the salient features of Lumigo are:
- Build a virtual stack of all services in a transaction
- All the services are built on a visual map, so it’s easy to find and filter them
- No code changes are required anywhere
- Helps to visualize the complete environment, including the Lambdas, API calls, external SaaS services, and more
- Gives the end-to-end execution of every service
- Uses machine learning for predictive analysis
- Works well on all scales
- Compares the state before and after deployments to give a comprehensive idea of the impact of deployments
Why do we recommend it?
Lumigo excels in providing a developer-centric environment for monitoring serverless architectures. Its machine learning for predictive analysis and ability to visualize an entire environment without requiring code changes make it a standout choice for optimizing serverless operations.
Who is it recommended for?
Lumigo is highly recommended for developers working in serverless and monitorless environments. The tool is especially beneficial for those who need to understand the impact of their deployments comprehensively and wish to proactively identify and resolve issues across a variety of services.
There are four pricing tiers, and they are:
- Free
- Standard – $99
- Plus – $299
- Custom
Click here to get started.
6. SenseDeep
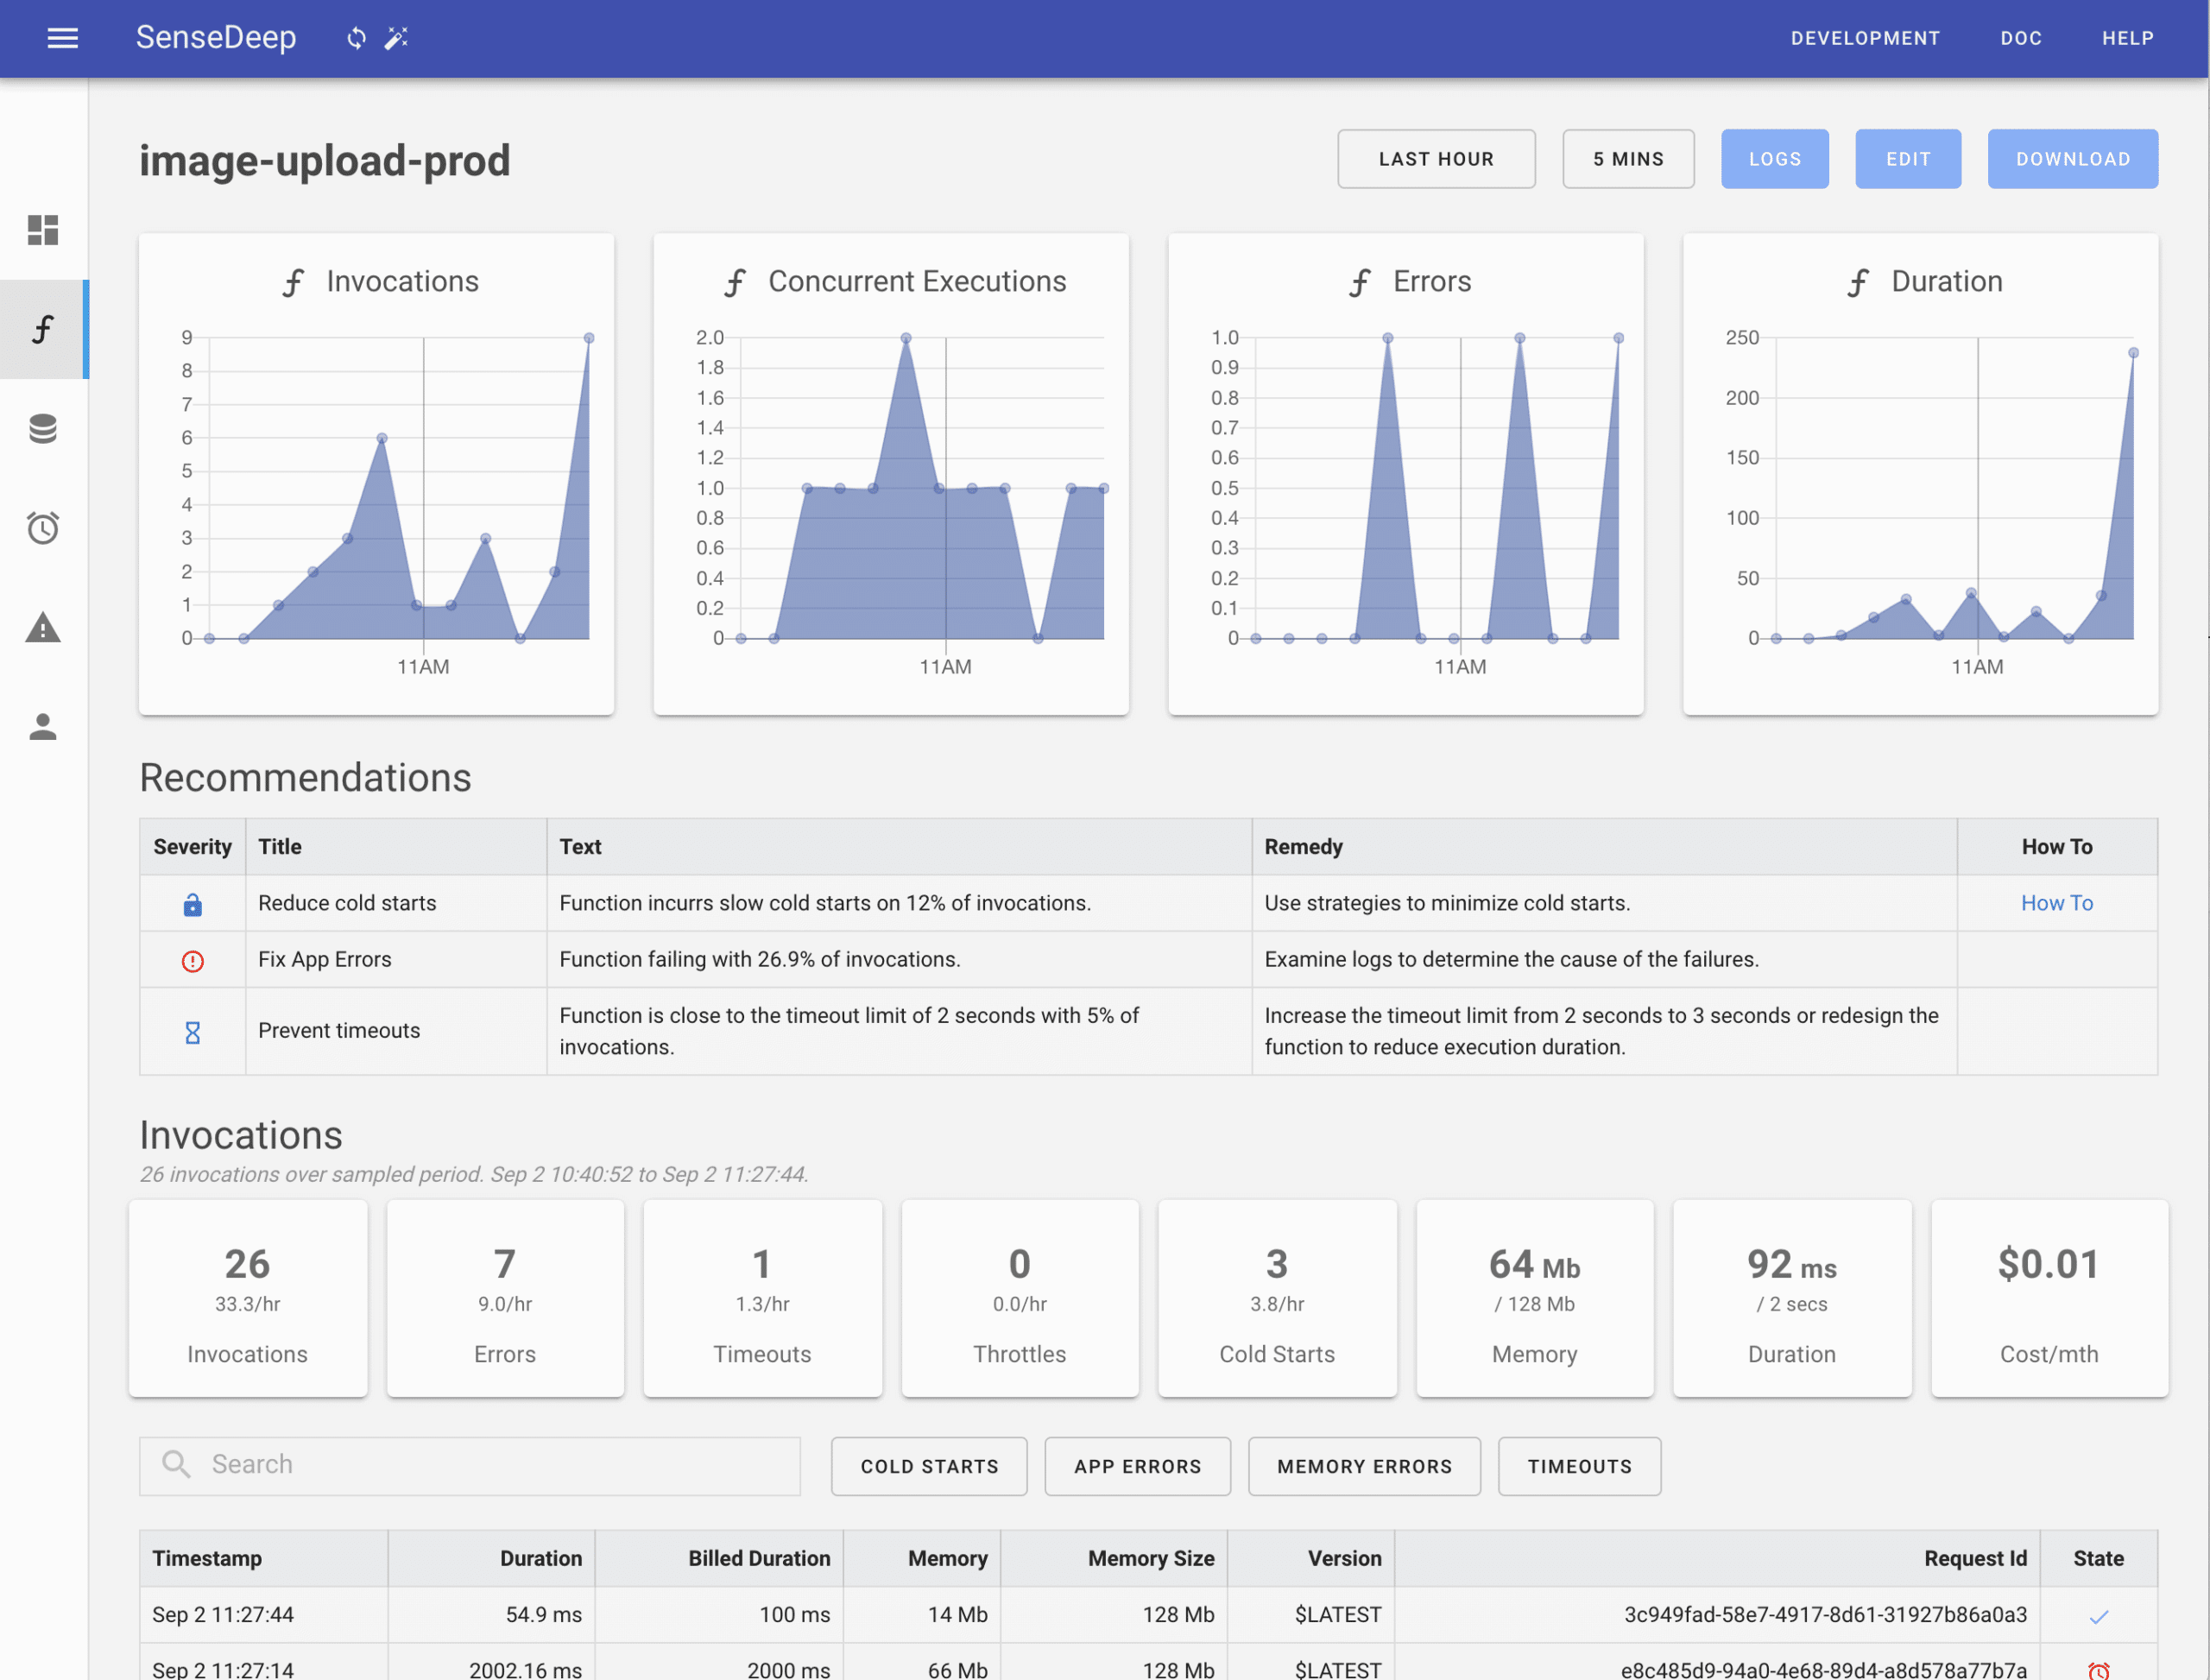
SenseDeep is an automated error detection and troubleshooting tool designed for serverless environments and gives detailed insights into serverless applications’ working.
Key Features
Here are some of the features of SenseDeep.
- Provides complete AWS serverless monitoring
- Sends automated alerts and notifications when values exceed thresholds
- All lambdas and logs are thoroughly analyzed to give complete visibility into the state of applications
- Drills down into different events and provides full invocation traces
- Presents data in formatted and JSON color-coded events
- Tracks errors and throttles
- Automates error detection and stays on top of the performance of all applications 24X7
- Dynamically identifies and subscribes to new lambdas
- Improves lambdas’ performance with recommendations
- Uses machine learning to make appropriate suggestions
- Allows you to search and query local events
Why do we recommend it?
SenseDeep offers robust automated error detection and troubleshooting specifically designed for serverless environments. Its comprehensive AWS serverless monitoring, along with machine learning-driven recommendations, makes it a compelling choice for maintaining application health and performance.
Who is it recommended for?
SenseDeep is ideal for DevOps teams and developers focusing on serverless architectures within the AWS ecosystem. Its capabilities are particularly useful for those who require real-time alerts, detailed invocation traces, and automated performance improvement recommendations for their Lambda functions.
SenseDeep comes in three editions:
- Pro – $25/month
- Team – $80/month
- Enterprise – Custom
Click here for a 14-day free trial.
7. Dashbird
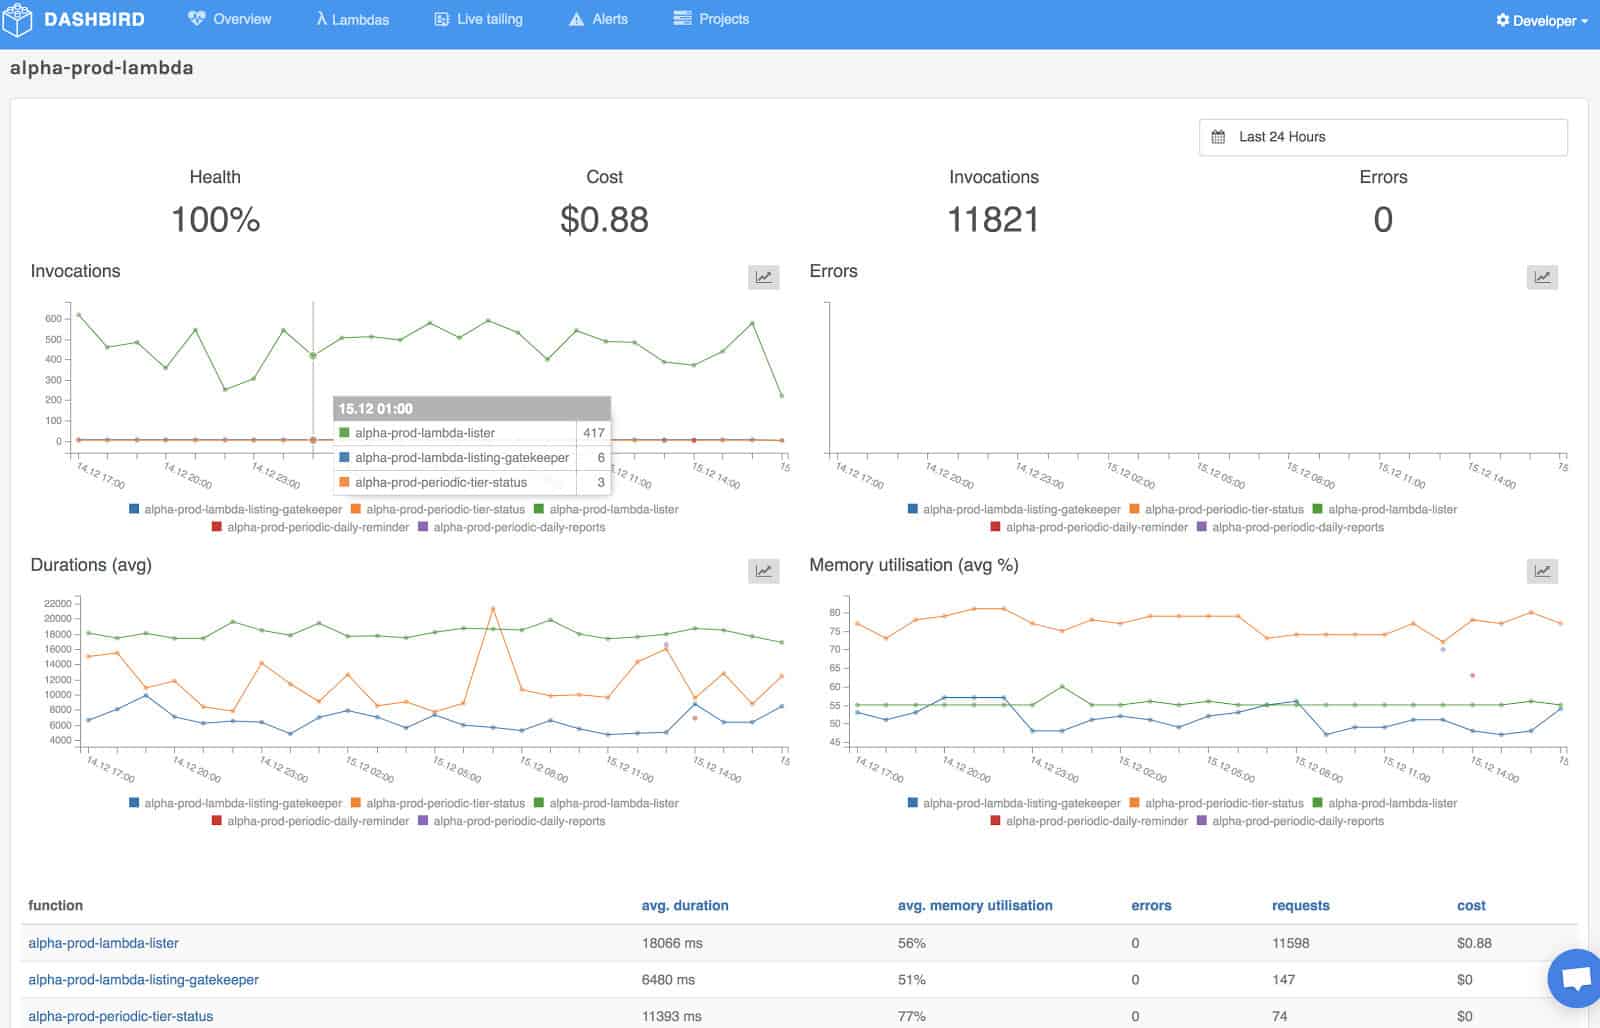
Dashbird is a serverless monitoring tool that provides end-to-end observability and error-tracking in real-time so that users can stay on top of the serverless applications and their performance.
Key Features
Here are some crucial features of Dashbird.
- Provides end-to-end observability of your entire system
- Displays logs and metrics in a single pane to make it easy for you to get a comprehensive idea of the system state
- Gives continuous insights into the security and efficiency of your applications
- Helps with compliance
- Detects errors and timeouts from analyzing logs
- Sets prebuilt checks and filters
- Ensures that you can get to errors before they become significant blockers
- The UI is clean and intuitive
- Monitors lambda functions, API gateways, ECS containers, DynamoDB tables, and more
- Helps to understand the implications of architecture and code changes
Why do we recommend it?
Dashbird excels in providing real-time, end-to-end observability and error-tracking for serverless applications. Its unified dashboard that combines logs and metrics, along with prebuilt checks and filters, ensures that you can proactively address issues before they escalate.
Who is it recommended for?
Dashbird is recommended for teams and organizations that rely heavily on serverless architectures and require continuous insights into their application’s security and efficiency. It’s especially useful for those who use a mix of AWS services like Lambda, API Gateways, ECS containers, and DynamoDB tables, and want to understand the impact of architecture and code changes.
Dashbird offers three pricing tiers, and they are:
- Developer – Free plan that works well for individuals and small companies. Supports up to 1M invocations per month.
- Professional – Costs $79/month and is ideal for large serverless environments. Supports up to 15M invocations per month.
- Enterprise. Custom pricing and is suited for companies with a high-volume infrastructure.
Click here to get started.
8. NewRelic One
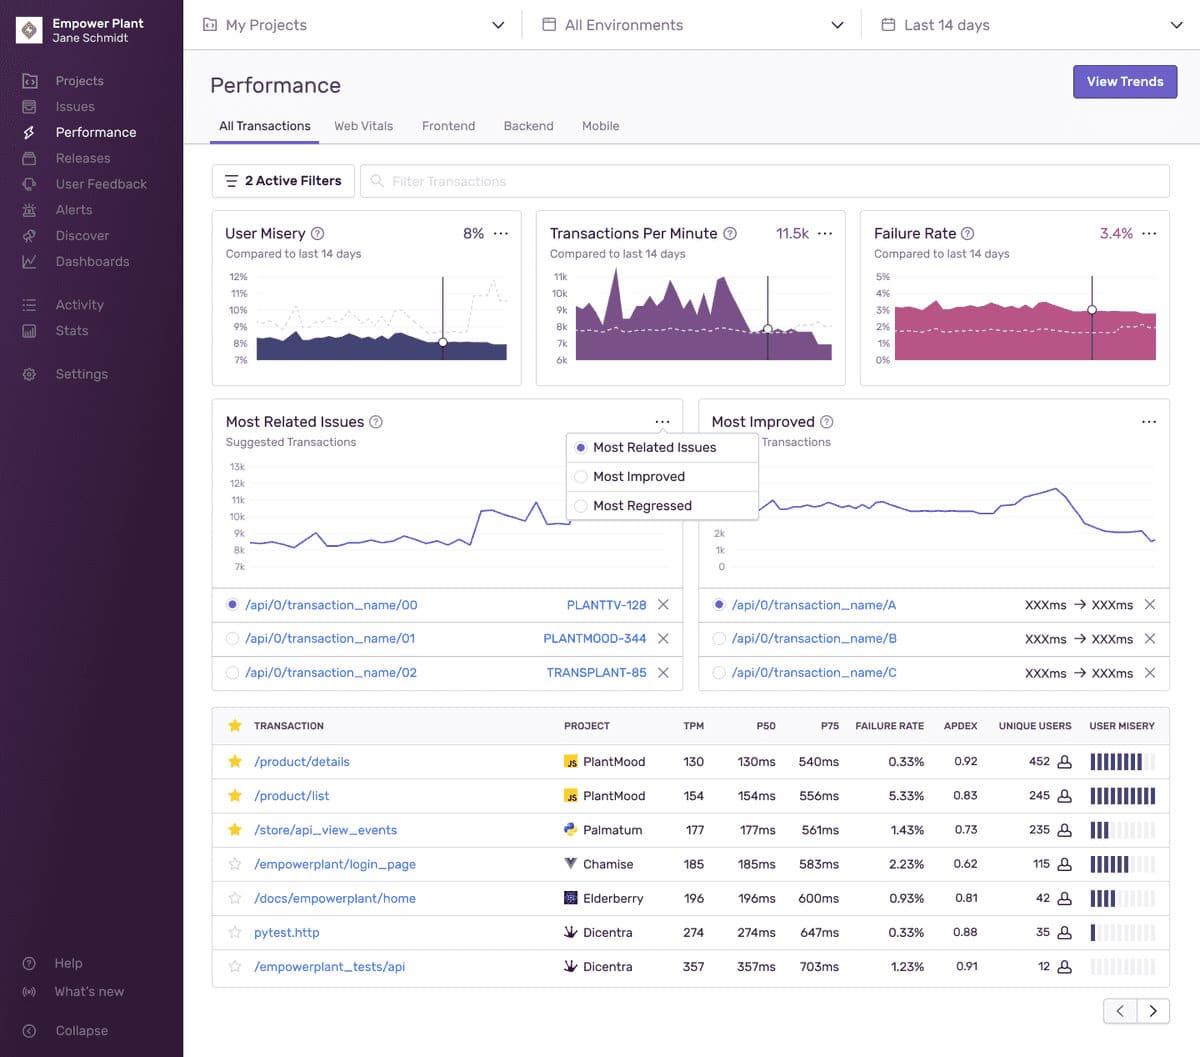
NewRelic One provides the visibility you need to get the hang of the performance of your serverless architecture so that you can take the necessary action accordingly.
Key Features
The features of NewRelic One for serverless monitoring are:
- The logs are comprehensive and give all the information you need
- Offers insights into traces and, through it, the underlying dependencies
- Monitors AWS Lambda applications, microservices, server OS, managed services, and more
- Traces transactions from end-to-end
- Queries and analyzes logs
- Sends intelligent alerts for relevant events
- Measures and optimizes workloads
- Handles the instrumentation of codes and deployments
- Correlates interactions on a request’s journey
- Quickly locates and debugs bottlenecks
- Reduces alert noise
Why do we recommend it?
NewRelic One offers comprehensive logging and insightful tracing, allowing for detailed performance analysis of serverless architectures. Its ability to trace transactions end-to-end and send intelligent alerts makes it a robust solution for optimizing workloads.
Who is it recommended for?
NewRelic One is best suited for DevOps teams, system administrators, and developers who need a detailed, granular view into the performance of their serverless applications and architectures. It is particularly useful for those using AWS Lambda and microservices and who need to quickly identify and resolve bottlenecks.
There are four pricing tiers:
- Free
- Standard
- Pro
- Enterprise
Click here to sign up.
9. Sentry
Sentry is a serverless error and performance monitoring tool that helps debug and maintain serverless applications in your infrastructure.
Key Features
The features of Sentry are:
- Gives stack traces on issues for easy debugging
- Helps you to understand the context of logs by giving the associated metadata
- Quickly identifies poor or slow-performing API calls and database queries, so they can be optimized to improve performance
- Provides extensive information such as metadata, execution time, name of the function, application, and more
- Works well across AWS, Amazon, and Google Cloud applications
- Setup is quick and easy
Why do we recommend it?
Sentry excels in error and performance monitoring by offering stack traces and extensive metadata for easy debugging. Its quick identification of poor-performing API calls and database queries helps in timely optimizations.
Who is it recommended for?
Sentry is ideal for developers and DevOps teams working in cloud environments like AWS, Amazon, and Google Cloud who need in-depth error tracking and performance insights. It is especially useful for those who prioritize rapid debugging and performance optimization.
There are four pricing tiers:
- Developer – Free. Offers limited error and performance monitoring
- Team – $26/month . Ideal for error and performance monitoring with flexible event volume
- Business – $80/month . Provides standard error and performance monitoring
- Enterprise – Custom pricing. A full platform monitoring service with premium customer service
Click here to get started.
10. Stackdriver
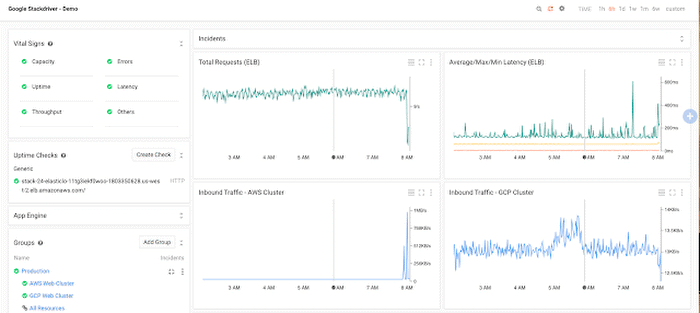
Stackdriver delves deep into different metrics such as CPU usage, memory, disk I/O, and more to give a comprehensive idea of the health of an application, so you can make the necessary changes to optimize it.
Key Features
Here’s a look at the features of Stackdriver:
- This is a multi-cloud solution that supports both AWS and Google Cloud offerings
- Provides performance and diagnostic data
- Measures the health of cloud resources and applications
- Gives detailed visibility into metrics such as CPU usage, disk I/O, and more
- It is based on Collectd, an open-source daemon that collects system and application metrics
- Comes with out-of-the-box dashboards and views to monitor the platform as well as the applications that run on them
- Sets up performance and availability indicators
- Sends alerts based on your notification configuration
- Provides real-time log management and analysis
Why do we recommend it?
Stackdriver offers comprehensive monitoring capabilities, diving into various metrics like CPU usage, disk I/O, and memory to assess application health. Its multi-cloud support for both AWS and Google Cloud makes it versatile for diverse infrastructure needs.
Who is it recommended for?
This tool is ideal for businesses that are operating in multi-cloud environments, specifically those using AWS and Google Cloud. Organizations looking for real-time log management and customizable alert settings will find Stackdriver particularly useful.
Contact the sales team for pricing. Click here to get started for free.
11. AWS X-Ray
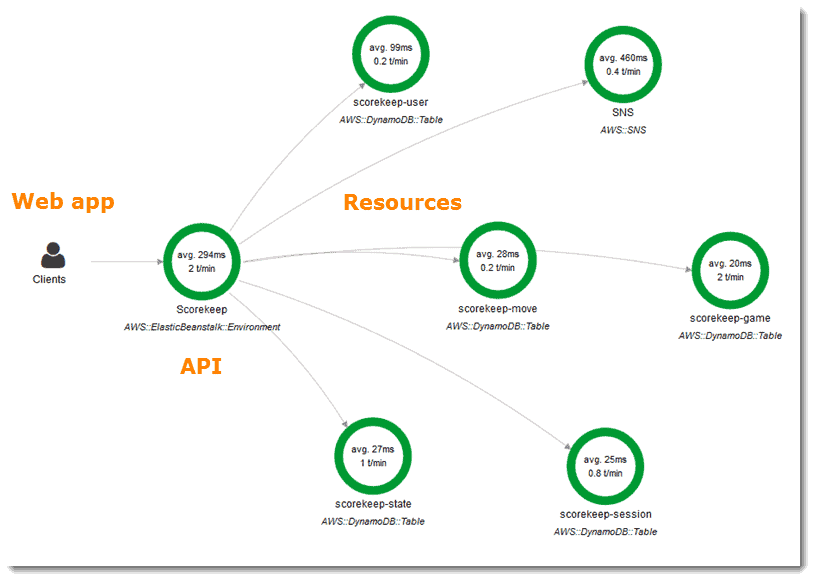
AWS X-Ray is a monitoring tool for analyzing and debugging distributed applications, including those on production or built using a microservices architecture.
Key Features
The salient features of AWS X-Ray are:
- Makes it easy for developers to debug their applications
- Gives insights into the performance of applications and their underlying architecture
- Displays a map of your application’s components
- Analyzes all kinds of applications, from simple three-tier applications to complex ones involving thousands of services
- Traces user requests as they travel through the application
- Helps with root cause analysis
- Detects high latencies and their underlying causes
- Works well on applications written in Java, Node.js, and .NET
- Designed for a variety of applications across AWS accounts, AWS regions, and availability zones
Why do we recommend it?
AWS X-Ray excels in debugging and analyzing distributed applications, offering insights into performance and underlying architecture. The ability to trace user requests throughout complex systems makes it invaluable for root cause analysis.
Who is it recommended for?
AWS X-Ray is well-suited for developers working with distributed or microservices-based applications, particularly those using AWS services. It is also ideal for those who are dealing with complex applications that span multiple AWS accounts, regions, and availability zones.
Use this AWS Calculator to estimate the cost of your requirements. Click here to start the sign-up process.
Conclusion
In all, serverless architecture offers many benefits to organizations, which is evident from the phenomenal growth this sector has seen in the last few years. The ease of maintenance and the subsequent reductions in time and effort is undoubtedly a big draw for serverless applications.
That said, monitoring is an essential part of serverless applications. It enables you to stay on top of their performance and make the necessary changes to optimize their performance. The above-mentioned serverless monitoring is some of the best in the industry as they come with specific features to monitor and deliver value to your business. Some of them even come with specific capabilities to meet your requirements.
We hope this list gives you a good starting point as you explore the world of serverless monitoring.
