
Every business today seems to be laser-focused on IT infrastructure. From increasing storage, expanding networks and virtualization.
It comes as no surprise that servers and applications will also be greatly improved and managed.
Here’s our list of the best application monitoring tools:
- Site24x7 Application Performance Monitor – EDITOR’S CHOICE A cloud-based service that includes website, server, and network monitoring.
- ManageEngine Applications Manager – FREE TRIAL This APM covers on-premises and cloud server activities and also includes synthetic transaction testing utilities for websites. Available for Windows Server and Linux.
- Paessler PRTG – FREE TRIAL This is a collection of monitoring tools and the buyer decides which to activate. Monitors cover networks, servers, and applications. Installs on Windows Server.
- Datadog APM An application monitor that is geared towards supporting DevOps teams in system support. This is a cloud-based service.
- SolarWinds Server & Application Monitor A comprehensive tool for identifying application interdependencies and the server resources that support them. This software creates an app stack and uses alerts to notify technicians of evolving problems.
- Nagios XI and Core An infrastructure monitoring system that covers networks, servers, and applications and is available in free (Nagios Core) and paid (Nagios XI) versions. Installs on Linux.
- Progress WhatsUp Gold A network monitoring service that can be extended by an Application Monitor add-on. Runs on Windows Server.
- Zabbix A free, open-source infrastructure monitor that covers networks, servers, and applications. Available for Linux, macOS, and Unix.
After all, they run at the very core of data centers and businesses rely on them in order to meet bottom line goals.
Organizations depend on Application monitoring tools to ensure that the basic infrastructure items are optimized and functional.
The Best Application Monitoring Tools
Methodology for selecting the Best Application Monitoring Software
Here a few factors that one must consider when selecting an application monitoring software:
- Can it discover all applications in a system and monitor their activities?
- Does is offer application dependency mapper?
- Can it track server resources?
Below you find a Quick description and screenshot of each software as well as some of their main features.
1. Site24x7 Application Performance Monitor – FREE TRIAL
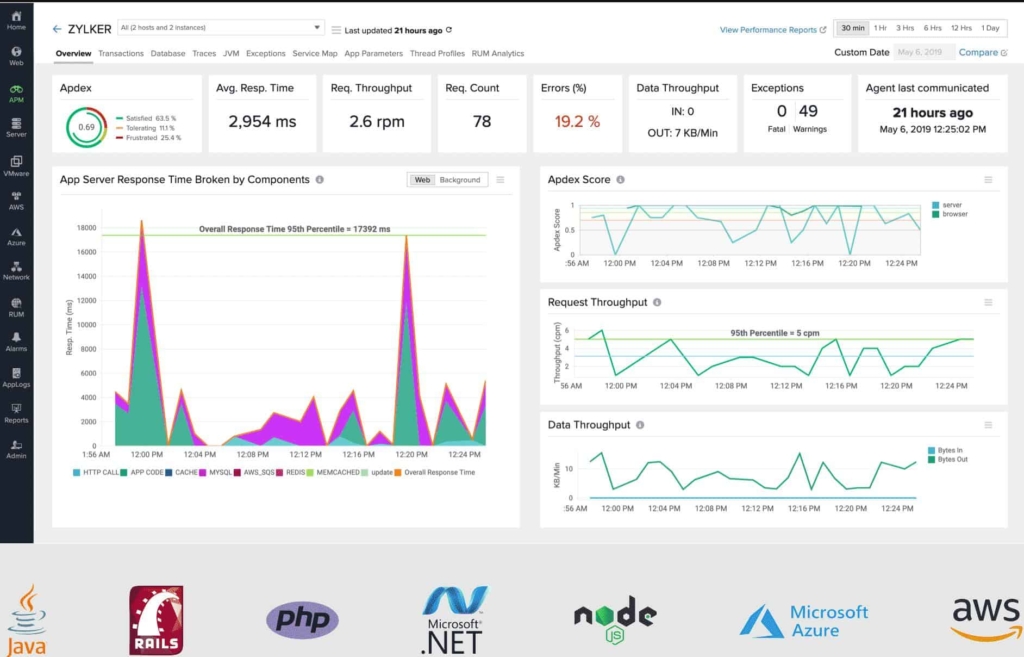
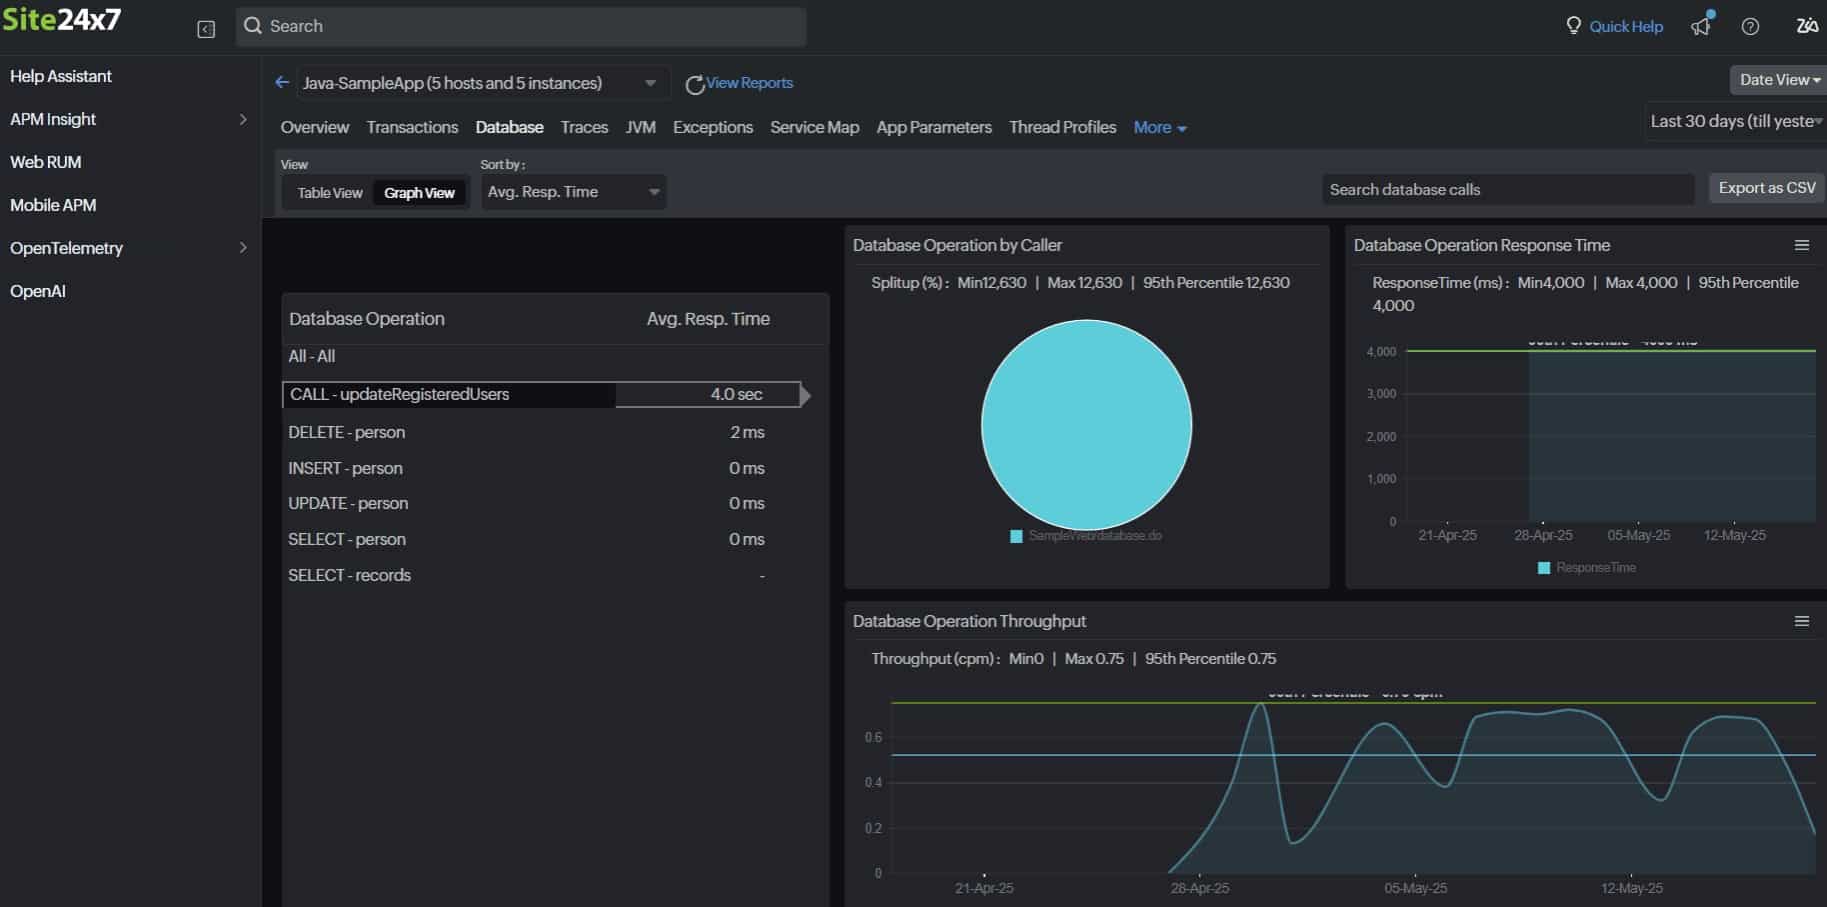
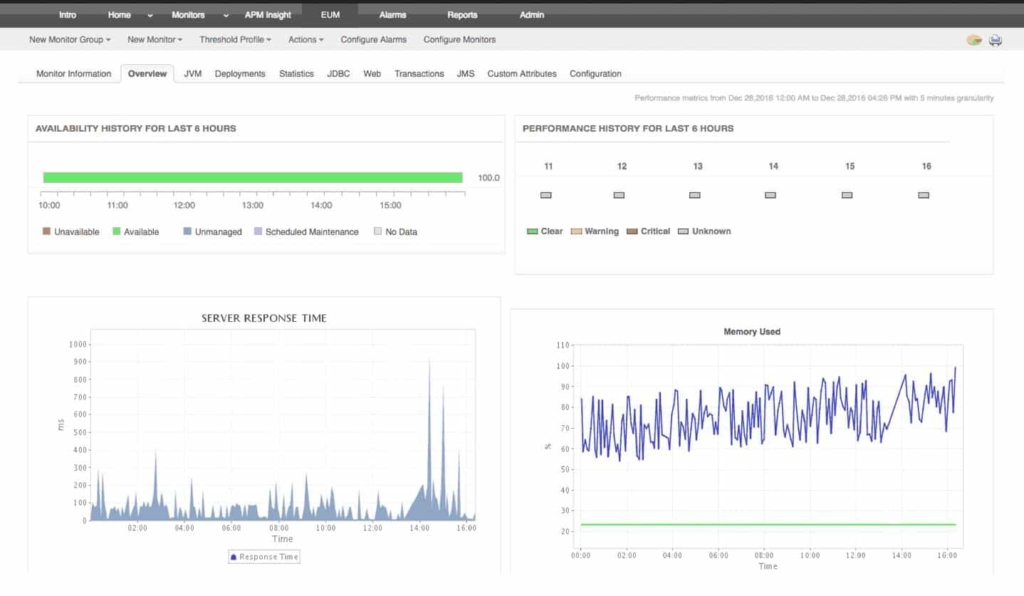
Site24x7 is a cloud-based platform of system monitoring tools and the Site24x7 Application Performance Monitor is part of that stable. The APM has website testing capabilities as well as the ability to track application performance and trace through to server and network activity to identify the root causes of performance problems.
Key Features
- A hosted system that includes processing and storage as well as the monitoring software.
- The system detects all application dependencies and creates an application stack that eases root cause analysis.
- A series of performance thresholds that trigger alerts.
- Notification of problems that can be forwarded to technicians via SMS, email, voice call, or instant messaging post.
- Server and network monitoring.
- Log servers and management.
- The ability to monitor servers running Linux and Windows Server in a single unified tool.
Why do we recommend it?
We recommend Site24x7 Application Performance Monitor for its versatile monitoring capabilities across multiple platforms and its strong focus on website performance analysis. The tool’s automated alerts free up IT staff to focus on other important tasks.
The Site24x7 Application Performance Monitor has a particularly strong armory of website performance analysis tools. These include real user monitoring, browser-based synthetic transaction monitoring, and uptime and response time monitoring services launched from 110 locations around the world.
The system alerts generated by Site24x7 cover all of the performance metrics tracked by the APM. These allow IT department technicians to get on with other tasks rather than spending time watching normal operations in case problems arise.
Who is it recommended for?
This tool is ideal for IT departments that manage diverse application landscapes, especially those that include a variety of programming languages like PHP, .Net, Ruby, and Java. It’s also well-suited for teams that require real-time performance metrics and analysis, both for traditional servers and cloud-based systems.
Pros:
- Allows monitoring application performance for different platforms like PHP, .Net, Ruby, Java, etc.
- Run analysis on application from anywhere whether operating on mobile devices or cloud servers
- Easily access the mobile application performance metrics in detail
- Create insightful reports for varied time periods using Site24x7
- Allows users to check on errors in the code and technical issues faster
Cons:
- Users may take time to understand all the features and functioning of Site24x7 as it is a detailed platform.
Site24x7 Application Performance Monitor starts at $35 per month when paid annually. You can try it on a 30-day free trial.
2. ManageEngine Applications Manager – FREE TRIAL
ManageEngine offers a variety of products aimed at IT management including hardware, software, physical as well as virtual infrastructure. ManageEngine Application Manager starts at $1995 and is good for up to 50 devices. It provides coverage for infrastructure management, network monitoring, and Application Performance management (APM).
Why do we recommend it?
We recommend ManageEngine Applications Manager for its comprehensive coverage of IT management needs, including infrastructure, network monitoring, and application performance management. It offers deep insights, customizable dashboards, and supports a wide range of applications, making it suitable for IT generalists.
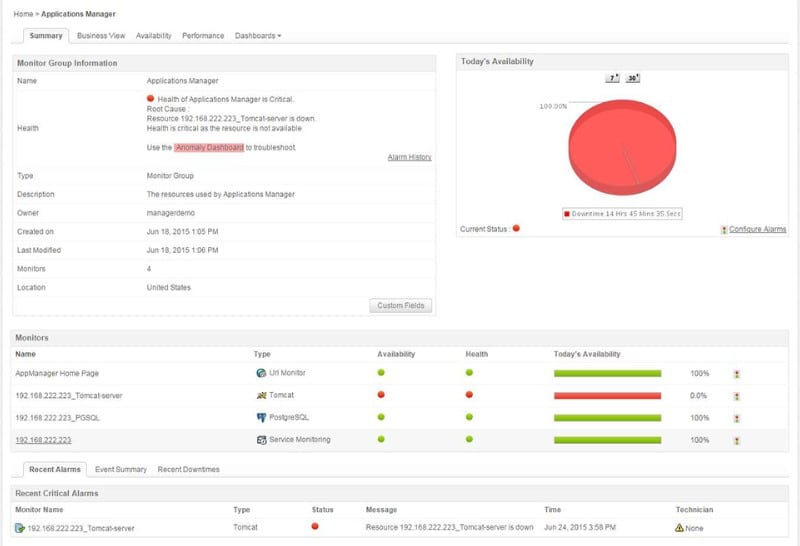
The Applications Manager plug-in brings a long list of supported commercial applications. Its PitStop website feature provides searchable, user-contributed content that includes downloadable scripts and templates plus a Q&A forum.
The Applications Manager dashboard is highly configurable and easy to navigate. The default page comes with widgets including several with sample data to give users a feel for the types of information that can be displayed.
Users can simply click and drag the widgets to arrange them according to preference.
They can also add and remove it with a few clicks. It also comes with over a hundred reporting profiles. Custom reports can be quickly created from the main page. Reports can be scheduled and then automatically emailed in either PDF or Excel format.
A free edition of this tool will allow users to perform basic monitoring of up to 10 devices for a single user. Overall, the OpManager contains features that manage applications, infrastructure and networks. It has a good selection of features for IT generalists.
Who is it recommended for?
This tool is ideal for IT professionals responsible for managing various aspects of IT infrastructure, including applications, networks, and infrastructure. It’s suitable for organizations of different sizes, thanks to its scalability and customizable features.
Pros:
- Offers full visibility and deep insights into application performance
- Quickly identifies and resolves performance issues with minimal overhead expenses
- Users can access the customizable dashboard even with mobile devices
- Monitors Web applications, ERP suites, logs as well as databases
- Users have access to watch over 50,000+ applications
Cons:
- It may take some time to become proficient in the detailed edition and understand all the features and functions.
ManageEngine Application Manager starts at $715 and goes up from there depending on devices. You can access a 30-day free trial.
3. Paessler PRTG – FREE TRIAL
The Paessler PRTG Network Monitor, developed by German tech company Paessler GmbH, is a unified infrastructure management and network monitoring solution. It provides visibility on individual alerts and performance counters giving a quick overview of the entire network.
Why do we recommend it?
We recommend Paessler PRTG Network Monitor for its comprehensive infrastructure management and network monitoring capabilities. It offers a user-friendly dashboard, responsive UI, and supports a wide range of devices and services. The ability to customize reports and set up alerts makes it a valuable tool for IT professionals.
The PRTG Network Monitor allows users to monitor network devices such as switches, routers, and access points, as well as infrastructure such as servers, storage, workstations, applications, and services.
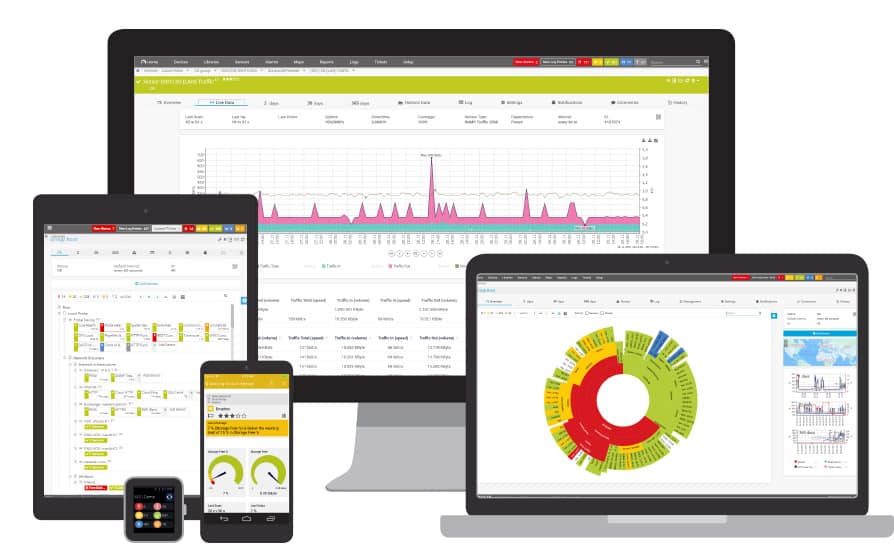
It displays a modern dashboard with analytics-style graphs with a streamline menu and a very responsive UI, meaning it optimizes itself for whatever device is being used to access it (desktop, tablet, smartphone). It works as one core server along with probes deployed throughout the network.
The core server installs a local probe as well as a proprietary database, web server, report engine, notification and other key features.
The PRTG Network Monitor uses probes to monitor the network and identify devices and services users may wish to begin monitoring. As devices are discovered, probes enumerate the services and hardware it can monitor, it will then add the devices to the dashboard.
Users can create groups to form collections of similar devices in order to configure settings once for an entire group of devices. Templates are provided to help users set up quickly and reports can be customized to a specific security context to prevent users overreaching their permissions.
The software also provides recommendations from sensors based on network scan results. Each data point requires a sensor, which can be monitored or ignored as needed. Administrators can add, pause or remove sensors depending on network requirements.
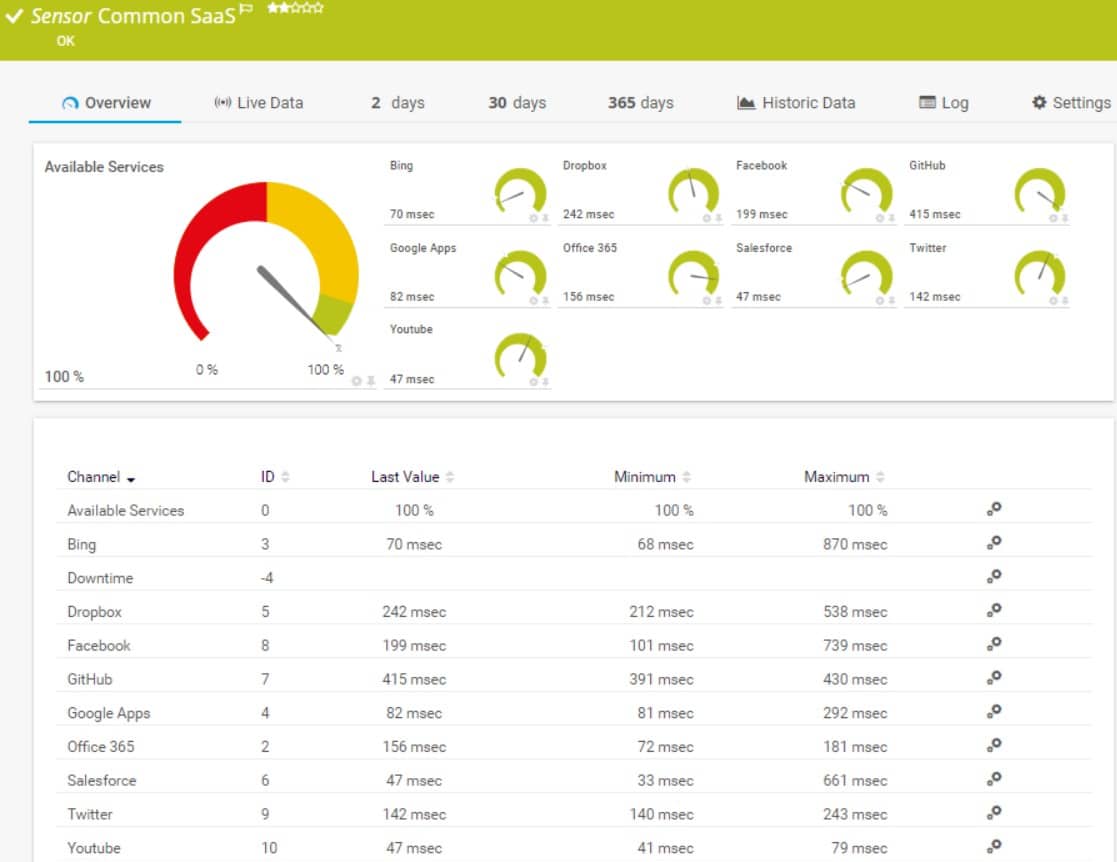
A free version of the software is available but is limited to 100 sensors. The licensing is based on sensors, not agents.
And each device will require between 5-10 sensors to fully monitor the device. The PRTG Network Monitor can be purchased for a one-time cost of $1,600 for 500 sensors.
Who is it recommended for?
This tool is recommended for IT professionals and organizations looking for a unified solution to monitor network devices, infrastructure, applications, and services. It’s suitable for businesses of various sizes and offers scalability through sensor-based licensing.
Pros:
- Tracks SQL, Exchange as well as server software
- Watch over cloud and virtualized application with PRTG
- It provides detailed statistics about each application
- Sends prompt alert on discovering a defined status or performance issues
- Track all applications and resource usage
Cons:
- New users might find it challenging to understand the advanced features
You can start a 30-day free trial which is indefinite for up to 100 sensors.
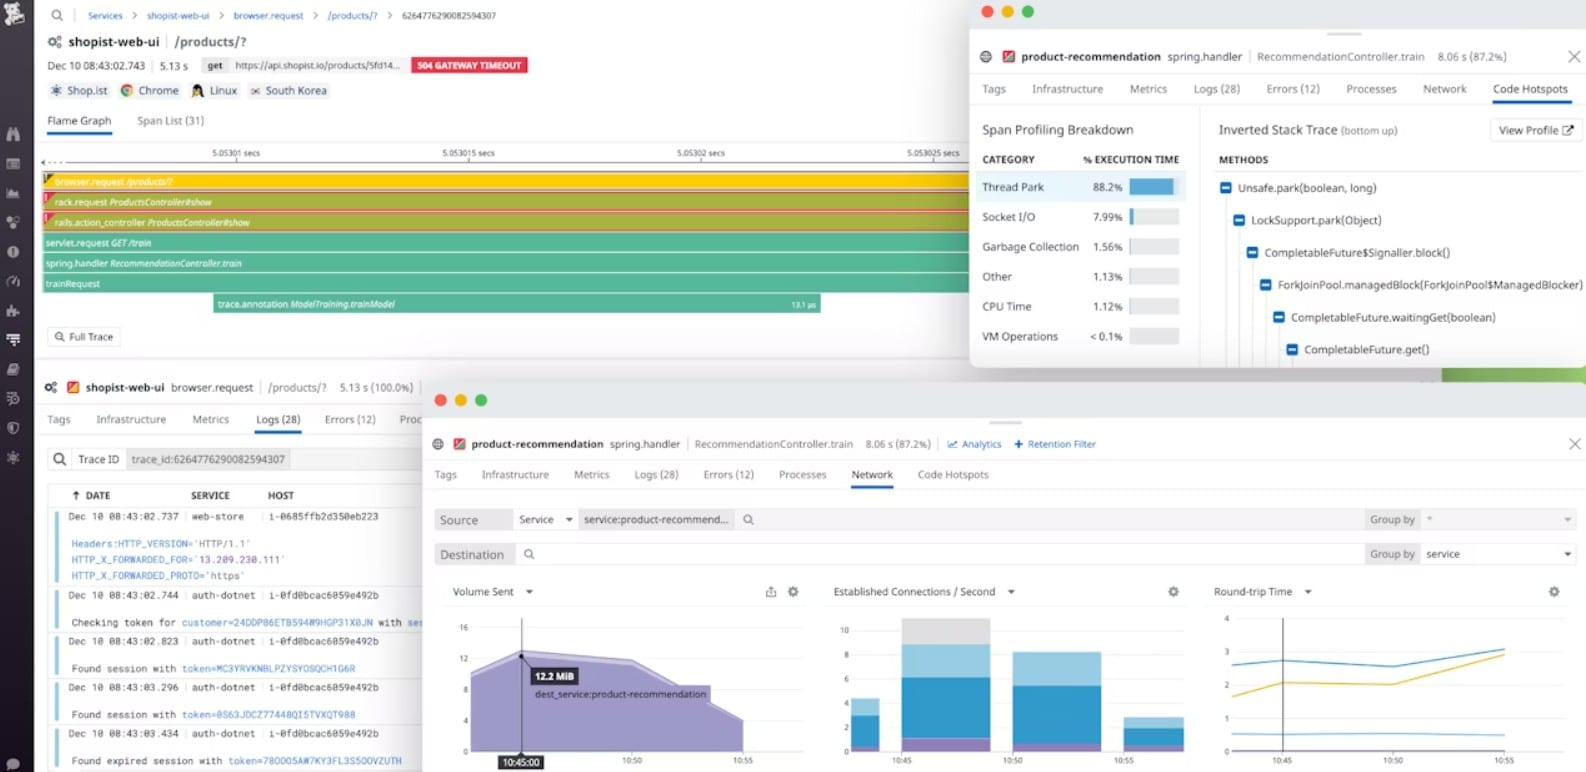
4. Datadog APM
Datadog APM is part of a cloud-based platform of system monitoring and management tools. As it is cloud-based, this service doesn’t mind where the servers that host monitored applications are located. It will unify the monitoring of all of your applications even if they are hosted on servers distributed in different data centers. The tool is just as able to monitor cloud servers and their applications as it is with on-premises resources.
Key features
- Visibility of the application stack from the user through to storage servers.
- Problem tracing facility for performance issue investigation
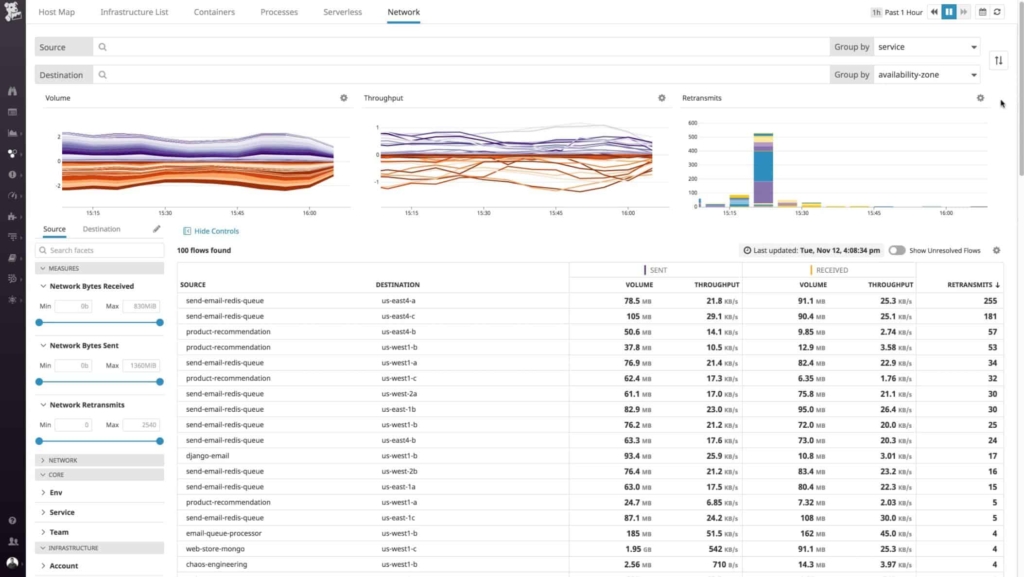
- Live metrics reporting
- Summary screens and drill-down paths to individual application performance views
- Data visualizations, including color-coded graphs and charts
- Performance thresholds and an alerting mechanism
- AI-driven synthetic monitoring
- Performance anomaly detection
- Log file analysis
- A drag-and-drop app performance comparison time-series chart
- Customizable screens
- Pre-written analysis reports
Why do we recommend it?
We recommend Datadog APM for its cloud-based system monitoring and management capabilities. It offers visibility into the entire application stack, from user interactions to storage servers. The tool provides real-time metrics, performance tracing, and anomaly detection, making it valuable for identifying and resolving performance issues.
As a cloud-based service, the hosting for the service with associated storage space is provided in with the price of the APM. Technicians can access the dashboard from anywhere through any standard Web browser.
Who is it recommended for?
Datadog APM is recommended for IT professionals and organizations looking to monitor and manage applications across various environments, including on-premises and cloud-based. It’s suitable for businesses of all sizes and offers a holistic view of network performance and application health.
Pros:
- Monitor infrastructure, event logs as well as application running on different environment
- Generates actionable insights and helps quickly find bugs in the application
- Identifies customer requests via app analytics
- Offers full visibility and a holistic view of network performance and health status of databases
- Sends alerts and notifications in real-time on discovering live anomalies
Cons:
- Trial periods are short for testing
- Navigation to new sections can be confusing
The APM package is customizable with a base price of $31 per host per month.
5. SolarWinds Server and Application Monitor
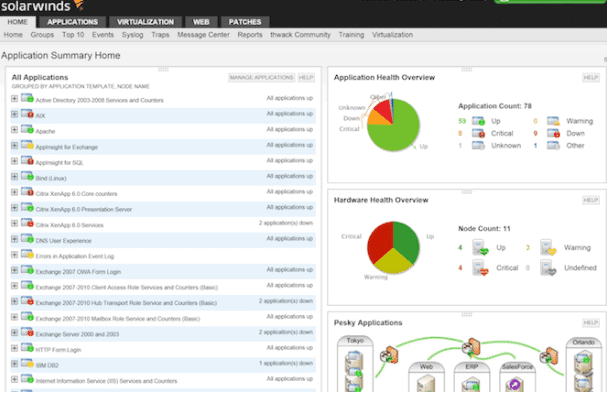
Server & Application Monitoring provides admins with tools to monitor critical servers and applications. They keep a watchful eye on the specific vital signs unique to each application.
SolarWinds’ AppInsight is a newly added feature to its SAM and it simplifies the overall monitoring and alerting experience for complex software systems like Exchange and SQL Server.
AppInsight helps administrators streamline application deployment and achieve faster time to value instead of manually configuring each app template to identify what’s important. It includes default support for the following:
- Intelligent Discovery and Single Click Configuration
- Transaction Log Storage Usage and Backup Status
- Database Availability Groups Status Checks
Why do we recommend it?
We recommend SolarWinds Server and Application Monitor for its comprehensive monitoring capabilities and ease of use. Its AppInsight feature streamlines complex software system monitoring, making it a robust tool for managing servers and applications efficiently.
The dashboards provides an overview of all critical items which makes it easy for users to determine which systems and applications require attention and which ones are working properly.
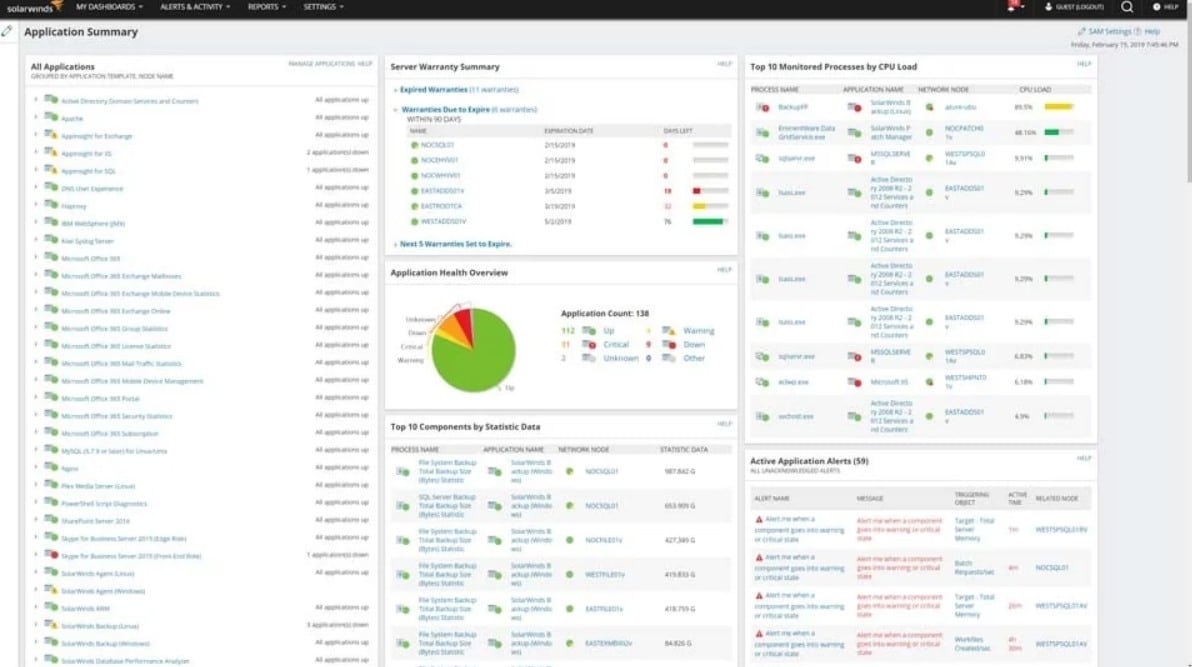
It shows all the important information about the environment including current application status, server warranty status, server hardware health, applications that are currently down, applications currently having issues, processes utilizing high amounts of CPU, and any recent events.
Dashboard items are easily navigated and analyzed by simply hovering the mouse pointer at each application name.
SolarWinds provides a highly detailed and structured approach to application monitoring which results in lower resolution times on outages and users will be able to identify potential issues more quickly. Pricing is extremely competitive and can be found on their website below!
Who is it recommended for?
This tool is ideal for IT administrators and teams who need to monitor a mix of servers and applications, including those on AWS and Azure. It’s especially useful for organizations that require detailed monitoring, quick issue identification, and fast time-to-value in their application deployments.
Pros:
- Hardly takes any time to get started
- Offers infrastructure dependency mapping
- Easy to track critical servers, AWS IaaS, PaaS, SaaS and Azure
- Offers access to 1,200+ out-of-the-box monitoring and 1000 community templates
- Track server warranty status, server hardware health and current application status
Cons:
- It would be better if the trial time extended.
SolarWinds Server and Application Monitor is offered on a 30-day free trial
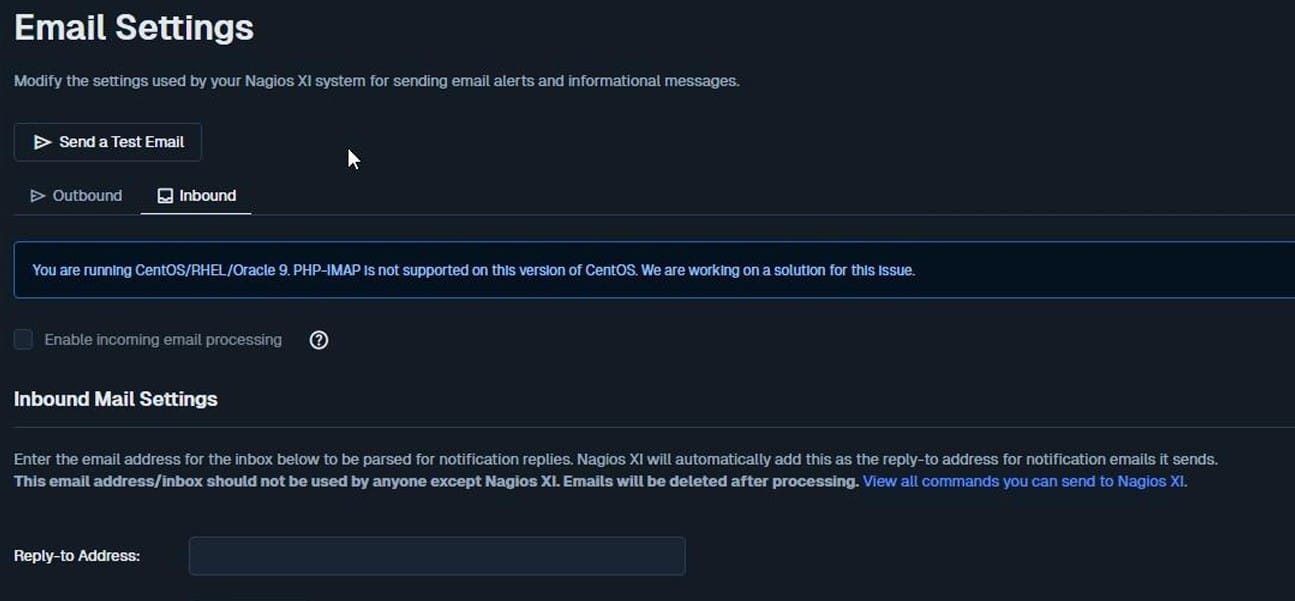
6. Nagios XI and Core
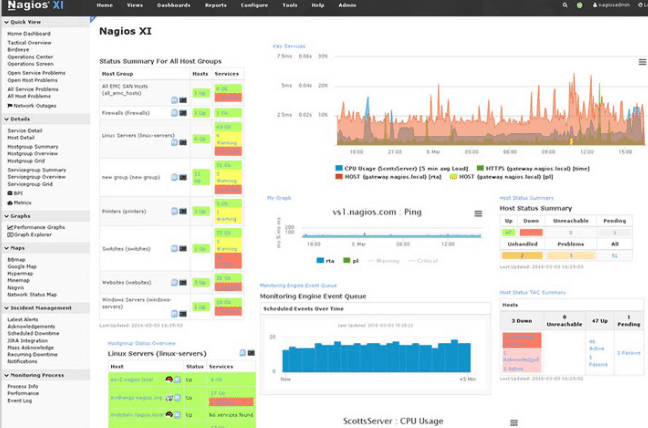
Nagios XI is relevant for any sized network and can be purchased starting at $1995 for 100 nodes. It is a network monitoring tool for Linux that is highly customizable and scalable.
Key features
- Easy installation
- Incredible flexibility
- Easy to navigate web-interface
- Huge variety of plugins available
- Alert and Reporting system
- Event handlers that help with troubleshooting
- Capacity Planning and trending
Why do we recommend it?
We recommend Nagios XI for its comprehensive network monitoring capabilities. It offers easy installation, high flexibility, and a user-friendly web interface. With a wide range of plugins, event handlers, and capacity planning features, Nagios XI provides a holistic view of your network. It also excels at alerting and reporting, making it a valuable tool for IT professionals.
Administrators can create reports that provide a birds-eye view of the entire network, its databases, configurations, traffic and performance. It maps all devices and link connections. Nagios provides pre-configured templates and wizards to create comprehensive reports. All programs, processes and applications will be detected and monitored automatically. It also detects and alerts to any rogue computer it finds on the network.
Nagios XI will email admins every time it spots trouble. Users can set and classify alerts for all nodes connected to customize reporting. This results to an effective and efficient alert system. Its user interface is pretty straightforward and easy to manage. Administrators can import LDAP (Lightweight Directory Access Protocol) and AD (Active Directory). These servers can be configured to authenticate users.
Who is it recommended for?
Nagios XI is recommended for organizations of all sizes looking for a customizable and scalable network monitoring solution. It is suitable for IT administrators and network managers who want to keep a close eye on their servers, applications, and network performance.
Pros:
- Keep an eye on all servers and applications
- Clear visibility into all applications and data
- Allows configuring and classifying alerts for all nodes
- Allows integrating with third-party applications
- Offers pre-configured templates and insightful reports
Cons:
- Poor assistance by open-source version
- Installation process is complicated
The price of the product starts at $1995 and you can download it from here.
7. WhatsUp Gold
Progress WhatsUp Gold can be described as a one-product-fits-all. It has broad support for customization, scripting, and management standards. The pricing starts at $1755 for up to 25 devices and it covers infrastructure management, application performance management (APM), and network monitoring making it one of the best choices out there for small to midsize businesses.
Why do we recommend it?
We recommend WhatsUp Gold for its versatility and broad support for customization, scripting, and management standards. It offers a comprehensive solution for infrastructure management, application performance management (APM), and network monitoring. WhatsUp Gold is particularly suitable for small to midsize businesses due to its affordable pricing and user-friendly interface.
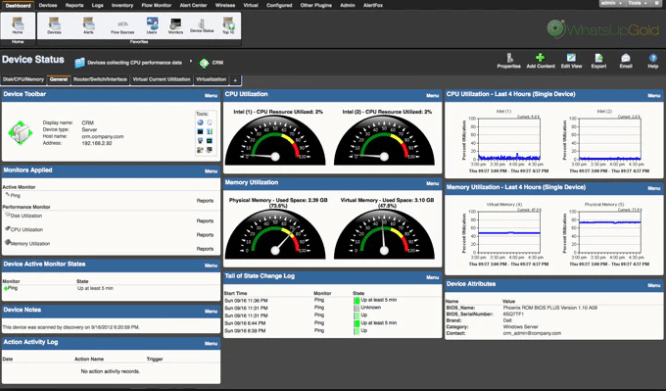
WhatsUp Gold offers a web-based user interface and a Windows application for managing different aspects of the program. It includes a Layer 2 topology map that shows a substantial amount of detail such as system name, IP address and the port number connection on a device.
Users can easily swap to a details view with a single click and see most of the same information in tabular form. There is a designated Problem Area tab that gives a quick overview of all devices that are down or with down active monitors. Notifications can then be sent through SMS message or email.
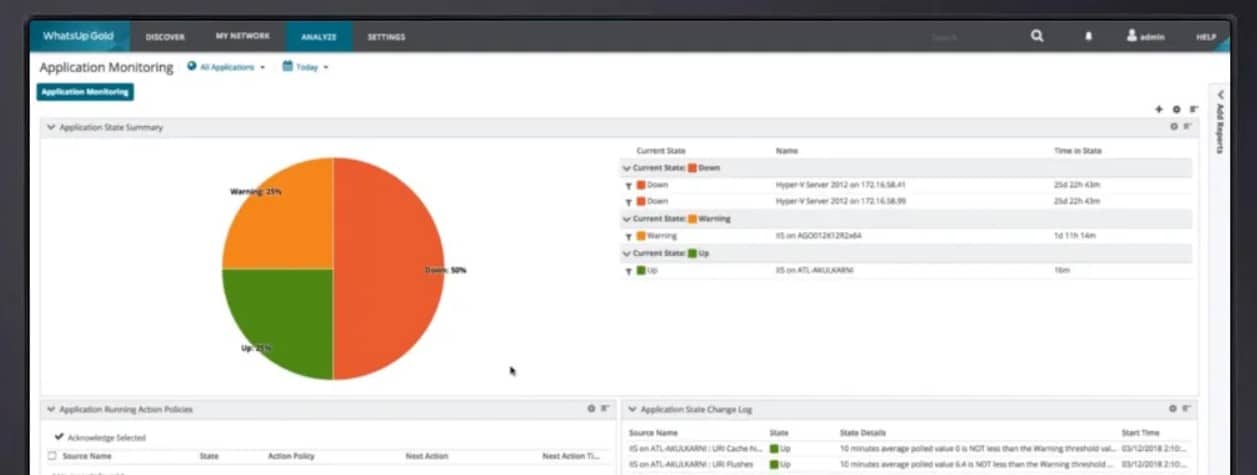
Once installed, the WhatsUp Gold APM starts with a dashboard showing multiple application states (up, warning, down, maintenance, and unknown). The administrator can then modify the thresholds and alerts processes for each items. Customizable dashboards make it easy to keep track of all historical status reports.
Who is it recommended for?
WhatsUp Gold is recommended for small to midsize businesses looking for a single, all-encompassing network monitoring solution. It is suitable for IT administrators and network managers who want to monitor infrastructure, applications, and network performance with ease.
Pros:
- User can log all of their applications during the automates setup process.
- Monitors business-critical applications and their performance in real-time
- Sends alerts on discovering critical performance issues
- With the Current Status Dashboard, you can quickly see how well each programme is performing.
- Create multi-step Action Policies that can be executed when a monitored component or an application changes its status
Cons:
- Navigation requires improvement
- If text notifications are not formatted properly, they may become confusing
Visit the website to submit a Quote.
8. Zabbix
Zabbix is being offered for free on a general public license. The source code is also open, allowing users to modify the program according to their preference. As an infrastructure management tool, Zabbix allows users to define monitoring hosts using pre-configured templates. It will then search the network and automatically discover virtual machines and hypervisors and then set up specified monitoring hosts.
Why do we recommend it?
We recommend Zabbix for its open-source nature, scalability, and extensive monitoring capabilities. Zabbix is a versatile tool that allows users to define monitoring hosts using pre-configured templates, automatically discover devices and applications, and scale from small environments to large organizations.
This tool can easily scale up from a tiny environment with a handful of devices to organizations with tens of thousands of devices and applications. It can be used to gather gigabytes of monitoring data per day.
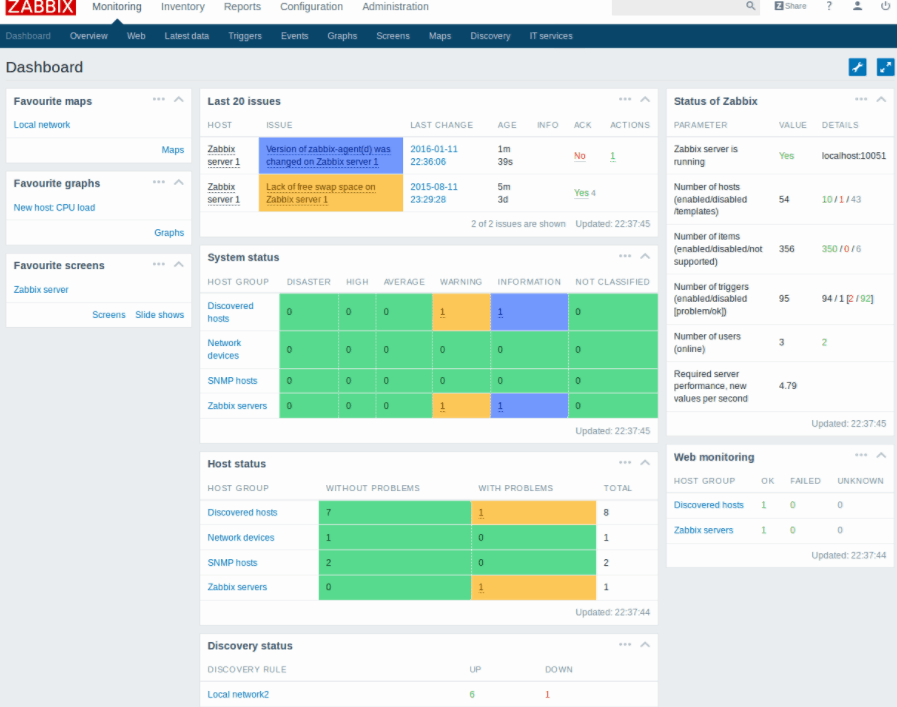
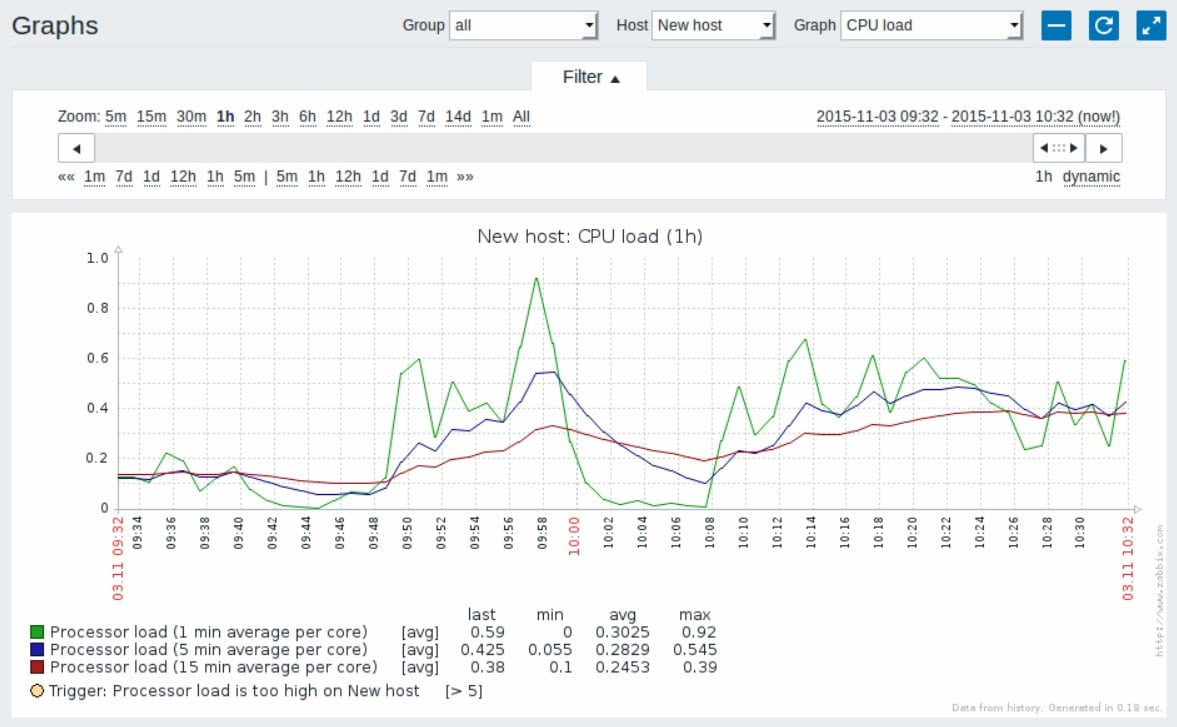
After gathering data, it processes to produce graphs and charts in an easy-to-use interface. Users can view as many graphs as they need in a single page. The interface is browser-based making it accessible from anywhere and supports 22 languages.
Standard graphs are being produced on runtime. Users can view them by clicking Graph next to a specific time. Users can then create custom graphs that compare any data items in whatever visual format they prefer.
Bar reports are also available. The tool also features maps. Users can select which portion of a map they wish to see in detail, and to choose data sets to include and ignore. Maps are highly configurable. They can be live and constantly updated.
Zabbix can send alerts by email, text message or Jabber. It can also be configured to initiate help desk tickets whenever it encounters issues on the network. Some issues can easily be fixed by a simple refresh. Zabbix can be configured to execute simple scripts such as restarting a device.
If the automated response doesn’t take care of the problem, the Escalations feature can notify engineers, network admins or the tech support team.
Who is it recommended for?
Zabbix is recommended for organizations of all sizes that require a flexible and customizable infrastructure monitoring solution. It is suitable for IT administrators, network engineers, and technical teams who need to monitor and manage a wide range of devices and applications.
Pros:
- No vendor lock-in is available for Zabbix
- Sends alerts instantly to admins and resolves issues faster
- Helps in planning capacity expansion using Zabbix Agent
- Tracks application performance and other metrics in real-time
- The Graphic User Interface is simple enough for even non-technical users
Cons:
- Documentation can be confusing
- Improving the automation feature is essential
Zabbix is a Free (Open source) software that can be downloaded from here.
