

Finding the Best Linux Monitoring Software is Crucial to ensuring uptime and we’re here to show you which ones are the top picks for all around management and monitoring of Ubuntu, Centos, Redhat, and any other distro!
Though Windows is one the most popular operating systems for Servers, there are also a substantial number of Linux Servers spread around the world which practically run the internet.
Just like Windows, your infrastructure running on Linux has to be monitored, and this is why we have come up with the best tools and software available today for Linux.
Here is our list of the best Linux monitoring tools:
- ManageEngine OpManager – EDITOR’S CHOICE A network and server monitor that is able to monitor servers with any operating system over a network and across the internet and can also include cloud servers. Runs on Windows Server and Linux. Download a 30-day free trial.
- Site24x7 Linux Monitoring – FREE TRIAL A monitor for networks, servers, and applications that can watch the performance of Linux servers and servers running Windows Server. This is a cloud-based system. Access a 30-day free trial.
- FirstWave Open-AudIT – FREE TRIAL An asset discovery and monitoring tool that monitors system configuration on all devices and endpoints and creates a software inventory. Available for Windows Server as well as Linux. Access the free trial.
- Datadog Linux Monitoring A server and services monitoring tool that maps all application inter-dependencies and server resources. This is a cloud-based system.
- Zabbix An infrastructure monitor that covers networks, servers, and applications and is free to use. The software installs on Linux, macOS, and Unix.
- SolarWinds NetFlow Traffic Analyzer A network traffic monitor that will trace traffic between all devices on a network regardless of operating system. This tool installs on Windows Server.
- Nagios Core A free infrastructure monitor that can be expanded by thousands of plugins that are available for free from the user community. Installs on Linux.
- OpenNMS Horizon A free network monitoring system that monitors networks. Runs on Linux.
Related Post: Best System Monitoring Software
The Best Linux Monitoring Tools and Software
Here are some tools that could come in handy to monitor your Linux-based systems.
Let’s take an in-depth look into each of these tools and see what they have to offer in regards to monitoring your Linux systems!
1. ManageEngine OpManager – FREE TRIAL
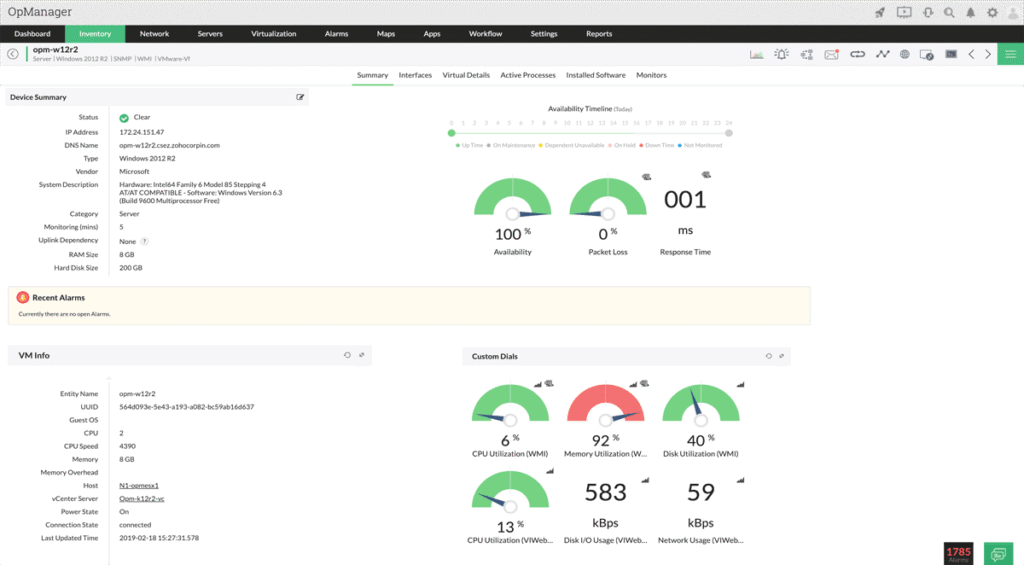
ManageEngine OpManager is a widely known tool for managing your Linux Servers and Network devices from a centralized dashboard! It boasts an easy-to-use GUI and has loads of options for monitoring in the most complex Linux systems and networking devices/switches.
OpManager comes with an Array of capabilities to ensure your protected and monitored at all times of the day.
Key Features
- Monitoring Physical & Virtual Linux Servers
- Robust Alarm, Notification and Alerting Systems
- Create Custom Dashboards & More to see multiple Views of your infrastructure
- Auto-discovery of Devices & Systems in your Network
- Monitor Linux Hardware including CPU, RAM, Heat, and More!
- 3D Racks view for Visualization
- Fail-Over and High-availabitliy Support
- and much much more!
Why do we recommend it?
We recommend ManageEngine OpManager for its exhaustive capabilities in monitoring both physical and virtual Linux servers, as well as its robust alerting systems. Its versatility in managing a wide array of network devices and servers makes it a go-to choice for IT management.
Who is it recommended for?
ManageEngine OpManager is ideal for IT professionals and system administrators tasked with maintaining complex Linux systems and heterogeneous network environments. Businesses that require high availability and fail-over support will find this tool invaluable for ensuring optimal performance.
Pros:
- Helps businesses ensure the availability and performance of their IT infrastructure.
- Performs real-time monitoring and analysis to help organizations manage their networks more efficiently.
- Improved visibility into network performance
- Helps keep an eye on Hyper-V, VMware, Citrix, and Nutanix HCI servers
- Offers greater control over their IT infrastructure and ensures that it is running optimally at all times.
Cons:
- Topology-based maps need attention and improvement
Start by downloading a 30-day free trial.
EDITOR'S CHOICE
ManageEngine OpManager is our top pick for Linux monitoring software because this system discovers and tracks the statuses of all devices counting or connected to your network. This remit includes switches, routers, and any other network equipment that monitors and controls traffic on your network – some of those could be running Linux. The tool also keeps constant vigilance over endpoints running Linux. The OpManager is delivered as a software package for Windows Server and Linux. The system is also available as a service on the AWS Marketplace and on Azure Marketplace. So, you can run this tool on a Linux server or virtual server. Businesses that don’t have any Windows servers on site could easily use this monitoring package, while many of the rival network monitoring systems are only available for Windows Server.
Download: Get a 30-day FREE Trial
Official Site: https://www.manageengine.com/network-monitoring/download.html
OS: Windows Server, Linux, AWS, and Azure
2. Site24x7 Linux Monitoring – FREE TRIAL
The Site24x7 Linux Monitoring module is a cloud-based monitoring system that focuses on the performance of all of the IT services that lie behind user-facing software. This includes applications, services, servers, and networks. The tool’s main processing services resident in the cloud but it needs an agent installed on site. There is an agent for Linux servers that watches all infrastructure, including the hosting server itself.
Key Features
The Linux monitoring features of Site24x7 include:
- Linux operating system supervision.
- Support for Debian, Ubuntu, CentOS, Red Hat, Madriva, Fedora, SUSE, CoreOS, Raspberry Pi, and Arch Linux ARM.
- The monitoring of applications, such as LAMP components.
- Syslog and application log management.
- Resource monitors on CPU, memory, disks, and other server resources.
- Unified monitoring of Linux servers with servers running Windows Server and cloud servers
- Integrated multi-site Linux monitoring
- Monitors VMWare, Hyper-V, and Nutanix virtualizations plus Docker container activity.
- Generates an application stack visualization, showing the dependencies of applications through to server resources.
- Includes summary screens, devices focus screens, and service detail screens.
- A web-based console with customizable screens.
- Live performance tracking and historical data analysis utilities.
- Application activity tracing across many applications.
- Performance thresholds and alerts.
- Problem notification by SMS, email, voice call, and instant messaging post.
Why do we recommend it?
We recommend Site24x7 Linux Monitoring for its comprehensive cloud-based monitoring system that not only supervises Linux operating systems but also covers a wide range of Linux distributions and applications. Its unified monitoring capabilities across various platforms and customizable alerts make it stand out.
Who is it recommended for?
This tool is perfect for system administrators, IT professionals, and DevOps teams who require an all-in-one solution for monitoring Linux-based systems, applications, and virtualizations. Its file and syslog change alerts also make it suitable for businesses with strict compliance and security requirements.
Pros:
- Offers visibility over various metrics, including load average, CPU, memory, disk, etc.
- Uses thread count, Memory usage, and other metrics to track the performance of Linux processes.
- Use a single console to track crucial resource metrics and cluster status across Docker and Kubernetes.
- Monitors and send alerts on noticing changes made to files, directories, and syslogs
- Site24x7 Linux Monitoring supports 100+ plugin extensions
Cons:
- The interface can be a little perplexing
The Site24x7 service costs $9 per month if paid for annually. Access a 30-day free trial.
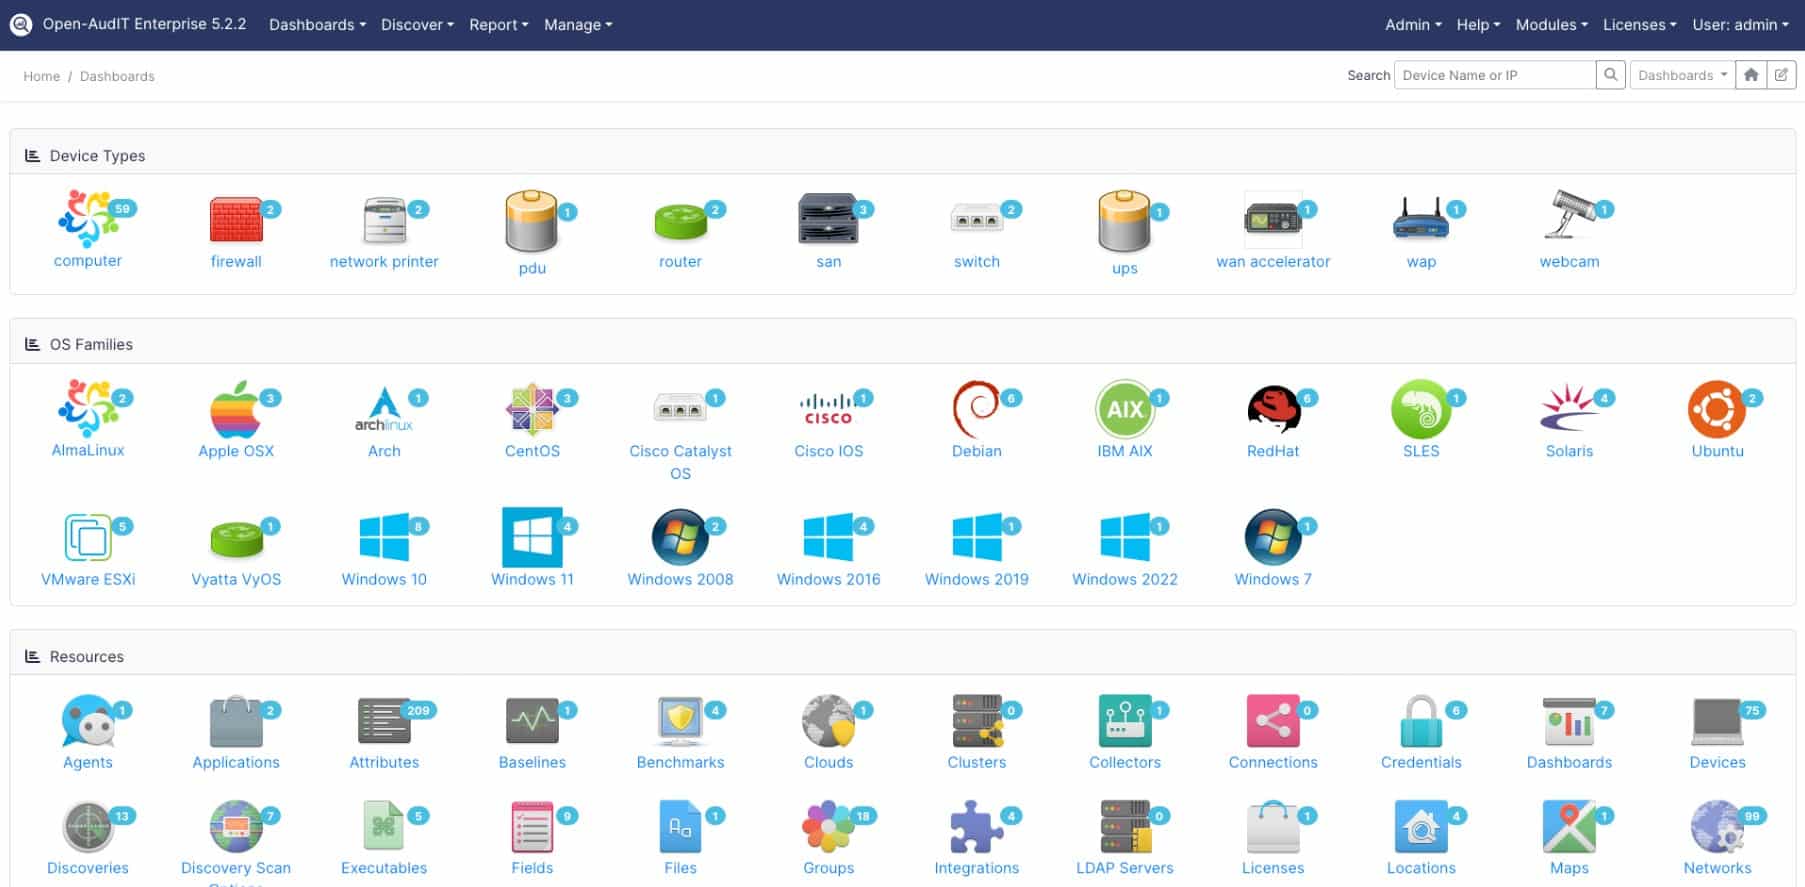
3. FirstWave Open-AudIT – FREE TRIAL
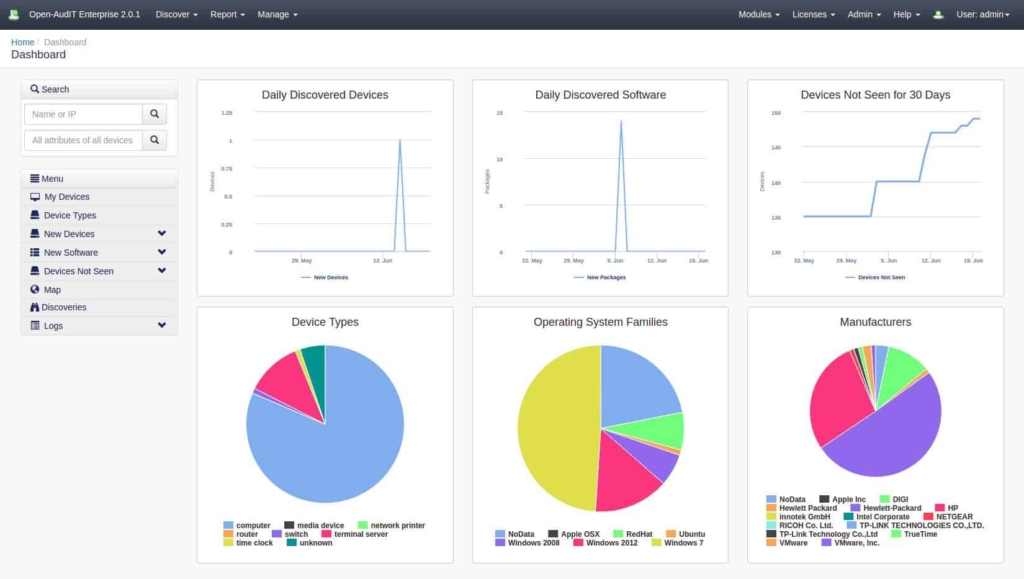
FirstWave Open-AudIT is the hardware and software inventory management module in the suite. The first task that this SaaS tool will perform is a system sweep, identifying each device present and then scans for software, services, and operating system.
Key Features
- Scans a network and discovers all connected devices
- Records the configuration and setup of each device
- Compiles a software inventory of each desktop and server, including those running Linux.
- Creates a software license tracker
- Spots unauthorized devices
- Compiles hardware warranty status reports
- Tracks capacity utilization
Why do we recommend it?
We recommend FirstWave Open-AudIT for its exhaustive approach to hardware and software inventory management. Its capabilities extend from system sweeps and software inventory to tracking capacity utilization and warranty statuses, making it a comprehensive solution.
Who is it recommended for?
This tool is recommended for IT managers, system administrators, and compliance officers who need a detailed view of their network assets, from small-scale to large enterprise settings. It’s particularly useful for organizations that want to keep a tight control on unauthorized devices and software licenses.
Pros:
- An open-source network auditing tool that runs a scan to discover connected devices
- It can be used to monitor networks of any size, from small home networks to large enterprise networks.
- Allows users to detect unauthorized devices
- Offers an easy-to-use graphical user interface for managing network assets
- Monitors capacity utilization and performance over time
Cons:
- Requires a certain level of technical expertise for proper configuration
FirstWave Open-AudIT is available in two editions: Professional and Enterprise. The service is also available for free to cover just 20 nodes. The pricing for each edition is leveled by the number of nodes that are being tracked. The starting price for each module works on a package of nodes. That price is $1,449 to monitor 500 nodes with the Professional edition and $1,199 to monitor 100 nodes with the Enterprise edition.
Access the free version, which covers 20 nodes and is available for Windows Server or Linux.
4. Datadog Linux Monitoring
Datadog is a server to application monitor that specializes in mapping all the services that support a user interface down to the server operating system. This is a cloud-based system.
Key Features
The features of Datadog include:
- Full server performance monitoring software.
- Capability to monitor Linux servers anywhere in the world
- Blends the monitoring of servers with different operating systems.
- Can consolidate the monitoring of geographically distributed servers.
- Monitors virtualization and container activity.
- Monitors the supporting infrastructure behind a front-end such as databases and Web servers.
- Creates a summary resource map of all enrolled servers.
- Offers a drill-down path through server metric screens down to individual server statuses.
- Has a colorful and eye-catching dashboard that includes live status graphical representations.
- Has screens that can be customized by the user through a widget drag-and-drop utility.
- Offers a mapping of application interdependencies.
- Shows which applications are using which server resources and in what quantity at any one time.
- Enables a root cause analysis from application performance problems.
- Includes performance expectation thresholds for server resources.
- The highest plan automatically adjusts thresholds using AI-driven machine learning techniques.
- Creates thresholds on server resource capacity.
- Identifies performance anomalies and system errors.
- Raises alerts when performance or capacity thresholds are breached.
- Forwards alerts as notifications by SMS, email, or Slack message.
- Offer more than 450 integrations to extend monitoring capabilities.
- Offers a trace utility that identifies all of the applications and services that are involved in responding to a user action.
- Mines logfiles for performance issue causes.
- Includes a log file viewer for analysis access.
- Supports server capacity planning.
Why do we recommend it?
We recommend Datadog Linux Monitoring for its robust set of features, including its AI-driven machine-learning techniques for automatically adjusting performance thresholds. Its ability to consolidate monitoring across various server operating systems and locations makes it highly versatile.
Who is it recommended for?
Datadog is ideal for businesses with complex, geographically distributed systems that include a mix of different server operating systems. IT administrators who need to monitor virtualization, container activity, and application interdependencies will find this tool exceptionally useful.
Pros:
- Helps gain insight into the performance of systems
- Runs automated analysis to keep you above infrastructure and applications
- Helps detect anomalies in system behavior and other potential issues
- Helps watch over the health and performance of your servers
- Tracks usage trends over time for better-informed decisions
Cons:
- In certain instances, the documentation is incomplete.
- Some users might find it difficult to navigate new places
Datadog is available in three editions:
- Free — Monitors up to five hosts and has a one-day data retention period.
- Pro – Has a 15-month data retention period and costs $15 per host per month.
- Enterprise – Includes AI-based performance thresholds and costs $23 per host per month.
Get access to more information and a Free Trial of Datadog.
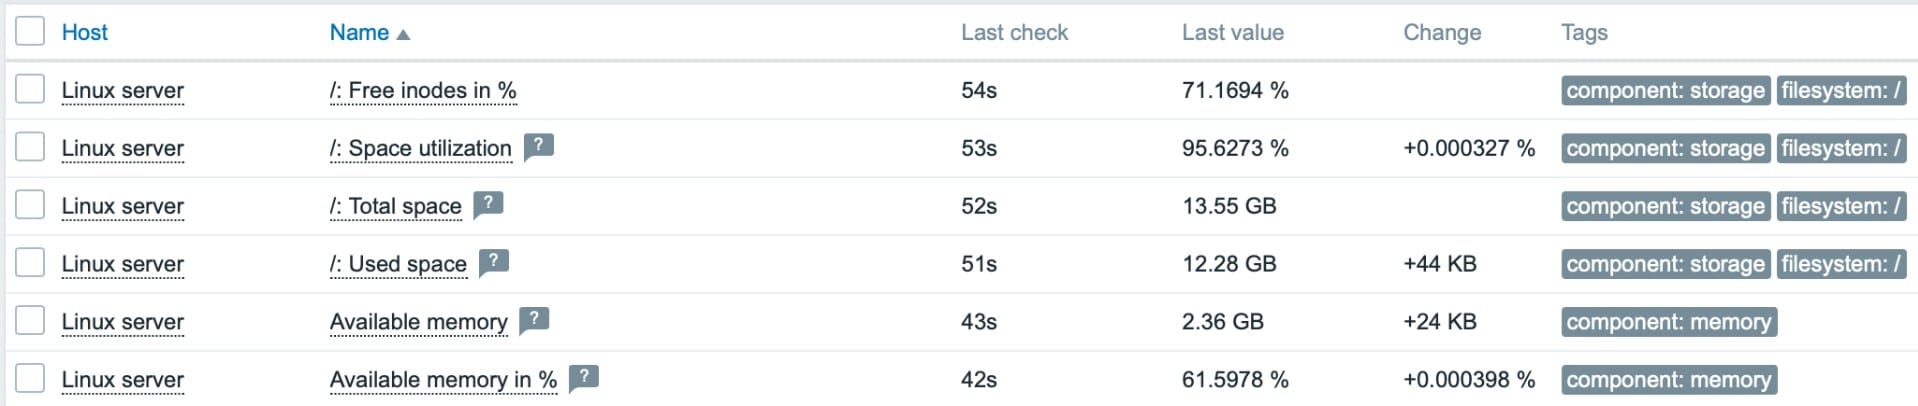
5. Zabbix
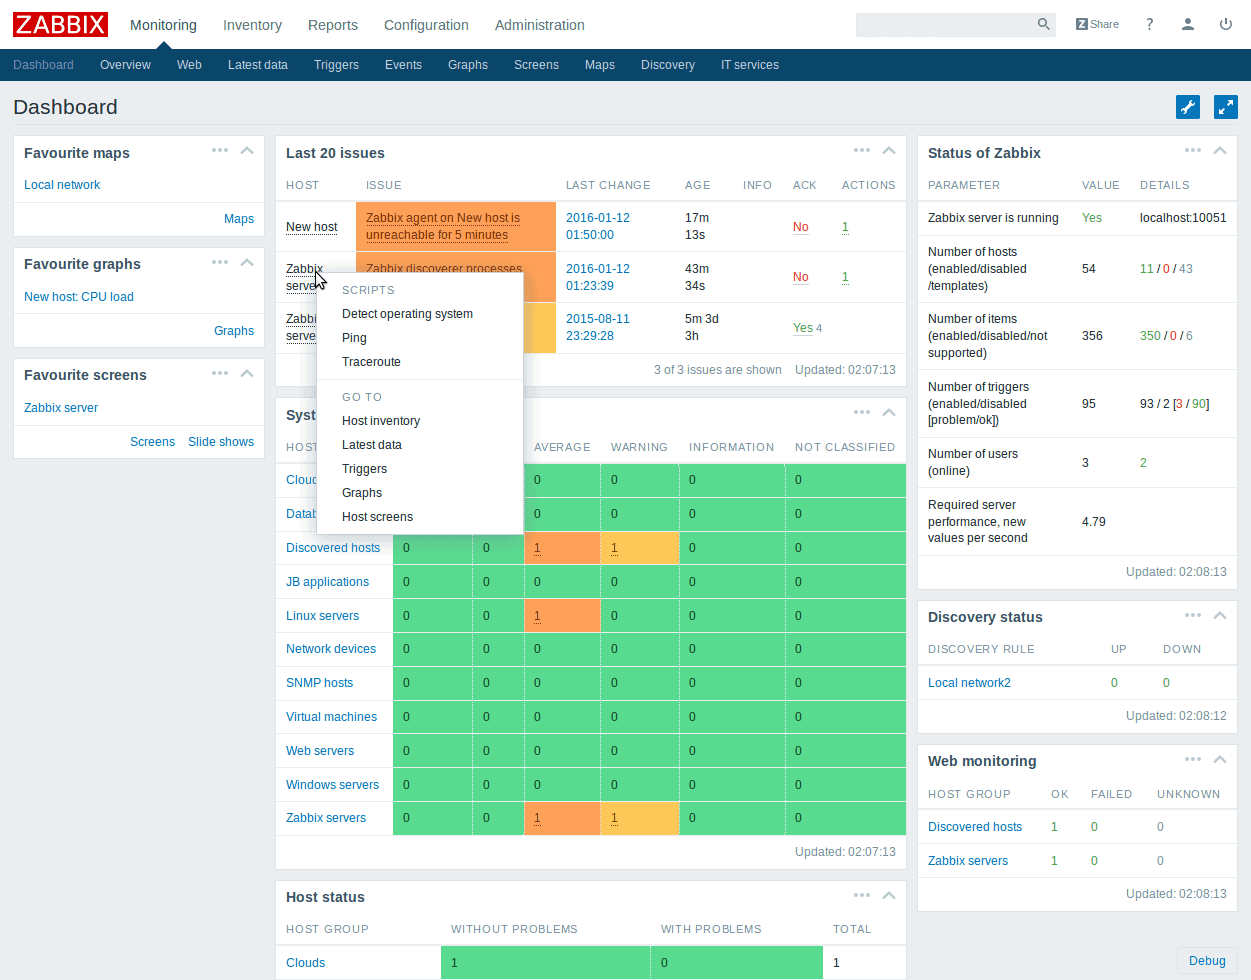
Zabbix is a scalable platform designed for real-time monitoring of metrics collected from different devices within a network.
Key Features
The features of Zabbix are:
- Detects problems as the data comes in from different devices. This means there is no need for a separate module to check for problems.
- Offers a lot of flexibility to define the options you want.
- You can set multiple severity levels too.
- Helps with root cause analysis and anomaly detection
- Predicts usage based on past trends, and this can help with capacity planning.
- Comes with a native web interface that gives a visual overview of your IT environment.
- Graphs, network maps and slideshows greatly enhance the visual appeal of data.
- Reports can be drilled down to the smallest details and can be in the form you want.
- Helps to comply with different industry standards.
- Sends messages and notifications using a wide range of channels.
- Zabbix tries to fix issues automatically as they occur based on past trends.
- You can define service levels for notifications
- Messages can be customized.
- Strong encryption is present among all the Zabbix modules, for an extra layer of security.
- Supports multiple authentication methods such as Open LDAP and Active Directory.
- Code is open for security audits.
- Installs in a few minutes, and is easy to use.
- Configuration templates help to monitor thousands of devices from different vendors.
- There are out-of-the-box templates for popular platforms. Alternatively, you can also build a custom template.
- Scans networks periodically to identify devices and add them to the network map.
- Automatically creates triggers and graphs.
- Monitors devices, even behind firewalls and DMZs.
- Collects data even in the event of network issues or failures
- Allows you to run custom scripts remotely from monitored devices.
- Zabbix can be managed through an API
- Integrates well with many third-party tools
- Supports many operating systems such as Linux, Solaris, BSD, IBM AIX, IBM Power8, HP-UX and MacOS.
Why do we recommend it?
We recommend Zabbix for its comprehensive real-time monitoring capabilities and flexibility in defining options. Its root cause analysis, automatic problem remediation, and strong encryption add additional layers of operational efficiency and security.
Who is it recommended for?
Zabbix is well-suited for organizations looking for a scalable and flexible monitoring solution that covers a wide range of devices and systems. Its user-friendly GUI makes it accessible even for non-technical users, while its strong encryption and multiple authentication methods cater to businesses with stringent security requirements.
Pros:
- It is available for free and has no vendor lock-in
- Provides instant alerts and remediation functionalities
- Use Zabbix Agent to plan capacity expansion
- Aids in real-time tracking of metrics gathered from various equipment and devices
- Even non-technical users can easily use Graphic User Interface (GUI)
Cons:
- The documentation can be perplexing
- It is necessary to enhance the automation feature
Zabbix is 100% Free.
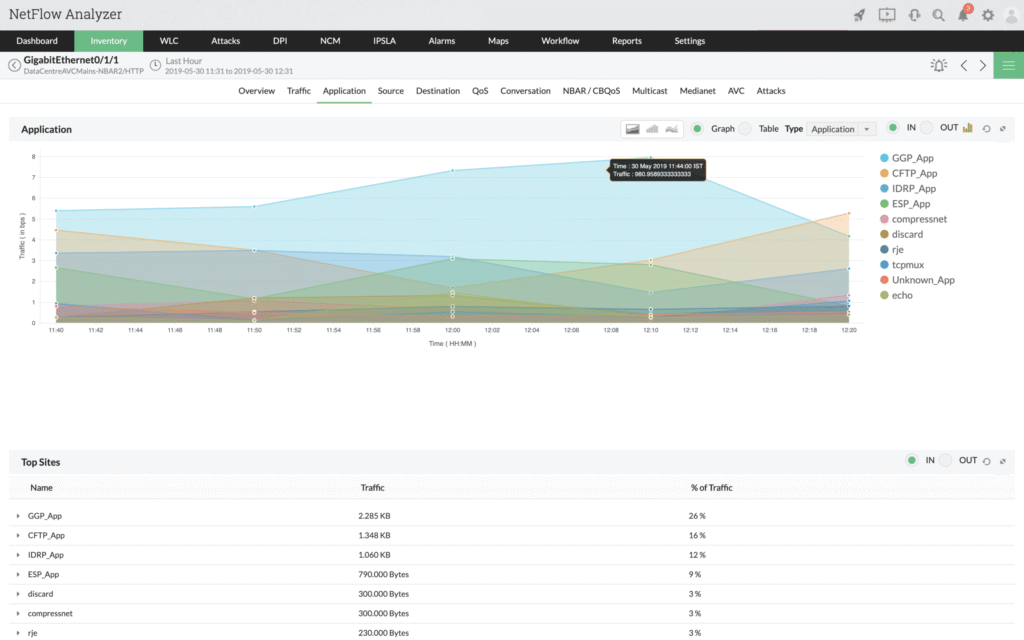
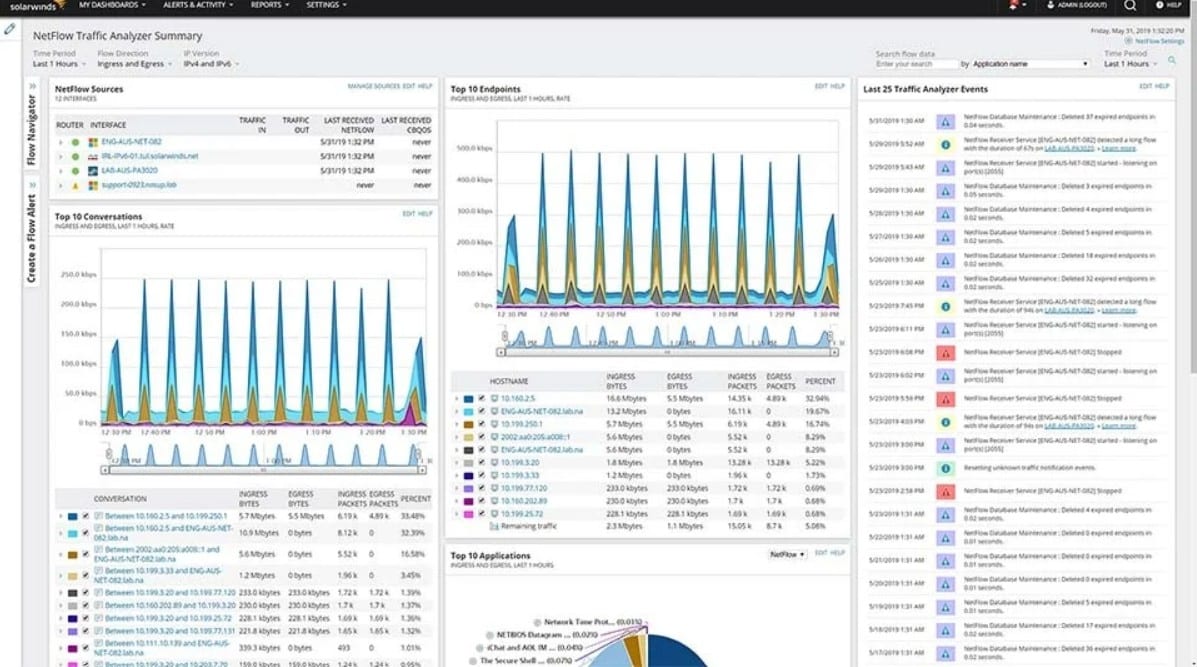
6. SolarWinds NetFlow Traffic Analyzer
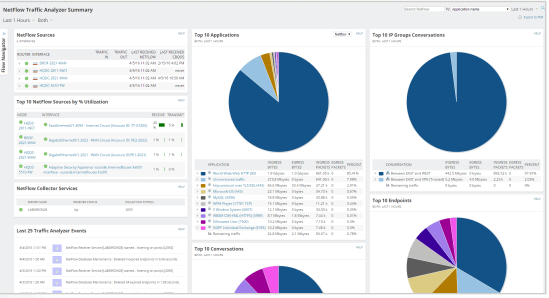
NetFlow Traffic Analyzer comes from SolarWinds, a company known for creating top-of-the-line monitoring tools.
Key Features
NetFlow Traffic Analyzer comes with a host of features that reaffirm its popularity and widespread use. Its features are:
- Identifies which users and applications are consuming the maximum bandwidth.
- Delivers an instant notification when usage exceeds bandwidth utilization threshold.
- Allows to create own IP address groups to see traffic the way you want.
- Get a comprehensive view of your entire network traffic on a single pane.
- Spotting potential problems and getting to the root of it is quite easy, as you can create custom views of the available data.
- You can drag and drop network performance metrics on a common timeline for quick identification of problems.
- Gives the option to see the same data in multiple formats and views to get the right perspective.
- Makes it possible to view network traffic that is segmented by Class of Service methods. It even allows you to measure the effectiveness of CBQoS policies.
- Helps you setup customized views of Internet traffic for ISPs to get a better understanding of how it is balanced across different service providers.
- Provides support to different vendors and technologies such as NBAR2, NetFlow v5, NetFlow v9, sFlow v2, v4,v5, IPFIX, U-Flow, Huawei, Cisco, Extreme Networks, HP, Juniper, Nortel networks, vSwitch, and VMware.
- Flow navigator module helps to create and access personalized network traffic.
- You can view in-depth network reports with just a click of a mouse.
- Leverages existing Active Directory user accounts to make login management simple and easy.
- Integrates well with other products from SolarWinds such as Network Performance Monitor, User Device Tracker and Network Configuration Manager.
Why do we recommend it?
We recommend SolarWinds NetFlow Traffic Analyzer for its comprehensive ability to monitor bandwidth and analyze network traffic. Its diverse range of features, from instant notifications to customizable IP address groups, makes it an indispensable tool for network monitoring.
Who is it recommended for?
This tool is particularly useful for network administrators and IT professionals who require a granular view into their network’s performance and bandwidth usage. Businesses that depend on high-speed, reliable networks will also find this solution invaluable for real-time monitoring and historical data analysis.
Pros:
- Generates interactive graphs and customizable reports
- Full visibility into network status as well as historical behavior
- Helps monitor bandwidth and analyze traffic as well as performance
- Helps identify traffic patterns and troubleshoot network issues
- Helps examine flow records to improve network traffic
Cons:
- Not a great solution for non-technical users
System requirements
You need the following basic system requirements for NetFlow Traffic Analyzer.
- CPU – Quad Core 3 GHz or higher
- Memory – 16GB for Flow Storage Database and 3GB for Main Poller
- Hard drive – 3GB for Main Poller and 20GB for Flow Storage Database
- Operating system – Windows Server 2008 R2 SP1, 2012, 2012 R2 for both Main Poller and Flow Storage Database.
- Database – Shares SQL with Network Performance Monitor
Download a 30-day free trial!
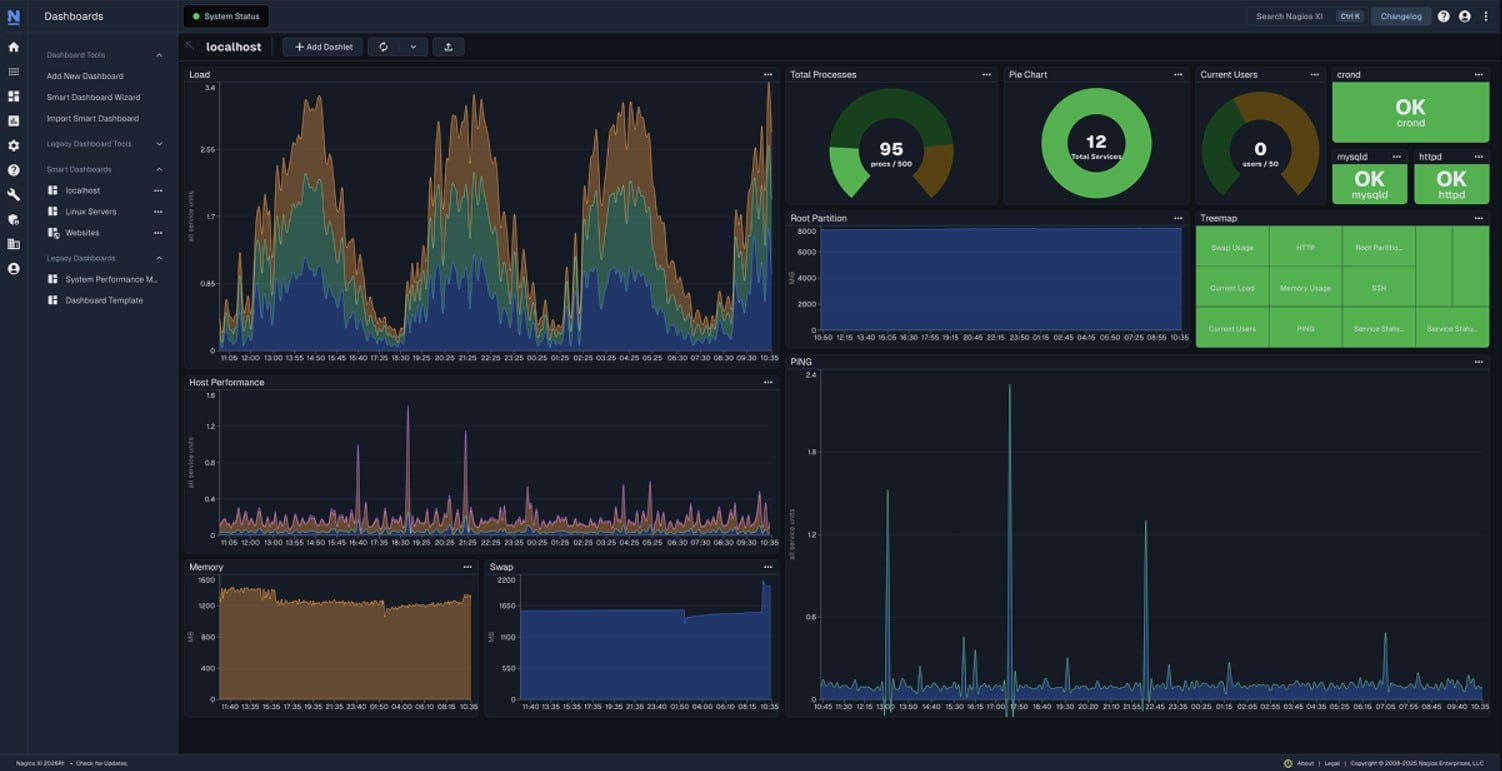
7. Nagios Core
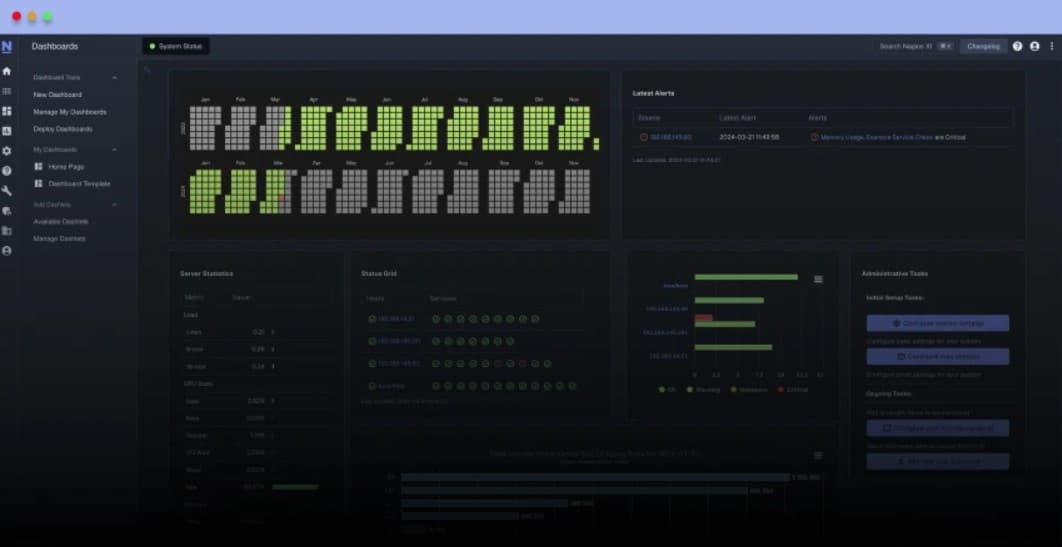
Nagios Core is the alerting and monitoring engine on which hundreds of Nagios applications are built. This alerting and scheduling platform is written in C language for performance reasons and is designed to run natively on Linux/Unix systems.
Key Features
The features of Nagios include the following.
- Monitors network services such as SMTP, POP3, HTTP, NNTP, PING and so on.
- The different metrics of host resources such as processor and disk are also monitored by this tool.
- Comes with a simple plug-in design that enables you to develop your own service checks.
- You can define network host hierarchy using parent hosts.
- Detects hosts that are down and distinguishes them from healthy hosts.
- Automatically rotates log file.
- Supports the implementation of redundant monitoring tasks.
- Comes with a web interface for viewing status, performance and health of different devices.
- Offers a web-based configuration.
- Dashboards can be customized to meet your preferences.
- Advanced reporting feature helps to create visually stunning reports.
- Powerful script APIs allow the monitoring of remote and local systems and devices,.
- Offers a centralized view of the entire IT monitoring infrastructure.
- Helps with capacity planning.
- Provides scheduled downtime alerts during upgrades.
- Provides multi-user access to web console.
- Event handlers allow automatic restart of failed services or applications.
- Many community-developed add-ons extend the functionality of Nagios Core.
- Open source and gives full access to source code.
Why do we recommend it?
We recommend Nagios Core for its robust and extensible alerting and monitoring capabilities, particularly its ability to monitor various network services and host metrics. The tool’s simple plug-in design also allows for easy customization and extension.
System Requirements
To run Nagios Core, you need the following.
- A system running Linux or Unix. Should have network access and a C compiler.
- A web server, preferably Apache
- Thomas Boutell’s gd library version 1.6.3 or higher
Who is it recommended for?
Nagios Core is ideal for businesses that require a high level of customization and extendability in their monitoring solutions. With its multi-user access and advanced reporting features, it suits larger organizations and IT teams looking to keep a centralized view of their entire IT monitoring infrastructure.
Pros:
- You can download add-ons and plugins for free
- With SNMP protocol, you can monitor multiple devices
- Offers a variety of alert and notification capabilities.
- Helps watch over the entire IT monitoring infrastructure
- Using parent hosts, you can specify the network host hierarchy
Cons:
- It’s challenging to configure most settings
- Doesn’t monitor network throughput
Nagios is open source and hence Free to use.
8. OpenNMS
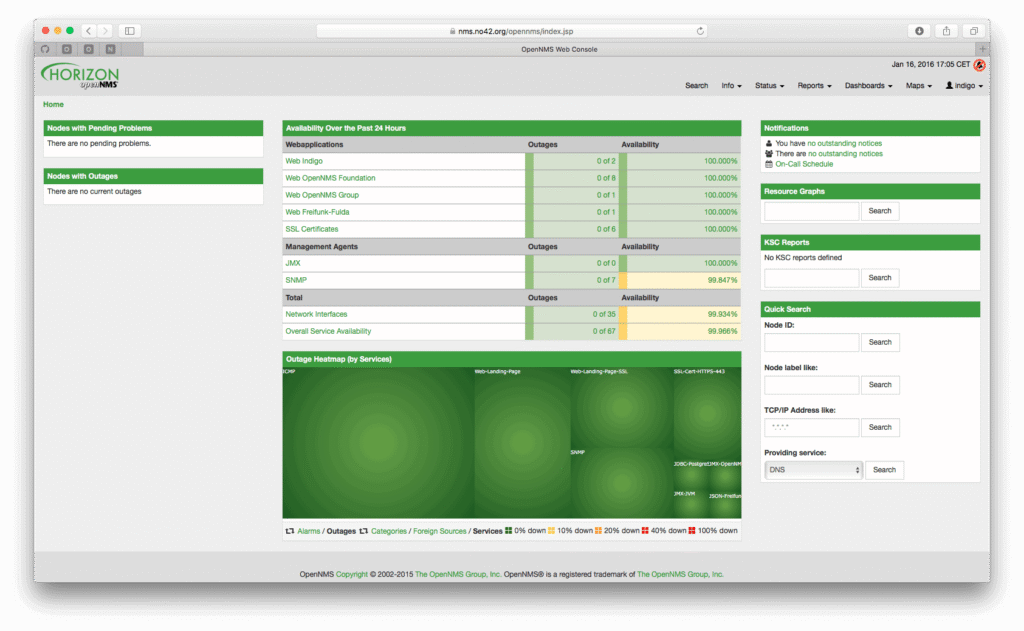
OpenNMS is an open-source network management platform that’s designed for building network monitoring solutions.
Key Features
Here’s a look at the features of OpenNMS.
- It is built on an event-driven architecture.
- Detects service outages right away.
- Measures latency and notifies when it exceeds a threshold limit.
- Provides out-of-the-box support for many services with configurable options.
- Remotely monitors applications and services.
- Collects performance metrics from industry standards such as SNMP, WMI and XMP.
- Gathers performance data from applications using customizable generic collectors such as HTTP and JSON.
- This tool can be extended to any performance data collection framework.
- RestAPI makes it easy to integrate OpenNMS to your existing infrastructure.
- Discovers layer 2 network topologies.
- Comes with an interactive service map to make it easy to drill down to the problem right away.
- Backshift graph visualization helps to tap into the Time Series storage.
- A geographical node map shows nodes and service outages across different geographical areas using Google Maps or Open Street Map.
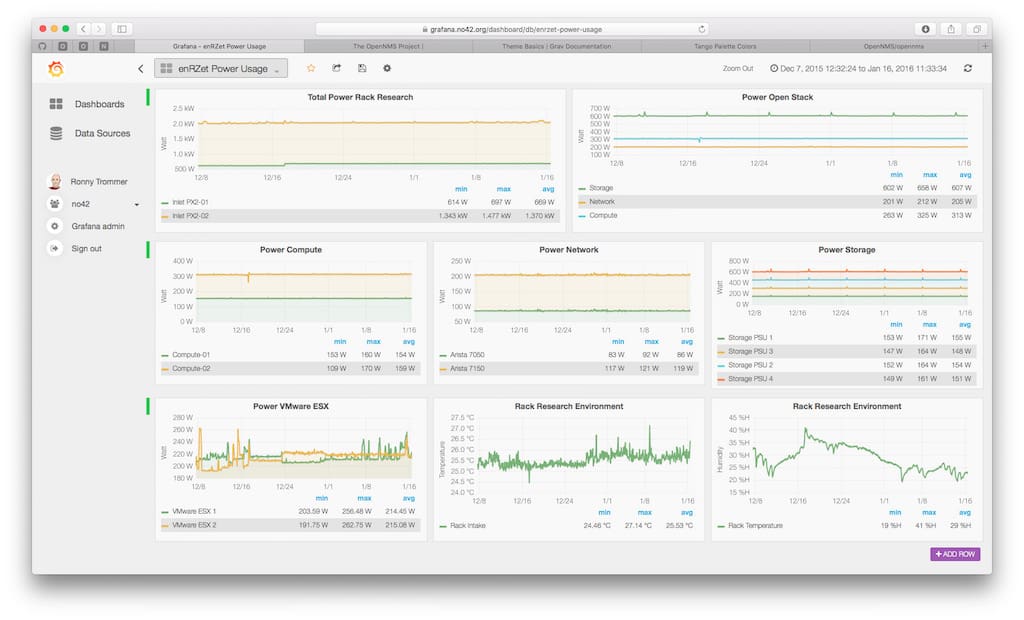
- Performance data visualization based on Grafana enhances the visual appeal of information.
Why do we recommend it?
We recommend OpenNMS for its event-driven architecture and comprehensive feature set that includes immediate service outage detection, latency measurement, and extensive data collection options. Its RestAPI also facilitates easy integration with existing infrastructures.
Who is it recommended for?
OpenNMS is suitable for enterprises looking for an open-source network management solution that is highly extensible and customizable. Companies that require real-time monitoring capabilities and aim to easily integrate the tool into their existing systems would benefit the most from OpenNMS.
Pros:
- Sends instant alert on discovering network issues or outage
- Assists in locating the crucial routes that a failure might affect.
- Uses RestAPI for integration
- Helps identify latency issues that negatively affect their performance.
- Monitors the accessibility of applications and services
Cons:
- Poor MIB Management
- Lacks development resources
OpenNMS comes in two editions – Meridian and Horizon. While Horizon is free, Meridian comes with an annual subscription.
To decide which of the two is right for you, here’s a brief look at the features of both these editions:
Features | Meridian | Horizon |
|---|---|---|
| Who is it for? | Enterprises looking for stable platforms with long-term support | Business that want to monitor new technologies and IT ecosystems. |
| Development model | Open source | Open source |
| License type | AGPL v3 or proprietary license | AGPL v3 |
| Release cycle | Once every 12 months | Once every 3 to 4 months |
| Support | Comes with organizational support, along with access to OpenNMS connect forums. | Community driven mailing lists and wiki. |
| Configured | Preconfigured events and notices, data collection, workflow and reports | Community driven configurations |
| Maintenance | Access to update code for latest bugs and fixes | Community driven |
Horizon can be downloaded from here.
9. Zenoss Core
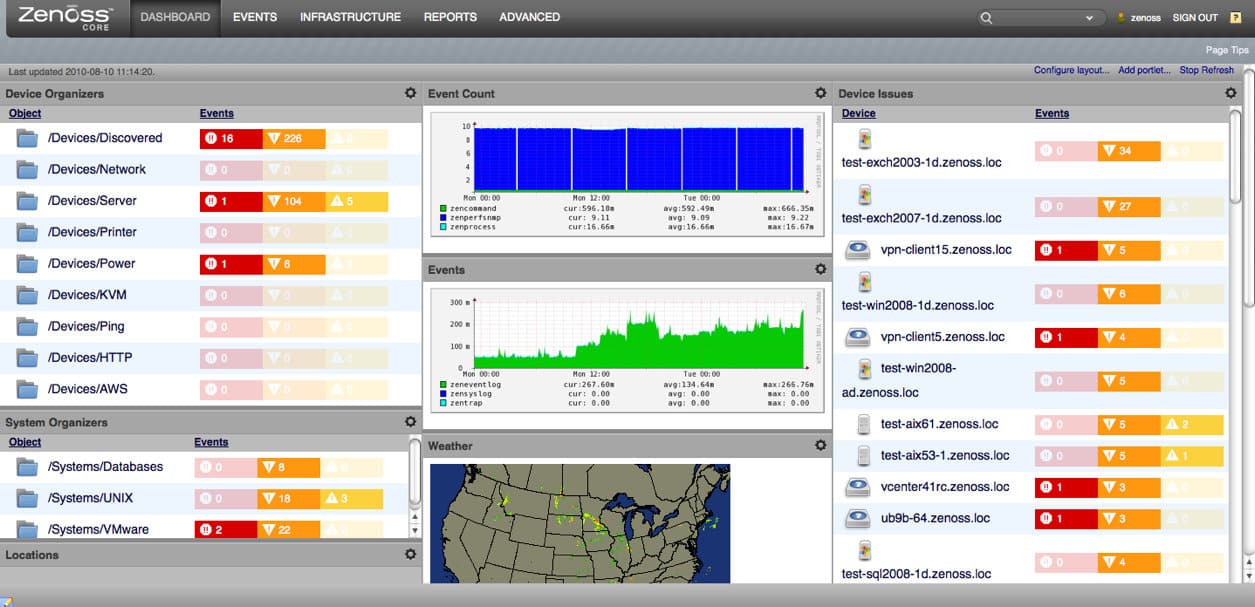
Zenoss is a cloud-based solution for large enterprises that have a large network. At the same time, it also provides basic monitoring for small and medium businesses.
Key Features
Let’s take a look at some of the features available in Zenoss.
- Helps to build the most granular and intelligent relationship infrastructure.
- Proactively provides deep performance insights for any IT environment.
- Shares insights with other ITOM tools
- Reduces mean time to resolution.
- Automates processes and streamlines operations for greater efficiency.
- Supports new business tools.
- Simplifies cloud migrations.
- Eliminates risk associated with digital transformations.
- Identifies issues, isolates it and fixes problems before it becomes a disaster.
- Provides capacity optimization.
- Helps to transition to event-driven results.
- Increases IT visibility.
- Reduces overhead.
- Comes with Smart View, a machine learning-based user interface.
- Provides real-time visibility into the health of on-premises, cloud and serverless environments.
- Streamlines investigation and collaboration to reduce the time taken to resolve issues.
- It can scale and adapt to your evolving needs.
Why do we recommend it?
We recommend Zenoss Core for its capability to provide deep performance insights and its emphasis on proactive issue resolution. The platform’s machine learning-based Smart View interface and real-time visibility further make it a standout solution in ITOM tools.
Who is it recommended for?
Zenoss Core is ideal for large enterprises seeking to automate and streamline their IT operations but is also flexible enough to serve small and medium-sized businesses. If you’re looking for a tool that simplifies cloud migrations, enhances IT visibility, and can adapt to evolving needs, Zenoss Core is a strong choice.
Contact the sales team to get a quote. You can request a demo.
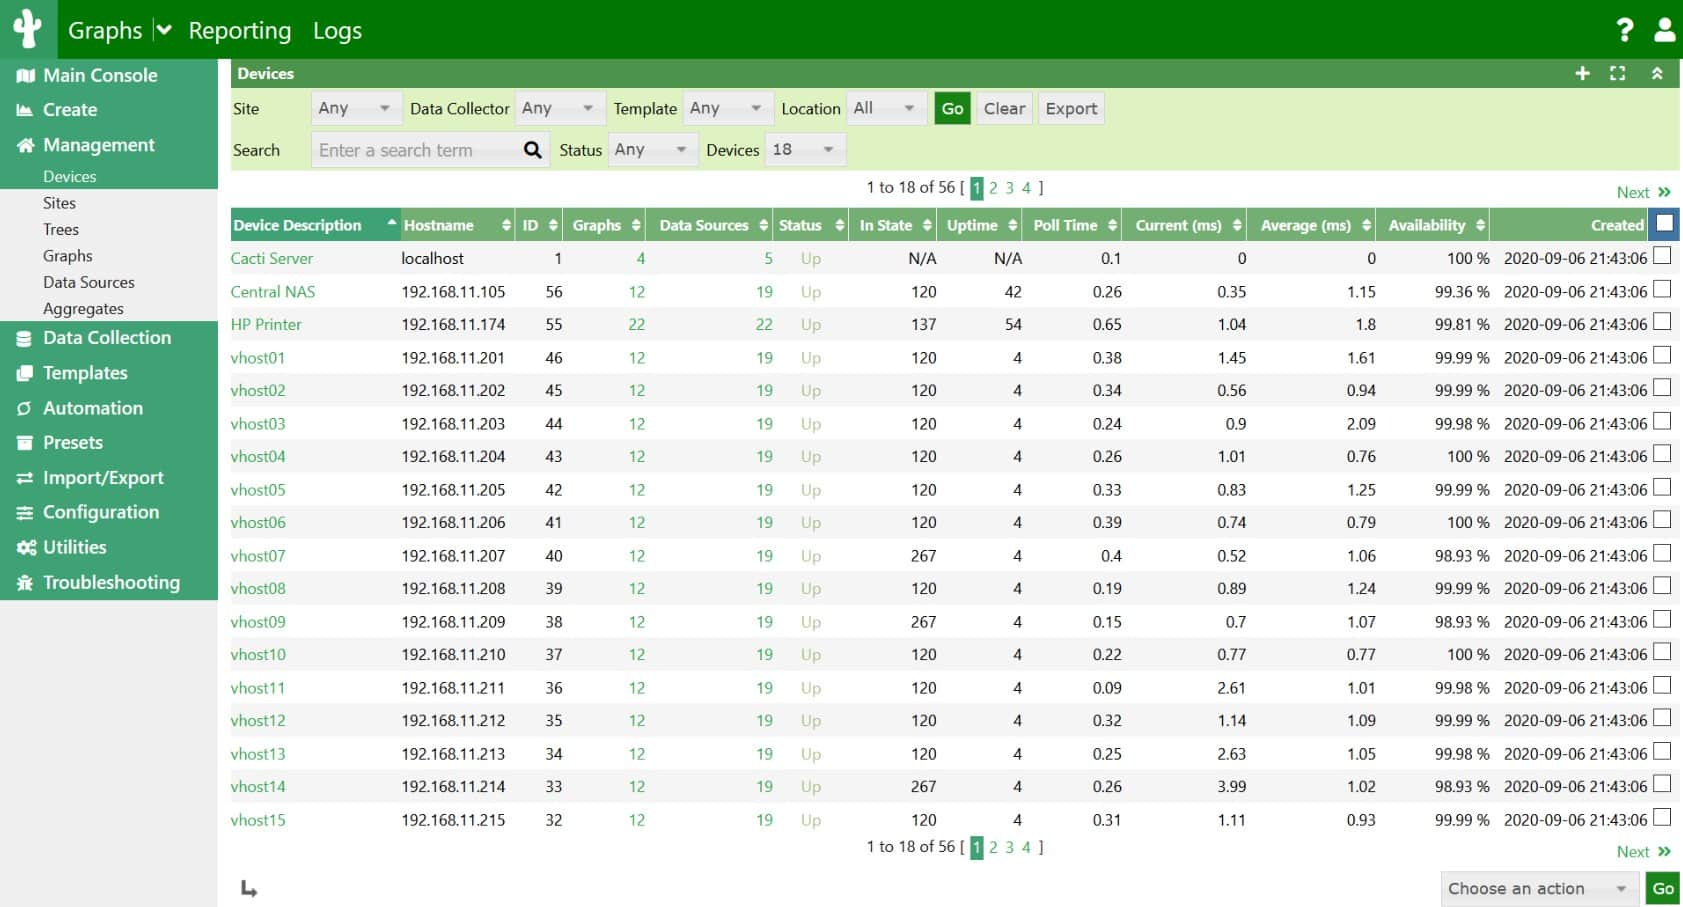
10. Cacti
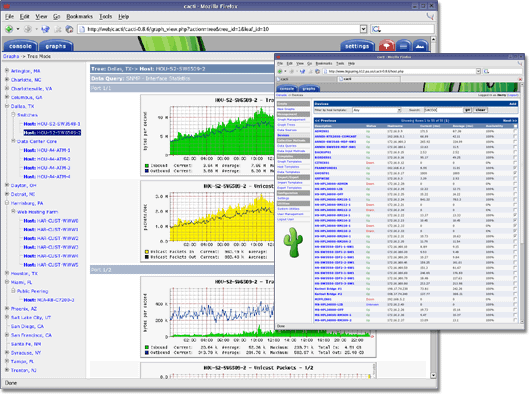
Cacti is a network graphing solution to harness the power of RRDTool’s storage and graph.
Key Features
Cacti comes with the following features.
- Unlimited number of graph items can be defined for each graph.
- Automatically groups graph items for quick re-sequencing when needed.
- Comes with auto-padding support.
- Graph functions can be managed and manipulated with Math functions that are built into RRDtool.
- Supports all RRDTool graph items.
- Each data can be used to collect remote or local data to put it on the graph.
- Round robin archive settings can be changed at any time, so you can change on non-standard time spans too while storing data.
- You can create custom scripts to gather data.
- Built-in SNMP support
- PHP-based poller is used to execute scripts.
- Graph templates make it easy to create all kinds of graphs.
- Tree view allows to create graph hierarchies.
- Administrators can create users and assign different permissions to each of them.
- Permissions can be given per-graph per-user as well.
Why do we recommend it?
We recommend Cacti for its extensive graphing capabilities powered by RRDTool and its flexibility in data collection. The platform’s features like custom scripts, built-in SNMP support, and graph templates offer a versatile monitoring experience.
Who is it recommended for?
Cacti is a strong fit for administrators who need in-depth graphing capabilities to monitor their networks. Its customizable permissions and user roles make it suitable for teams of varying sizes and access needs. If you’re looking for a tool that allows for detailed network graphing and customizable data collection, Cacti is a good choice.
System requirements:
The minimum requirements needed to install Cacti are:
- RRDTool 1.0.49 or anything greater than 1.4
- MySQL 5.x or higher
- PHP 5.1 or higher
- Web server like IIS or Apache that supports PHP.
Cacti is 100% Free.
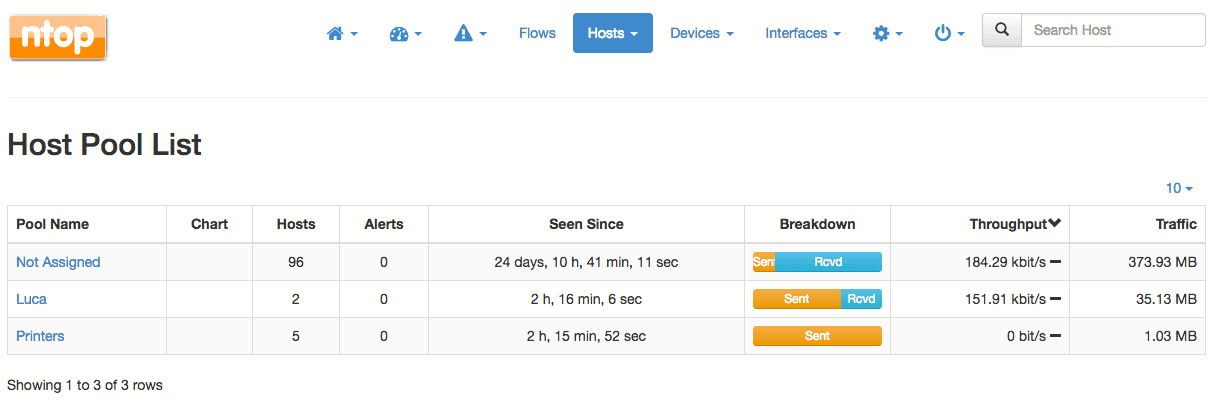
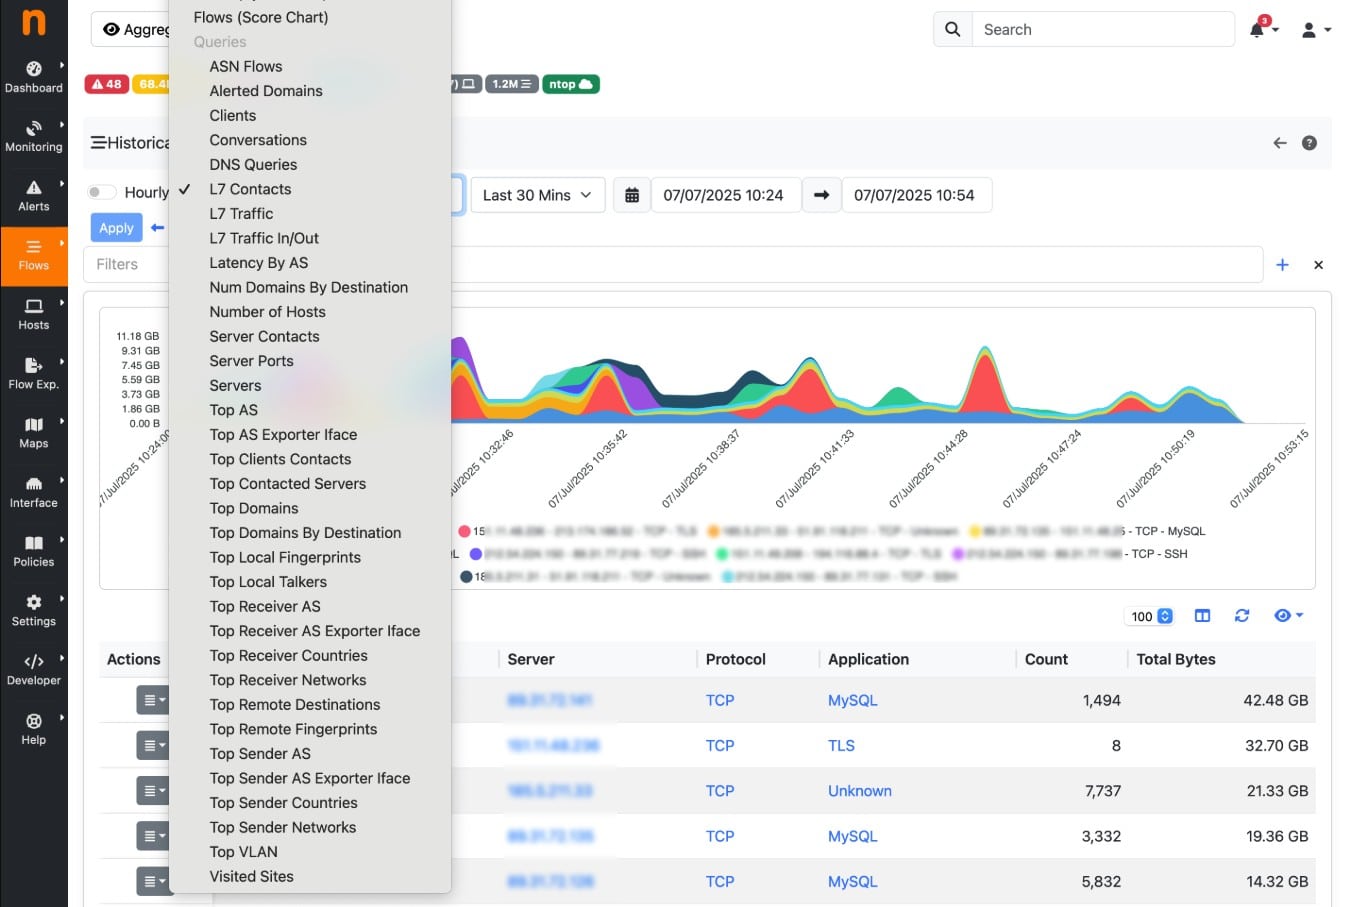
11. ntopng
ntopng is a network traffic probe that monitors network usage. it is the next version of the popular ntop tool. it runs well on Linux, Unix and even in Windows.
Key Features
nTopng has the below-mentioned features.
- Sorts network traffic according to different criteria such as IP address, port, etc.
- Shows network traffic and hosts in real-time.
- Creates long-term reports for many network metrics such as performance, availability and status.
- Makes a list of top talkers, both senders and receivers, top applications and so on.
- Monitors and reports network latency, round trip time, TCP statistics, packets transmitted, bytes and other important information.
- Stores disk persistent traffic statistics
- Gelocates hosts on a map and maps them correctly.
- Discovers application protocols using ntop Deep Packet Inspection technology.
- Analyzes IP traffic and sorts it according to source or destination.
- Produces HTML5 and AJAX network traffic statistics.
- Provides full support for IPv4 and IPv6.
- Supports GTP and GRE tunneling.
- Alerts engine to capture suspicious hosts.
- Helps to create interactive historical exploration of monitored data.
- Characterizes HTTP traffic
Why do we recommend it?
We recommend ntopng for its comprehensive real-time network monitoring capabilities and its deep packet inspection technology. The tool excels in sorting and analyzing network traffic, making it invaluable for understanding network behavior.
Who is it recommended for?
ntopng is suitable for network administrators and security analysts who require real-time insights into network traffic and performance. Its features like long-term reports, traffic statistics, and alerts make it ideal for environments where detailed network monitoring and analysis are critical.
ntopng comes in three versions – Community, Professional and Enterprise. While Community is free, the other two come at a subscription cost. Professional costs 149.95 Euro while Enterprise costs 499.95 Euro. To upgrade from Professional to Enterprise, the cost is 349.95 Euro.
The differences between the three versions are:
| Features | Community | Professional | Enterprise |
|---|---|---|---|
| Monitor the active flows and hosts of your network | Yes | Yes | Yes |
| Identity application protocols (Facebook, Youtube, BitTorrent, etc) in the network | Yes | Yes | Yes |
| Record and Visualize hosts’ historical applications protocols usage | Yes | Yes | Yes |
| Record and Visualize hosts’ historical applications protocols usage | Yes | Yes | Yes |
| Group hosts by VLAN, Operating System, Country, and Autonomous Systems | Yes | Yes | Yes |
| Get a geographic map of your network communications with the rest of the world | Yes | Yes | Yes |
| Identify top talkers (senders and receivers) hosts with minute resolution | Yes | Yes | Yes |
| Visualize the top HTTP sites contacted by an host | Yes | Yes | Yes |
| Export expired flows information to MySQL, possibly augumented with nProbe data | Yes | Yes | Yes |
| Get alerts notifications as Slack messages | Yes | Yes | Yes |
| Generate alerts when hosts cross configurable time/traffic thresholds or have suspicious behaviors | Yes | Yes | Yes |
| Split, merge, and visualize VLAN based traffic | Yes | Yes | Yes |
| Collect data from nProbe to treat remote nProbe-monitored interfaces and flow exporter devices (for example routers and switches) as if they were local | Yes | Yes | Yes |
| Split, merge, and visualize data collected from nProbe | Yes | Yes | Yes |
| Group local hosts into logical sets of IP and MAC addresses known as host pools | Yes | Yes | Yes |
| Get a realtime view of top talkers and application protocols and compare them with daily activities | No | Yes | Yes |
| Explore recorded MySQL data to identify the cause of network problems | No | Yes | Yes |
| Generate graphical reports with top hosts, application protocols, countries, networks, and autonomous systems within any configurable time frame | No | Yes | Yes |
| Mark and historicise traffic with user-defined traffic profiles to match hosts, ports and applications using the BPF syntax | No | Yes | Yes |
| Limit or block your hosts’ traffic with customized per-protocol policies | No | Yes | Yes |
| Integrate ntopng login with LDAP authentication servers | No | Yes | Yes |
| Send ntopng generated alerts to Nagios | No | Yes | Yes |
| Query SNMP devices data, such as port status, traffic and MAC address information | No | No | Yes |
| Advanced MySQL insertions yielding 5x faster database writes | No | No | Yes |
| Optimized MySQL aggregations for faster historical flow data explorations | No | No | Yes |
| Get total traffic and activity reports for any given host, network, or interface | No | No | Yes |
| Identify attackers and victims through an alerts dashboard in realtime and in the past | No | No | Yes |
| Visualize host pools’ historical applications protocols usage | No | No | Yes |
| Explore and filter flow alerts in the past | No | No | Yes |
| Visualize and historicise SNMP per-device-port traffic | No | No | Yes |
| Visualize and historicise NetFlow/sFlow devices data | No | No | Yes |
| Provide an Internet Captive Portal | No | No | Yes |
| Apply per-protocol daily traffic and time quotas to your clients | No | No | Yes |
| Provide accurate parental control with SafeSearch DNS integration | No | No | Yes |
You can download the Community version from here.
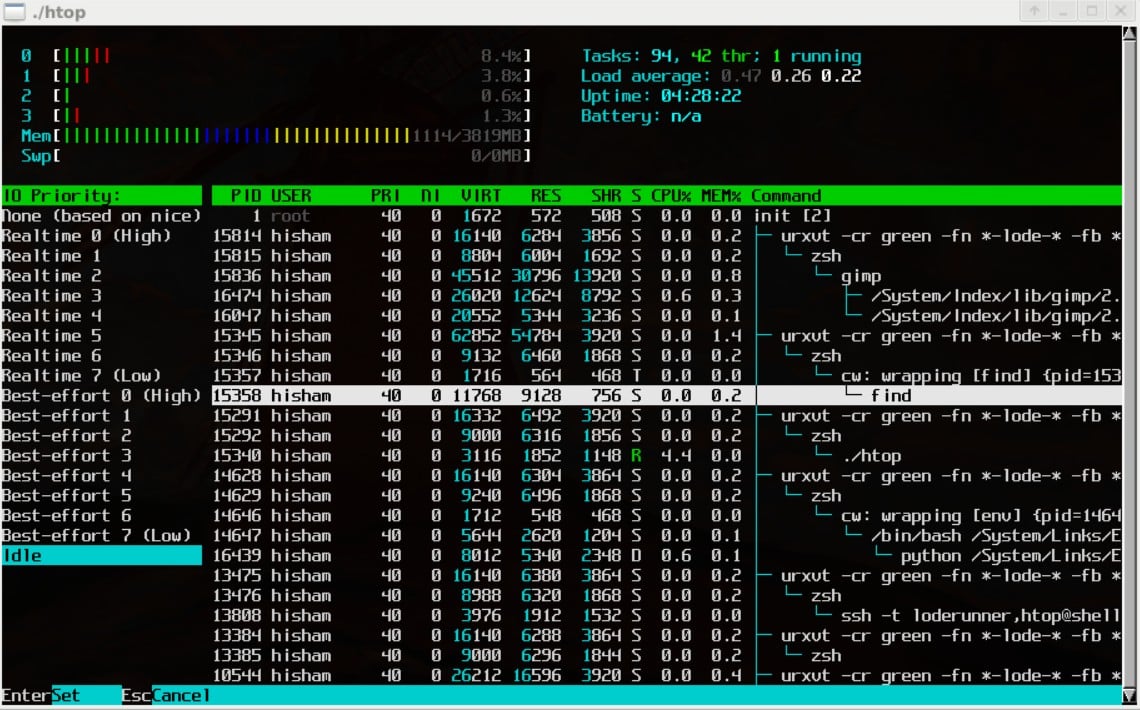
12. htop
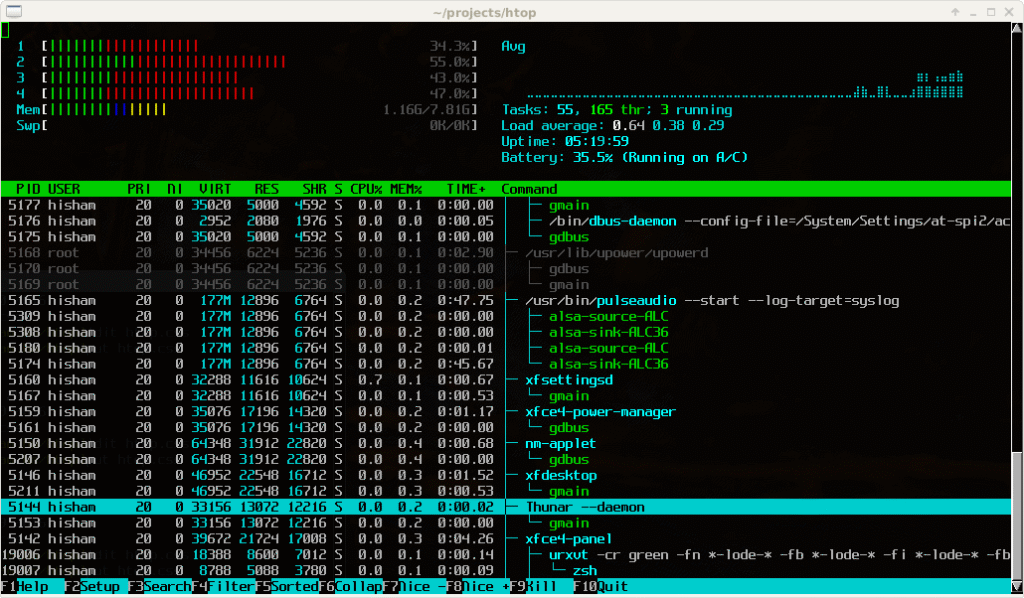
htop is an interactive process viewer for Unix systems. It is designed for consoles and X terminals, so it supports only text-mode. Also, it requires ncurses.
Key Features
The features of htop are:
- htop is cross-platform and supports Linux, FreeBSD, OpenBSD, Dragonfly BSD and macOS.
- Provides information on different metrics such as tasks, load average and uptime.
- Interactive user interface that can be customized to meet your color preferences.
- Provides delay accounting metrics for Linux, Solaris and other operating systems.
- Supports custom scripts
- Supports real-time signals.
Why do we recommend it?
We recommend htop for its interactive user interface and cross-platform compatibility. Its ability to display real-time signals and a multitude of system metrics makes it an excellent tool for real-time process monitoring.
Who is it recommended for?
htop is ideal for system administrators and developers who are comfortable with text-based interfaces and require real-time process monitoring. Its customizability and script support make it particularly useful for those who need to integrate it into larger system management strategies.
htop is Open-source and Free.
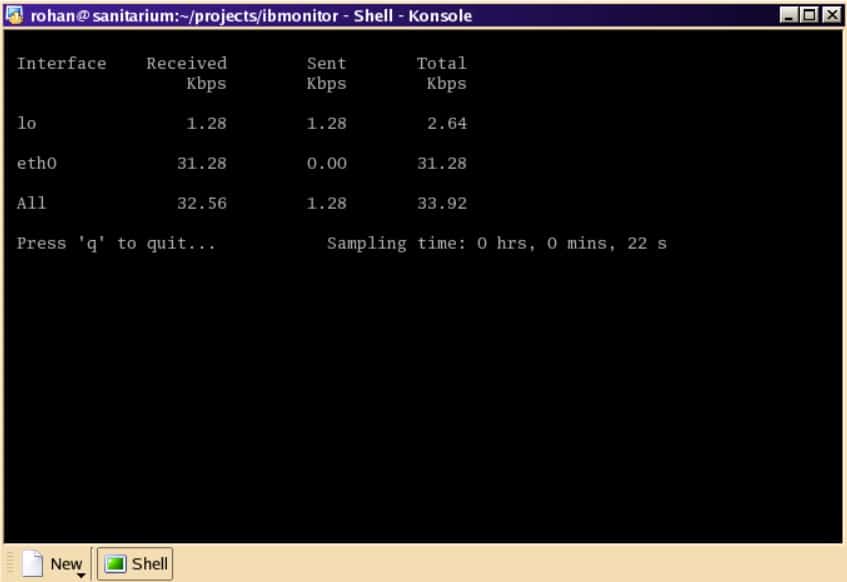
13. Ibmonitor
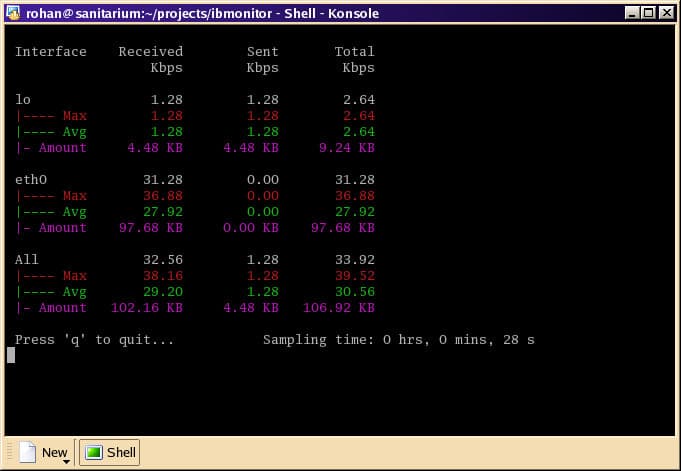
Ibmonitor is an interactive Linux console application that shows the bandwidth consumed and amount of data transferred on all interfaces.
Key Features
The features of Ibmonitor include
- Displays received, transmitted and total bandwidth consumed for each interface.
- Calculates and displays the combined value of all interfaces.
- Displays the total data transferred per interface.
- Values are displayed in kbps or kBps, that is, in bits or byes depending on your preference.
- It can display the maximum bandwidth consumed on each interface since the start of a particular utility.
- The display output including all the features fits well on xterm or any console that is 80 X 24.
- This tool can change the display interactively based on the key input given by the user.
Why do we recommend it?
We recommend Ibmonitor for its detailed and real-time monitoring of bandwidth consumption on all interfaces. Its ability to display data in kbps or kBps and adapt the display interactively adds to its user-friendliness.
Who is it recommended for?
Ibmonitor is recommended for network administrators and anyone who needs to monitor bandwidth usage across multiple interfaces. Its simple console interface makes it accessible, even if you’re not a networking expert.
You can download Ibmonitor from here.
14. Bwm-ng
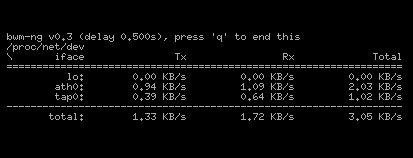
Bwm-ng or Bandwidth Monitor NG is a small console-based tool ideal for network and disk-io bandwidth monitoring for Linux, BSD, MacOS and Solaris.
Key Features
The features of BWM-ng are as follows.
- Licensed under GPL2.
- Supports unlimited number of devices and interfaces.
- You can white or blacklist interfaces and devices.
- Displays output in curses, plain console, CSV or HTML formats.
- Displays many parameters such as errors, average, maximum and total sum.
- The config file can be customized to meet your needs.
- The interfaces and devices can be dynamically added or removed from the list.
- Supports a ton of aspects/technologies/functions such as proc, ne, dev, netstat, getifaddr, IOKit, devstat, libstatgrab, kstat, sysctl and more.
Why do we recommend it?
We recommend Bwm-ng for its comprehensive capabilities in bandwidth monitoring across various operating systems. Its support for unlimited devices and customizable output formats makes it a versatile choice.
Who is it recommended for?
Bwm-ng is ideal for IT professionals and network administrators who require a flexible and highly customizable bandwidth monitoring solution. Its extensive support for various technologies also makes it suitable for those managing complex networks.
Bwm-ng is 100% Free.
15. DStat
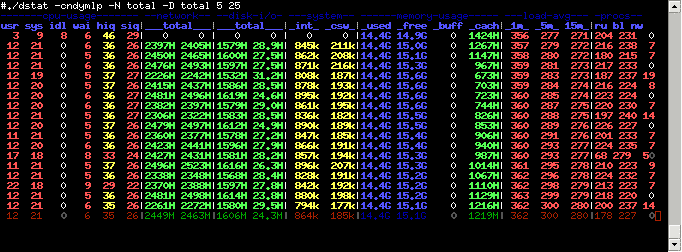
DStat is a versatile resource statistics tool that acts as a replacement for vmstat, iostat, netstat and ifstat.
Key Features
The features of DStat include the following:
- Allows you to view all system resources in real-time.
- Displays detailed selective information in columns for better readability.
- You can easily extend the functionality of this tool to create your own custom counters.
- Data can be exported to CSV files.
- Shows stats in the same timeframe as they occurred.
- Written in python, so it is easy to extend.
- Includes many external plugins as well.
- Displays the number of interrupts per device
- Shows exact units, so the number of conversion mistakes is greatly reduced.
- Displays intermediate results when the delay is greater than one.
Why do we recommend it?
We recommend DStat for its real-time and detailed resource statistics, which seamlessly replace multiple traditional command-line utilities. Its extensibility, thanks to Python, offers a robust solution for custom needs.
Who is it recommended for?
DStat is highly recommended for system administrators and developers who need a comprehensive view of system resources. Its capability to export data to CSV files also makes it suitable for analysts looking to perform further data manipulation.
DStat is 100% Free.
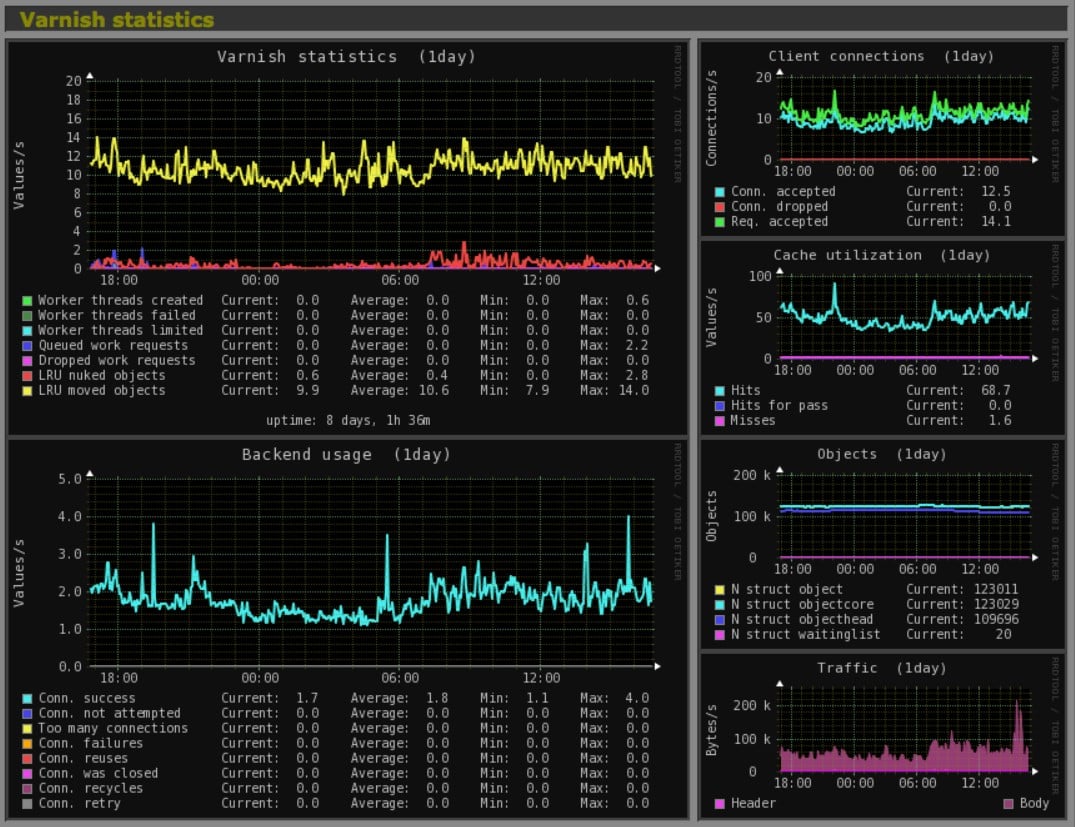
16. Monitorix
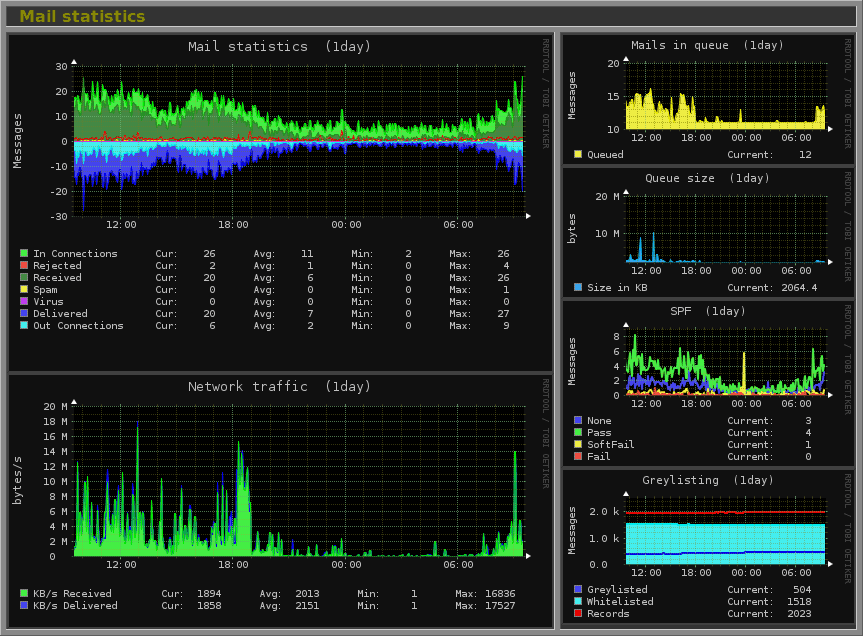
Monitorix is a network monitoring tool designed specifically for Linux environments.
Key Features
Monitorix comes with the below-mentioned features.
- Supports up to 20 hardware temperature sensors.
- Comes with selectable ID sensors for each graph
- Gives you the option to define the number of graphs per row.
- You can disable partially or completely all the legend data.
- Monitors system load average and usage.
- Supports unlimited number of cores
- Gives the option to change alert capabilities for each sensor.
- Supports HP command line utilities.
- You can define up to nine directories per group or graph.
- Includes statistics for both IPv4 and IPv6 connections.
- Provides statistics for CPU time, memory, disk and network usage.
- Supports MTAs such as Sendmail and Postfix.
- Gives mail statistics that includes number of emails in queue, total size of emails in queue, network traffic usage and connections.
- Supports SSH, Login, Telnet, Samba and Netatalk.
- Provides MySQL statistics such as query types per second, number of opened tables, slow queries, connections and more.
- Supports MongoDB too such as connections per second, requests and asserts.
- Gives BIND server statistics.
- Supports complete emailing mechanism for all graphs.
- Web interface is simple and clean.
- Works in GNU/Linux, FreeBSD, OpenBSD and NetBSD
- All traffic-related statistics are stored in fixed-size databases.
- You can zoom into any graph to see its detail.
- Displays temperatures in Celsius or Fahrenheit.
- There is no limit on the number of historical years you can configure.
- Generates reports in both PNG and SVG formats.
- Displays network metrics in MBytes per second or Mbits per second.
- Configuration is simple and can be done with a single text file.
- Silent mode helps to retrieve data from graphs.
- Based on the lightweight Perl language.
- Basic access authentication is supported for HTTP servers like Apache and Nginx
- Host address can be configured for bind and network port.
- Supports reports in different languages such as Catalan, German, English, French, Italian, Polish and Simplified Chinese.
- Can send individual traffic monthly reports
- Allows to create groups of remote servers
- Hides the real URL of each remote server
- Gives Verlihub statistics such as connected users, total hub upload and total hub share.
- Supports Wowza Media Server and can take up to eight connections per server.
- Sends statistics for APC UPS and network UPS tools.
- Provides file cache information statistics.
- Easy to install and simple to use.
- Supports up to eight file systems per graph.
- Gives information about disk I/O activity and disk sectors for each file system.
Why do we recommend it?
We recommend Monitorix for its extensive feature set designed specifically for Linux environments. From hardware temperature sensors to database and mail statistics, it offers a comprehensive monitoring solution.
Who is it recommended for?
Monitorix is ideal for system administrators and IT managers who oversee complex Linux environments. Its support for a variety of protocols and databases also makes it suitable for DevOps teams managing heterogeneous infrastructures.
Monitorix is Free to use.
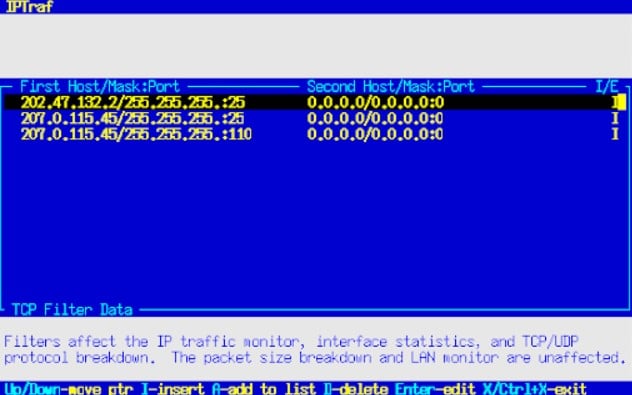
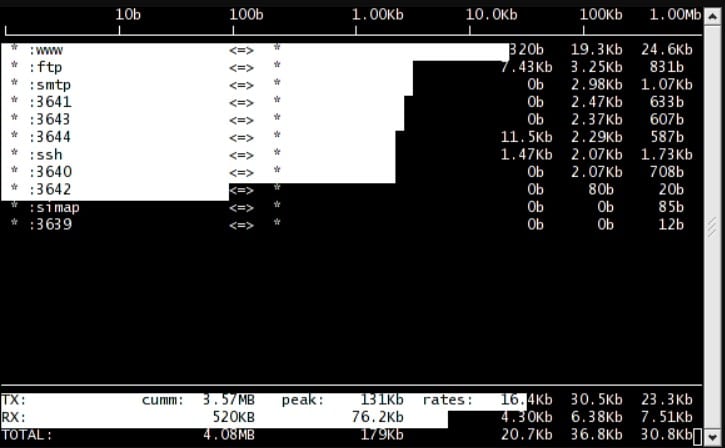
17. IPTraf
IPTraf is console-based network statistics utility designed specifically for Linux systems.
Key Features
IPTraf comes with the features detailed below.
- Gathers information on many aspects such as TCP connection packets, byte counts, interface statistics, activity indicators, TCP/UDP traffic breakdowns, byte counts and LAN station packets.
- Shows information about the IP traffic passing through your network. Includes a multitude of details such as TCP flag information, ICMP details, OSPF packet types and more.
- A TCP and UDP service monitor displays the number of incoming and outgoing packets for common application ports.
- Comes with a LAN statistics module that discovers active hosts and displays activities for each of these hosts.
- Supports Ethernet, ISDN, SLIP, PPP and other interface types.
- This tool is a full-screen one and has menus for easy operations.
- Comes with extensive logging capabilities, so the data can be analyzed later.
- Allows you to filter traffic so you see only what you want. To this end, it comes with TCP, UDP and other display protocol filters.
- Many features help to track the activity of various IP hosts.
- Provides appropriate Ethernet addresses for Non-IP packets.
- The information generated by this tool helps with decision-making and troubleshooting problems in LANs.
- Can be included in Linux distributions, especially Debian, S.u.S.E, TurboLinux, Red Hat, Connectiva and Trinux.
- Requires gzip and tar utility for installation.
- Recognizes the following protocols:
- IP
- TCP
- UDP
- ICMP
- IGMP
- IGP
- IGRP
- OSPF
- ARP
- RARP
Why do we recommend it?
We recommend IPTraf for its detailed network statistics and versatility, tailored for Linux systems. Its extensive logging capabilities and the option to filter traffic make it a powerful tool for real-time analysis and troubleshooting.
Who is it recommended for?
IPTraf is recommended for network administrators and professionals who need a deep, real-time insight into their Linux-based networks. It’s particularly useful for those who need to troubleshoot network issues or optimize performance on Linux distributions.
IPTraf 100% Free.
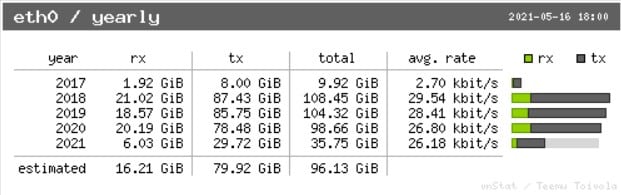
18. vnStat
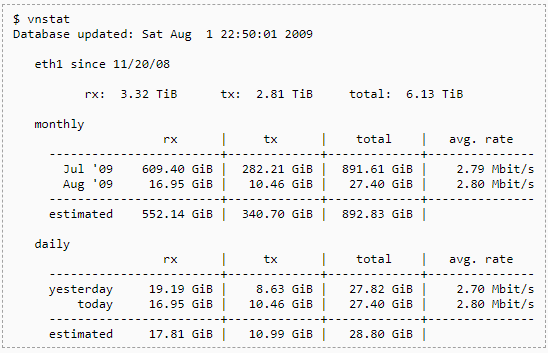
vnStat is a console-based network monitoring tool that is ideal for Linux and BSD operating systems.
Key Features:
vnStat has the following features.
- Well-known for its light use of system resources.
- Keeps a log of network traffic for selected interfaces.
- Takes its information provided by the kernel.
- Can be installed as a root or as a single user.
- Doesn’t do traffic sniffing.
- Quick and simple to install and use.
- Has the capability to monitor multiple interfaces at the same time.
- Provides many output choices such as summary, hourly, daily, monthly, weekly and top ten days.
- You can even choose to have an optional PNG image as output.
- The output can be configured to match your billing cycle.
- Does not require root permissions for use.
- Comes with an online color configuration editor
Why do we recommend it?
vnStat is a lightweight and resource-efficient network monitoring tool that provides detailed traffic statistics without the need for traffic sniffing. It’s simple to install and use, making it an excellent choice for tracking network usage on Linux and BSD systems.
Who is it recommended for?
vnStat is recommended for system administrators and users who want an easy-to-use network monitoring tool for Linux and BSD systems. It’s particularly useful for those who need to keep track of network usage on multiple interfaces without significant resource overhead.
vnStat is open source and Free.
19. iftop
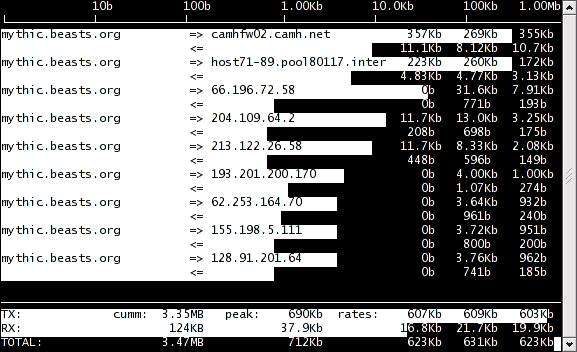
iftop is a tool that displays bandwidth usage on an interface.
Key Features
The features of iftop are listed below.
- Listens to all traffic that passes through your network.
- Displays a table of current bandwidth usage by pairs of hosts.
- Gives insights into the slow speed of your network.
- Simple interface that displays information in an uncluttered format.
- Displays host names (even hidden ones), source port and more.
Why do we recommend it?
iftop is a straightforward yet effective tool for monitoring network bandwidth usage. It provides real-time insights into the traffic passing through your network, making it easy to identify bandwidth hogs and diagnose network performance issues.
Who is it recommended for?
iftop is recommended for network administrators and anyone who needs to quickly assess bandwidth usage on a specific network interface. Its simplicity and real-time data make it a valuable tool for troubleshooting network congestion and identifying high-traffic sources.
iftop is 100% Free.
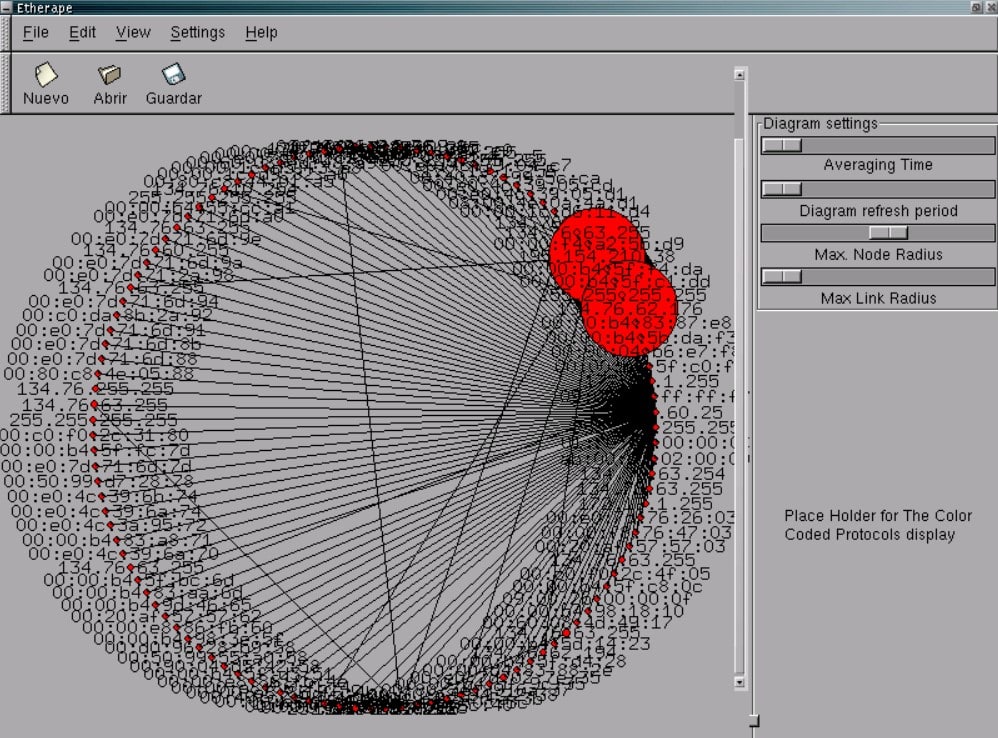
20. EtherApe
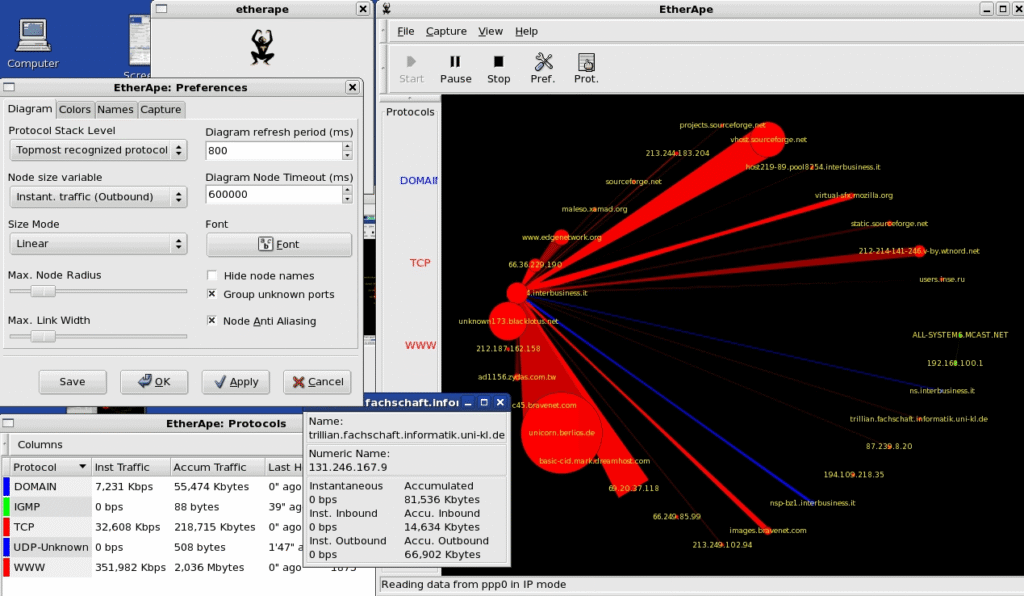
EtherAge is a graphical network monitor designed for Linux and Unix systems. It is modeled after Etherman.
Key Features
The following aspects are available in EtherAge.
- Supports link layer, IP and TCP modes.
- Displays network activity in a graphical manner. In general, the more noisy a network is, the greater is its representation.
- Provides color coded display of protocols. Node and link color shows the most used protocols.
- Supports Ethernet, FDDI, Token Ring, ISDN, PPP, SLIP and WLAN devices.
- Filters traffic, so you see only what you want.
- Has the ability to read packets from a file as well as live from a network.
- You can choose the level of protocol stack for better focus.
- Ability to peek into your network traffic. End to end IP and port to port TCP are supported.
- Data can be captured from a tcpdump capture file as well.
- Captures live data from Ethernet, FDDI, SLIP, PPP, WLAN and other encapsulated formats.
- Supports a ton of frame and packet types such as TELNET, FTP, HTTP, NETBIOS, SNMP, TRAIN, LOOP, ICMP, IGMP, UDP, IDP, PP,RSVP, GRE, EON, VINES and more.
- You can refine the network data using different filters.
- Node statistics can be exported to XML file at any time.
- Alternative display mode arranges nodes in columns.
- Compatible with Scrollkeeper and rarian.
- A node summary dialog display show traffic statistics according to each node.
- Average and node persistence times are easily configurable.
- Protocol summary shows global traffic statistics based on each protocol.
- Does name resolution using standard libc functions and in the process supports DNS, host file, etc
- Open source and is released under General Public License (GNU).
Why do we recommend it?
EtherApe is a visually intuitive network monitoring tool that offers a graphical representation of network activity. Its color-coded display makes it easy to identify which protocols are being used most frequently on your network, aiding in troubleshooting and optimizing network performance.
Who is it recommended for?
EtherApe is recommended for network administrators and users who prefer a visual representation of network traffic. It’s particularly useful for quickly identifying the most active protocols and nodes on a network.
System requirements
You need the following to install and run EtherApe.
- libpcap packet capture library
- GTK+ and GTK Builder
- Standard resolver library
EtherAge is 100% Free.
21. RRDtool
RRDtool is an industry standard data logging and graphing tool for time series data.
Key Features
The below-mentioned features are found in RRDtool.
- Can be easily integrated in shell scripts, perl, python, ruby, lua and tcl applications. Scripts act as a wrapper for accessing the data stored in RRDtool databases.
- Works well on different Linux and Unix platforms as well as on Windows.
- Create web pages containing RRD graphs based on templates.
- Option to convert the contents to an XML file.
- Stores data, and this makes it a back-end tool as well. At the same time, you can create graphs as well and this doubles rrdtool as a front-end interface too.
- New data gets appended at the bottom of the table.
- Associated time stamp of each data is stored, thereby making it a time series data tool. Time is always expressed as the number of seconds elapsed since 01-01-1970.
- Comes with a command set to carry out different operations on RRD databases.
- Databases are simple in structure.
Why do we recommend it?
RRDtool is an industry-standard tool for data logging and graphing of time series data. It is highly versatile and can be integrated into various scripting languages, making it a powerful choice for creating custom monitoring and reporting solutions.
Who is it recommended for?
RRDtool is recommended for system administrators and developers who need to collect, store, and visualize time series data. It’s particularly useful for creating custom monitoring dashboards and reports for various applications and systems.
RRDtool is 100% Free.
Conclusion
WOOHOO – That was a Massive list of Tools to get you started – There are FREE Versions and Paid Versions of almost Every tool, including many of them that give you a 30 Day Trial that will allow you to get them installed and configured in your network fairly quickly and get monitoring within a couple hours.
We hope these monitoring tools help you to monitor your Linux environment. If we forgot any tools or missed some by chance, please feel free to send us an email and we’ll happily add them to the bottom of this list of Linux Monitoring Tools & Software!
