
Finding the Best Network Monitoring Tools and Software suites for managing, monitoring and keeping an eye on your Network Infrastructure is one of the most important IT decisions you will make, whether your a small, medium or large business with multiple satellite locations.
Here is our list of the best network monitoring tools:
- Auvik – EDITOR’S CHOICE This cloud-based platform offers a network monitoring service that discovers and documents all devices on your network and then implements continuous monitoring of their statuses and traffic throughput. Get a 14-day free trial.
- Paessler PRTG – FREE TRIAL A collection of network, server, and application monitors that includes both device monitoring and traffic tracking. Runs on Windows Server. Download the 30-day free trial.
- Progress WhatsUp Gold – FREE TRIAL An SNMP-based network device monitor with autodiscovery and automated network topology mapping. Runs on Windows Server. Get a 30-day free trial.
- SuperOps – FREE TRIAL A unified network monitoring tool that allows you to manage endpoints and network devices through a single pane. Start a 14-day free trial.
- AdRem NetCrunch – FREE TRIAL An agentless monitoring platform that supports a wide range of devices, services, and events in your network. It automatically collects and analyzes data to provide meaningful insights. Start a 30-day free trial.
- Site24x7 Network Monitor – FREE TRIAL A tool provides both network device monitoring with SNMP procedures and NetFlow-based traffic monitoring. This is a cloud-based system. Start a 30-day free trial.
- Atera – FREE TRIAL A SaaS platform of tools for managed service providers that includes a remote monitoring system for networks, servers, and applications. Access a 30-day free trial.
- ManageEngine OpManager – FREE TRIAL This package of network device and endpoint monitoring systems relies on SNMP for device discovery and constant health checks. Runs on Windows Server, Linux, AWS, and Azure. Get a 30-day free trial.
- ITRS OP5 Monitor A monitoring system that watches all IT infrastructure and includes business operations issues, such as SLAs. Runs on Linux, on Windows over a hypervisor, or on major cloud platforms.
- Obkio A network monitoring tool that continuously scans your networks and their devices to identify issues and alert your administrators.
- SolarWinds Network Performance Monitor An SNMP-based network monitoring system that includes automated device discovery and a constantly updated network inventory and topology map. Runs on Windows Server.
- Fortra’s Intermapper An autodiscovery and network mapping tool that offers a wide range of layout templates. Installs on Windows, macOS, and Linux.
- Nagios XI An infrastructure monitoring tool that features network monitoring and can be extended by free plugins. Runs on Linux.
The need for an all encompassing NMS has never more apparent then it is now when technology has taken over every aspect of business, including crucial business applications and hardware (VOIP PBX Systems and in-house Email).
We’ve put together a list of the Top and Most highly Rated Network Management and Monitoring Tools and software applications that will assist you in having a close eye on your network and infrastructure.
These software solutions listed below will assist you in monitoring and managing the following aspects of your network, including but not limited to Network Monitoring, Bandwidth monitoring of networked devices, bandwidth usage, network congestion, high-bandwidth users in your network and many others.
Methodology for selecting the Best Network Monitoring Tools
Network monitoring tools are essential for any organization to ensure the smooth functioning of its IT infrastructure. Here, we will provide an overview of the methodology for selecting the best network monitoring tools.
- Does it offer an autodiscovery feature?
- Can it use SNMP to gather current network device statuses?
- Check if it can monitor network performance over time
- Can it interpret data in a graphical form?
The Top Network Monitoring Software
1. Auvik – FREE TRIAL

Auvik is a cloud platform that provides network device monitoring and traffic analysis. This tool includes an autodiscovery process. It assembles a network inventory from its discoveries and also draws up a network map. This discovery process is continuous, so any changes that you make to the network will immediately be reflected in the inventory and map.
Key Features:
- Autodiscovery
- Hardware inventory
- Network mapping
- Network configuration management
- SNMP device status monitoring
Why do we recommend it?
Auvik is a very easy-to-use network monitoring package. It includes both device monitoring and traffic volume tracking. These services are automated, so you don’t need to have a network specialist watching the console constantly in order to catch problems. The system will send out an alert if there is a performance drop, a broken device, or a traffic anomaly, such as dropped packets.
The system constantly checks on the statuses of your network devices. This is possible due to the Simple Network Management Protocol (SNMP). Every network device is shipped with an SNMP agent already installed on it. Auvik downloads a data collector onto a server on your site and this unit broadcasts report requests, which are responded to by those agents.
The collector uploads SNMP responses to the Auvik cloud platform where they are interpreted into graphs and data tables. An SNMP agent will send out a warning if it encounters a problem with a component of its device. These notifications are interpreted into alerts that appear in the Auvik console.
The Auvik system also provides network traffic analysis. This checks on the full capacity of each link and collects throughput data to identify actual traffic volumes minute by minute. If the throughput on a link approaches full capacity, the system will raise an alert. This gives your technicians time to make adjustments to the network layout to prevent devices getting overloaded.
The traffic analysis system is also able to store traffic data, which enables technicians to see what happened on the network when they were out of the office. Thus, network managers can see the peaks and troughs in traffic over time and plan capacity better or implement traffic shaping measures.
This system is able to extract traffic data using the NetFlow, sFlow, J-Flow, and IPFIX flow protocols. This means that it can communicate with switches and routers that are provided by different manufacturers – not all suppliers load their devices with the same protocol.
Who is it recommended for?
This package is suitable for any business but its charging structure will appeal particularly to multi-site and large companies. The company doesn’t charge per endpoint, per user, or even per site. That makes this cloud package particularly favorable to the bigger end of the market.
Pros:
- Network traffic tracking with IPFIX, NetFlow, sFlow, and J-Flow
- Alerts for automated network monitoring
- Historical analysis opportunities
- Tracks external connections and plots them on a real-world map
- Identifies changes in network layout
Cons:
- No on-premises version
You can assess Auvik by accessing a 14-day free trial.
EDITOR'S CHOICE
Auvik is our top pick for a network monitoring tool because it provides both device status monitoring and traffic analysis – many monitoring tool creators split those functions into two separate packages. You get network discovery and automated documentation with this tool. That process cycles continuously, so any changes you make to the network will instantly be reflected in an updated hardware inventory and network map. That network scan is also a useful security feature because it will reveal rogue devices that have connected to the network without approval. The package looks out for performance issues and alerts your technician team, so you don’t need to sit a support operative watching the monitoring console constantly in order to catch issues.
Download: Access a 14-day FREE Trial
Official Site: https://www.auvik.com/features/#trial
OS: Cloud-based
2. Paessler PRTG – FREE TRIAL
Paessler PRTG is a collection of system monitors that cover networks, servers, and applications. Each customer receives the full package of monitors and customizes the tool by deciding which services to turn on. The price for the package depends on how many of those monitors, which are called “sensors,” you want to use.
Key Features:
- Flexible, customizable bundle
- SNMP-based monitoring
- Autodiscovery and inventory creation
Why do we recommend it?
With its SNMP-based monitoring and real-time network topology mapping, users can always be assured of an up-to-date view of their network’s health. Coupled with its automated alert system and diverse set of over 300 sensors, PRTG provides unparalleled visibility and insights, ensuring that potential issues are promptly identified and addressed.
PRTG is a pure monitoring service, which means that it doesn’t include any system management functions. It is an excellent monitoring system for networks, thanks to the core SNMP processes that underpin it. The initial call to all device agents brings back a batch of responses that identify all of the network devices connected to the system. PRTG collates a network inventory from this information and, as it continues its regular polling of devices, keeps that register of devices constantly updated.
The service creates instantly-drawn network topology maps from its network inventory. These maps are not drawn once and then stored but are generated every time you access the topology screen. That means that you never get a topology map that is out of date.
The SNMP network sensor in PRTG receives Trap messages that are sent out by device agents whenever they detect serious problems with the equipment that they monitor. These Trap messages get interpreted by PRTG into alerts on the screen of the system dashboard. The service will also forward these alerts to you by email or SMS. This means that you can get on with other tasks and assume that everything is working well with the network unless you receive a notification.
The Paessler PRTG system is available for a 30-day free trial that includes an unlimited number of sensors. So, you can try out all of the server and application monitoring tools as well as the network monitoring system for free for a month. The PRTG software installs on Windows Server.
Who is it recommended for?
Paessler PRTG is perfect for businesses of all sizes, from small to enterprise-level. Given its flexible bundle, it’s suitable for organizations with diverse monitoring needs, be it server, application, or network monitoring.
Pros:
- Performs thorough analysis and notifies of resource requirements.
- Using the 300+ sensors, users can keep an eye on all servers, applications, and networks.
- Paessler PRTG generates network maps in real-time.
- SNMP, packet sniffer, and WMI make it simple for businesses of all sizes to keep track of connected networks.
- Generates insightful reports and sends threshold-based alerts to administrators.
Cons:
- Understanding the advanced features can be challenging for new users
3. Progress WhatsUp Gold – FREE TRIAL
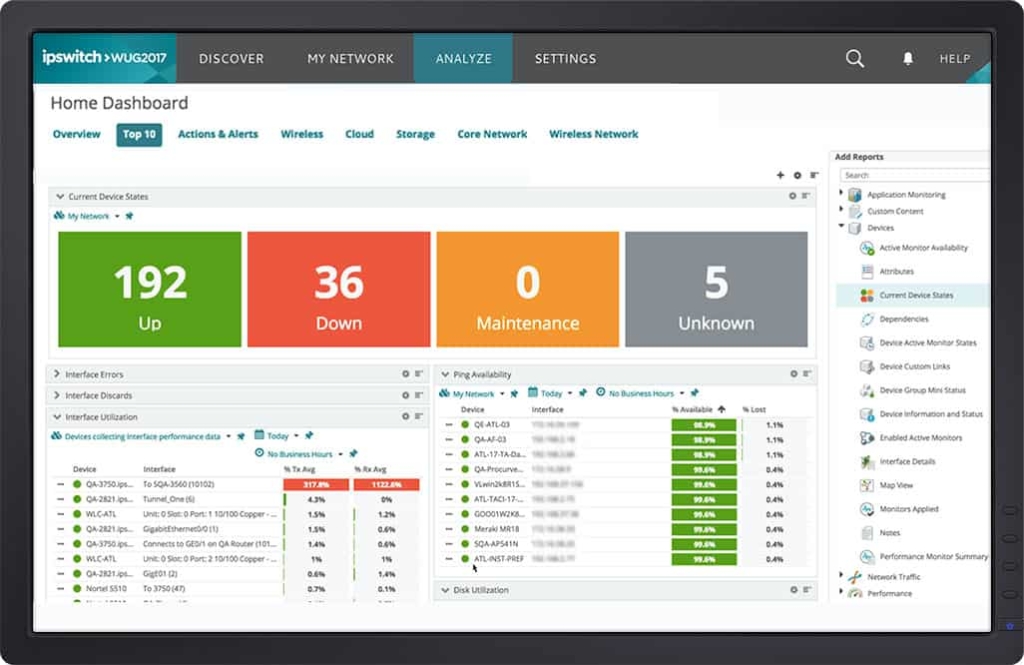
Progress WhatsUp Gold is an SNMP-based network performance monitor that includes an autodiscovery function and a live network topology map. The network map shows the current statuses of the network’s devices and statistics on performance and throughput at each node. Clicking on the representation of a device takes you through to a details screen that lists all of the current performance metrics gathered about it.
Key Features:
- Based on SNMP
- Autodiscovery
- Alerts for network problems
Why do we recommend it?
Progress WhatsUp Gold’s intuitive interface provides real-time insights into your network’s current status, making it easier to identify and address issues promptly. The tool’s versatility extends beyond network performance monitoring, offering additional modules for bandwidth, server, and application monitoring.
The WhatsUp Gold tool includes an alerting system that is based on SNMP Traps. Alerts can also be triggered by performance thresholds, which are set automatically, although you can adjust these to account for any variation in performance level expectations due to SLAs.
WhatsUp Gold can be expanded to provide more than the network performance monitoring service. Other monitor activities that are provided by the add-on modules include a network bandwidth monitor plus server and application monitoring services.
Who is it recommended for?
WhatsUp Gold is recommended for businesses and organizations seeking a comprehensive network performance monitoring solution. Its scalability and customizable alerting system make it suitable for both small and large networks. The tool’s user-friendly interface ensures that IT professionals at all levels can effectively manage and optimize network performance.
Pros:
- Displays the current status of network devices
- It has an exceptionally sleek and intuitive interface
- Creates a logical web representation of connected devices
- With this tool, users can easily discover devices
- Setting up alerts is simple and easy
Cons:
- The bandwidth usage is not properly represented graphically.
- Logging and reporting require improvement
The software for WhatsUp Gold installs on Windows Server. Progress Software Corporation offers a 30-day free trial of the WhatsUp Gold system.
4. SuperOps – FREE TRIAL
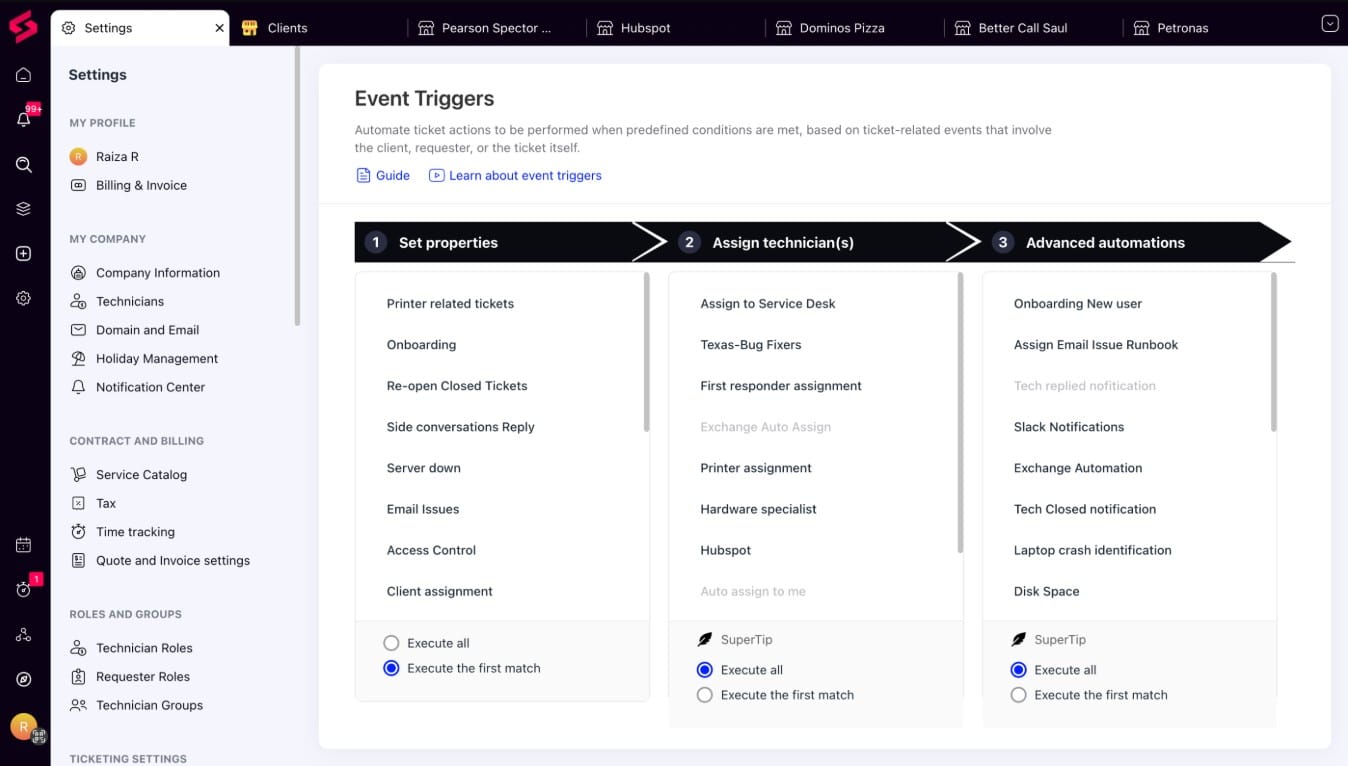
SuperOps is a unified platform that monitors the health and performance of every device and endpoint to keep your network working optimally. At the same time, it is easy to use and offers complete visibility.
Key Features:
- Custom alert policies.
- Support for multiple protocols.
- One-click asset onboarding.
Why do we recommend it?
SuperOps eases the process of network monitoring by gathering data from multiple endpoints and devices and analyzing it for network problems. Such a centralized monitoring feature provides complete visibility and control through a single pane, eliminating the need for multiple tools.
Moreover, SuperOps is easy to use. With just a single click, you can run ICMP scans to identify assets in your network and onboard them. Using this tool, you can monitor devices from 250+ vendors using a wide range of protocols, like ICMP, SNMP, and SSH.
Also, you can create custom alert policies through this tool. When any of the trigger conditions are met, SuperOps sends alerts, so you can proactively fix issues before they create a wide impact on your organization.
Who is it recommended for?
It is ideal for businesses of all sizes. Given its proactive approach to network monitoring, it can also work well for organizations in regulated industries.
Pros:
- Discovers and onboards assets with just a single click.
- Proactively monitors your network for problems.
- Supports thousands of devices from 250+ vendors.
- Uses a wide range of protocols to gather information from devices.
Cons:
- Limited retention of historic data.
SuperOps offers four plans.
- Standard – PSA only – $79.
- Standard – RMM only – $99.
- Pro – Unified Basic – $129.
- Super – Unified Advanced – $159.
All prices are per technician per month, billed annually. Start a 14-day free trial.
5. AdRem NetCrunch – FREE TRIAL
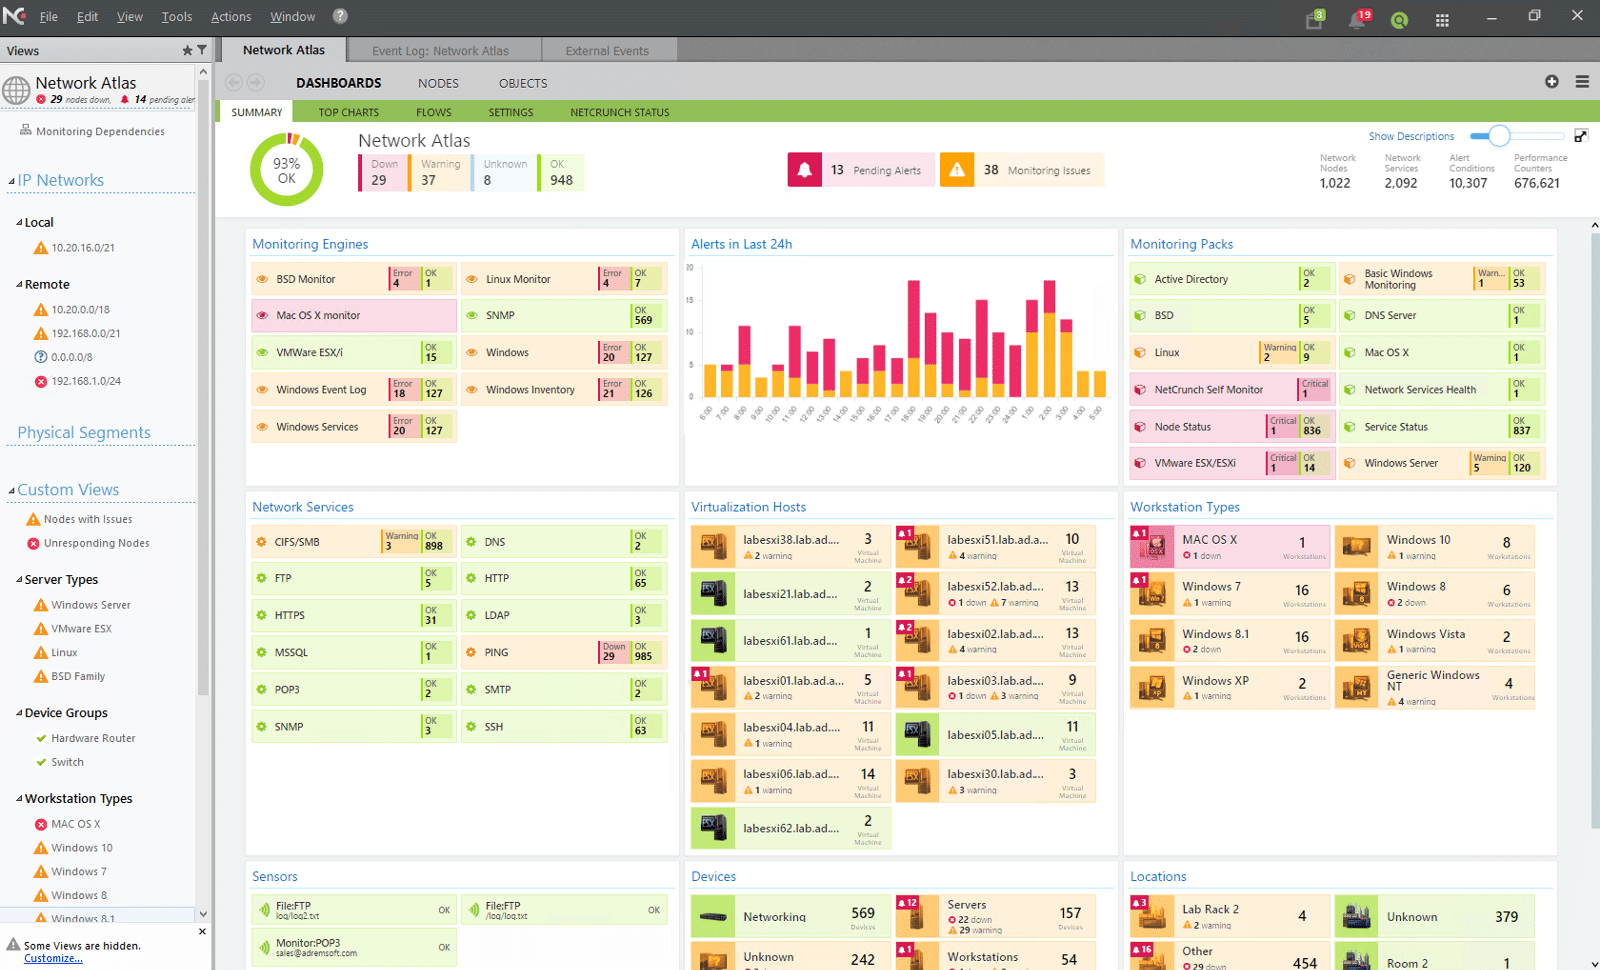
AdRem NetCrunch is a comprehensive platform that can monitor anything in your network, from devices to protocols, services, events, logs, and more. It supports more than 680 targets straight out of the box, making it easy to monitor any environment. It sintuitive dashboards and reports also help better understand the statuses.
Key Features:
- Auto-discovery of devices.
- Wide range of hardware devices.
- Meaningful alerts and notifications.
- Customizable dashboards
- Detailed analysis based on policies and rules.
Why do we recommend it?
One of the notable aspects of NetCrunch is its depth of coverage. It goes beyond devices and applications, and includes events, logs, traffic flows, and more. When data from all these different aspects are combined and analyzed, you have a more holistic picture of the state of your network.
Additionally, all the data collected from these different points is automatically analyzed based on your custom polices and configuration. Such an analysis makes alerts meaningful and accurate, and at the same time, provides the control you need to reduce alert fatigue.
The analyzed data is displayed through intuitive dashboards, presentations, reports, and graphs, enabling people from different backgrounds to better understand the data.
Who is it recommended for?
It is recommended for organizations of all sizes, especially large ones that have multiple aspects to monitor. It also works well for environments with mixed devices, including IoT and industrial equipment.
Pros:
- Traffic flow analysis with support for multiple technologies.
- Easy-to-understand presentations and graphs.
- Detailed analysis of data.
- Event correlation and log analysis.
Cons:
- No mobile app.
NetCrunch offers three plans based on your needs. The System Monitoring plan is priced at €2,625, the Bandwidth and Network Monitoring at €2,325, and the Mixed Environment at €16,250, respectively. You can watch a demo to decide which one works best for you. Start a a 30-day free trial.
6. Site24x7 Network Monitor – FREE TRIAL

Site24x7 is a cloud-based service and part of the Site24x7 monitoring platform. There isn’t a Network Monitoring plan available to the public; instead, Site24x7 offers the Network Monitor as part of all of its plans.
Key Features:
- Cloud-based package
- Autodiscovery
- Inventory and network map
- SNMP-based monitoring
Why do we recommend it?
Site24x7 offers a holistic monitoring solution that is not limited to just network monitoring. Its cloud-based approach ensures accessibility from anywhere, while the combined power of device performance monitoring and network traffic analysis provides comprehensive insights into network health.
One of these is the Site24x7 Infrastructure monitoring system that covers servers, applications, and websites, and well as networks. The Network Monitors both a network device performance monitor and a network traffic analyzer.
The device status monitor relies on the procedures of SNMP to communicate with device agents and receive regular status reports. These reports are interpreted into live performance data, shown in the Site24x7 dashboard.
The dashboard is resident in the cloud and users access it through any standard Web browser. The screens of the dashboard can all be customized.
The Network Monitor includes an alerting system that notifies staff by SMS, email, voice call, or instant messaging post if any problems arise on the network.
Who is it recommended for?
Given its cloud-based nature and extensive feature set, Site24x7 is perfect for businesses that rely heavily on digital platforms, such as e-commerce websites or SaaS businesses. It’s also suitable for IT teams that need an all-in-one monitoring solution that covers servers, applications, websites, and networks, ensuring seamless integration of insights.
Pros:
- Allows users to keep track of switches, routers as well as firewalls.
- With Site24x7, you can keep an eye on app servers and ERP systems.
- The dashboard insights help keep an eye on all connected devices and networks.
- Helps address all technical problems and gaps in business metrics.
- Generates a map that displays the network hierarchy
Cons:
- The platform is complex and takes time to learn.
You can start a 30-day free trial by registering your details on their site.
7. Atera – FREE TRIAL

Atera is a cloud platform of tools for managed service providers (MSPs). These include a package called professional service automation (PSA), which provides the software that the managers or an MSP need to operate their business. The Atera platform also provides tools for technicians, which is called a remote monitoring and management (RMM) system.
Key Features:
- Remote monitoring and management
- Alerts for performance problems
- Ticketing system
Why do we recommend it?
With its ability to operate autonomously through the SNMP system and provide real-time alerts, Atera ensures that technicians can focus on other crucial tasks without being bogged down by constant monitoring. Features like task automation, patch management, and a ticketing system make it a comprehensive solution for IT service management.
Atera’s network monitoring system operates without manual intervention, thanks to the use of the SNMP system. This also provides warnings about network device status problems and there is a system of performance thresholds that trigger alerts when crossed.
Alerts man that technicians can assume that there are no problems with the network unless they are otherwise notified. This frees them up for other tasks, improving productivity and cost efficiency.
Other tools in the Atera package include task automation, a patch manager, and a ticketing system.
Who is it recommended for?
Atera is primarily designed for managed service providers (MSPs) who need an integrated platform to streamline their operations. Its comprehensive toolset makes it ideal for MSPs looking to improve operational efficiency, manage multiple networks, and provide timely client support.
Pros:
- You can administer and monitor several networks using a single console
- Runs network scans instantly
- Easy to manage all connected devices from the mobile or any location, anytime
- Helps track directories, system resources, IPs, and monitor servers, as well as updates.
- Helps track and fix issues in real-time before any harm is done.
Cons:
- You may need to pay additional for network mapping.
Assess the Atera platform with a 30-day free trial.
8. ManageEngine OpManager – FREE TRIAL
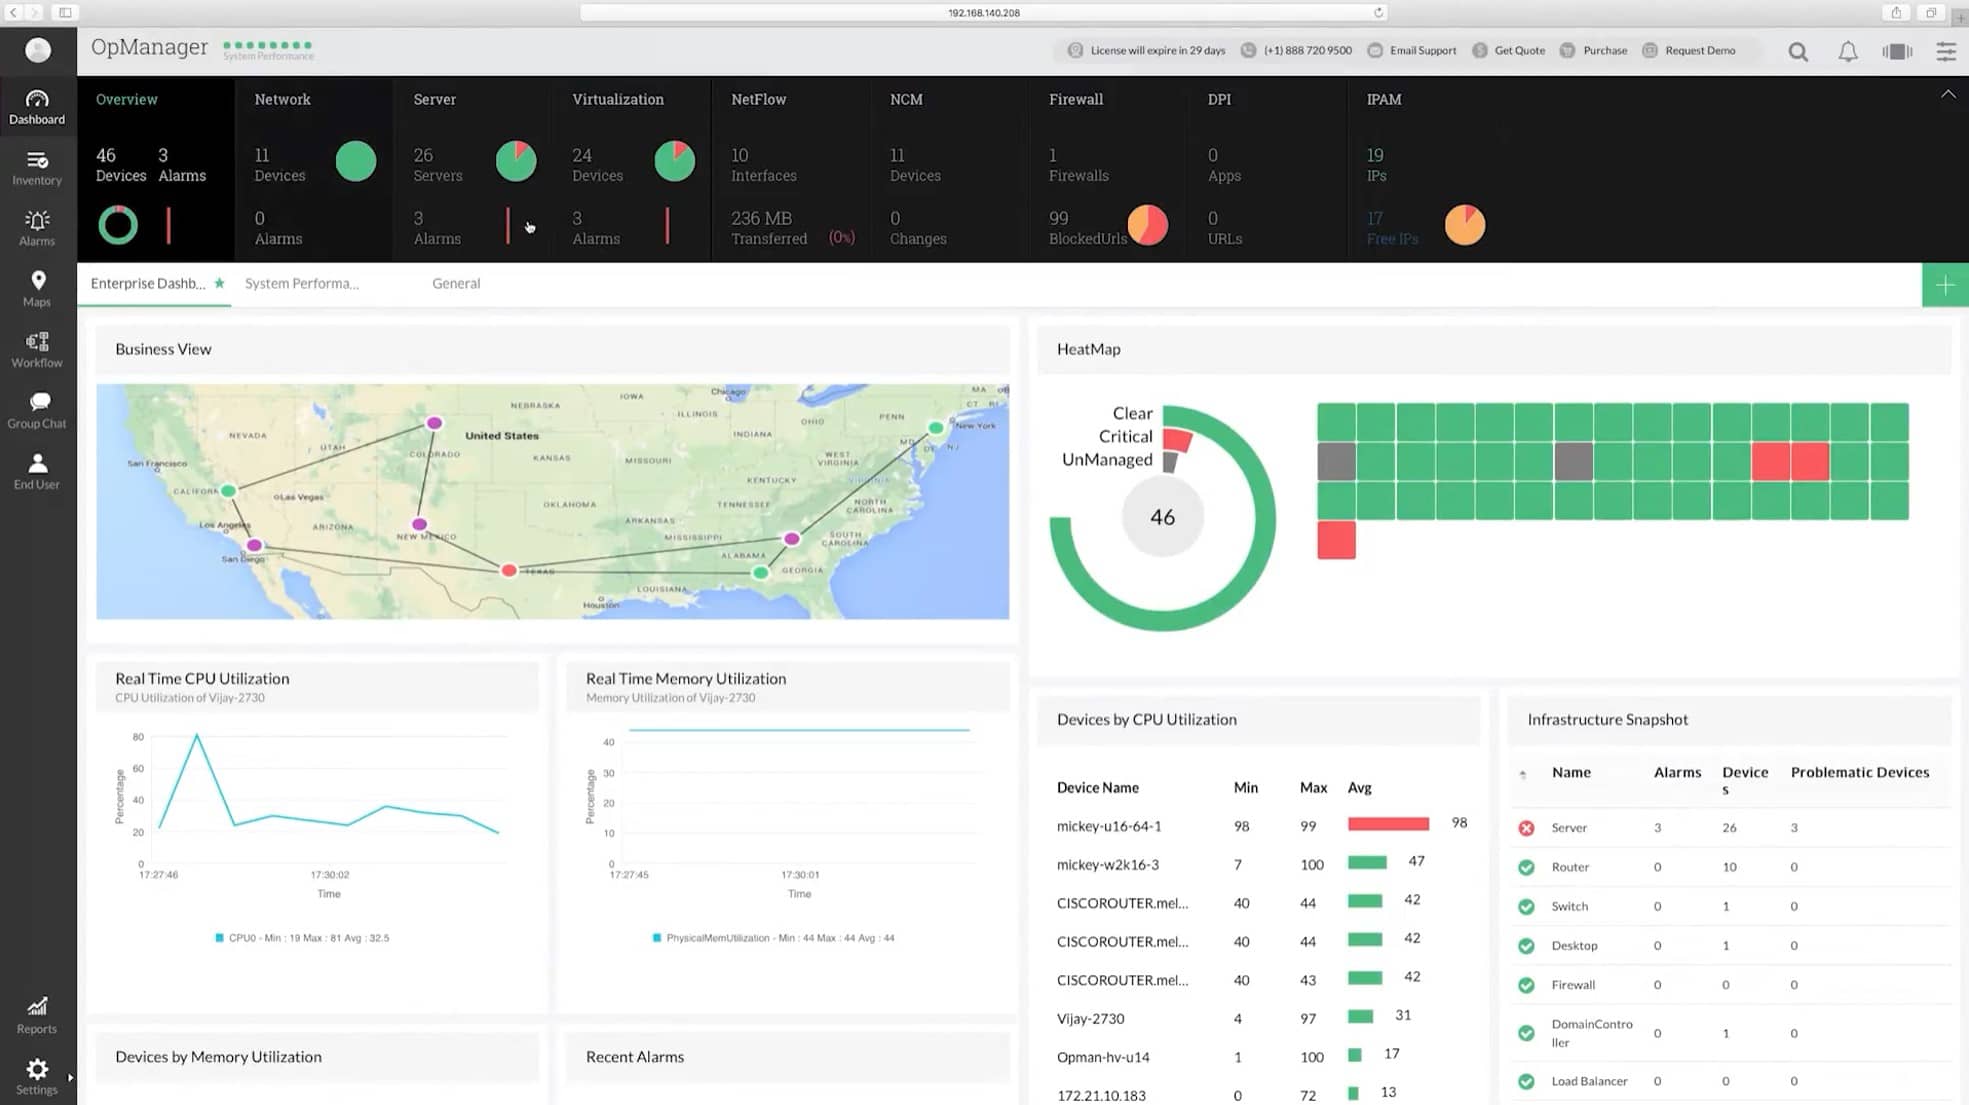
ManageEngine OpManager provides monitoring for network devices and endpoints. It includes an autodiscovery phase that repeats continuously. That feature creates and then automatically maintains a network inventory that details each piece of equipment. The network inventory also provides the source data for a network topology map, so when the inventory gets updated, the map is also refreshed.
Key Features:
- Network and server monitoring
- Autodiscovery
- Inventory and network map
Why do we recommend it?
ManageEngine OpManager stands out for its continuous autodiscovery, ensuring that the network inventory and topology maps are always up-to-date. With its SNMP-based polling mechanism, it guarantees real-time device status reports, ensuring that any problems are identified promptly.
The mechanism that discovers all devices is based on a poll implemented by the Simple Network Management Protocol (SNMP): OpManager sends out a report request broadcast and all devices on the network respond with a list of their features and statuses. As well as providing information for the inventory, these reports, called MIBs, are the source of all device status reports in the network monitoring dashboard. If a component of a device is experiencing a problem, the SNMP agent on the device will create an alert (called a Trap) and send it to OpManager.
The OpManager dashboard shows any alerts that it receives, giving each a severity category. An administrator can set up notification forwarding rules in the console to send those alerts on to technicians by email, SMS, or Slack message. Thus, IT department technicians don’t have to watch the monitoring screen all the time because they will be notified, with time to spare, if a problem needs attention.
Who is it recommended for?
ManageEngine OpManager is ideal for medium to large-sized businesses or enterprises with dynamic network environments. Given its capabilities for VM monitoring across multiple platforms and its detailed network mapping options, it’s also suited for IT departments that manage complex network architectures or rely heavily on virtualized infrastructure.
Pros:
- Automatic network discovery and inventory management
- A choice of network map layouts
- Automated network monitoring with alerts
- Scanning for server resource capacity and availability
- VM monitoring for Hyper-V, VMware, Citrix Xen, and Nutanix
Cons:
- No SaaS version
The software for OpManager can be installed on Windows Server or Linux. The package is also available for hosting on an AWS or Azure account. Manage Engine offers a 30-day free trial of OpManager.
9. ITRS OP5 Monitor
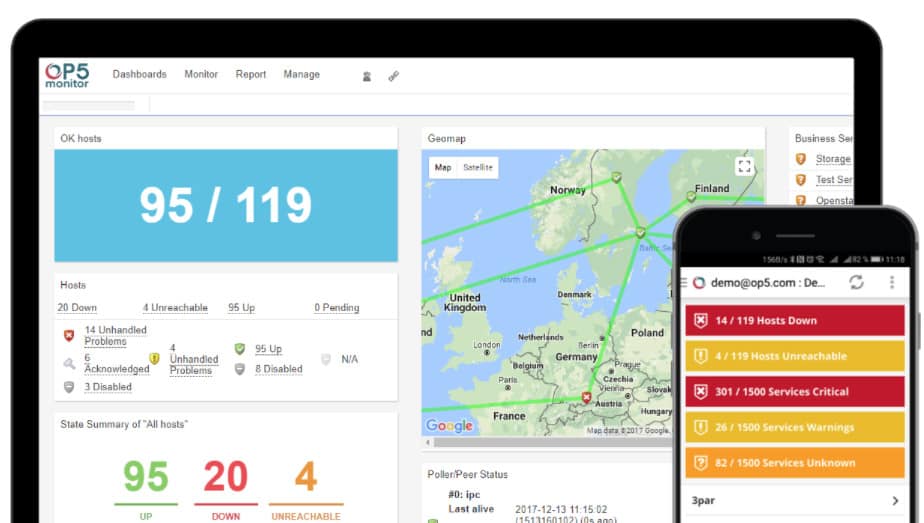
ITRS OP5 Monitor is a network supervisor that is based on the free Nagios Core (see below). This tool is able to monitor resources on premises, on remote sites, and on the Cloud. The OP5 Monitor system automatically identifies all devices on the network and implements its performance tracking system. The service also presents an automatically-drawn network topology maps.
Key Features:
- Monitors hybrid systems
- SLA tracking
- Network map
Why do we recommend it?
ITRS OP5 Monitor stands out as a comprehensive network monitoring solution, leveraging the power of Nagios Core as its foundation. Its ability to monitor hybrid systems, including on-premises, remote sites, and the Cloud, makes it a versatile choice for businesses with diverse infrastructure.
The OP5 console presents an overview of the network with summaries of all performance metrics. It facilitates a drill-down system that presents the user with greater detail on a device list page. Clicking through an item on that screen gets the user detailed information about the performance of a particular device.
The OP5 Monitor can be set up to monitor the performance standards laid out in the SLAs that your IT department needs to deliver on. Once this setup is in place, the OP5 system will draw safety levels that lie within the expectations of the SLA. These levels trigger warnings if the actual performance of the network goes out of bounds. The alert structure buys you time to reorganize network services and avoid letting your service’s performance break the promises laid out in the SLA.
Who is it recommended for?
ITRS OP5 Monitor is ideal for businesses of varying sizes and industries looking for a highly customizable and scalable monitoring solution. Its ability to adapt to hybrid environments and offer advanced reporting makes it suitable for IT departments seeking a clear and comprehensive view of their entire IT estate.
Pros:
- Monitors resources on-site, at other locations, and in the cloud.
- Creates network topology maps automatically.
- Provides insights on the device list page and their performance
- Highly customizable scalable monitoring solution
- Provides a clear view of the entire IT estate and offers advanced reporting
Cons:
- For Windows, you require a virtual machine from Oracle Virtual Box or VMware.
- The Dashboard interface requires improvement
ITRS OP5 Monitor installs on Linux. It is also possible to run it on a Windows computer over a VM
10. Obkio
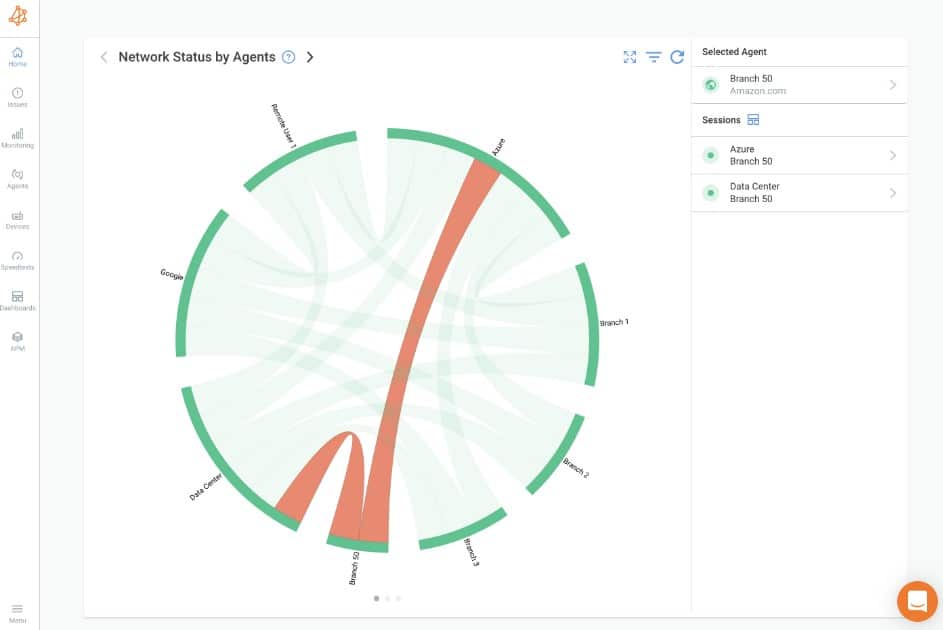
Obkio is a simple and effective monitoring tool that tracks multiple metrics to provide a detailed view of your network in real-time. It analyzes these metrics to provide information about the issues in your network, so your team can quickly address them.
Key Features:
- Uses agents to run performance tests and collect measurements.
- Analyzes data to provide contextual insights and root cause analysis.
- Comes with an intuitive interface to easily understand the metrics.
- Sends notifications based on analyzed data.
Why do we recommend it?
Obkio is an easy-to-use monitoring tool that comes with straightforward, but powerful capabilities. One of the standout features for us is that it can be used across multiple environments and use cases. It supports decentralized monitoring with distributed agents, making it easy to gather insights from any corner of your network. Its powerful analytical and visualization tools make it easy to understand the status and performance of your systems.
Who is it recommended for?
This platform is recommended for organizations of all sizes. In particular, it is helpful for MSPs who need visibility into the clients’ networks for troubleshooting.
Pros:
- Identifies the root cause of problems.
- Displays rich visualizations for easy understanding.
- Conducts comprehensive analyses.
- Set up is quick.
Cons:
- Fewer integrations.
Obkio’s have Starter, Basic, Premium, and Custom Enterprise plans starting at $224 per month when paid annually. Start a 14-day free trial.
11. SolarWinds Network Performance Monitor
The SolarWinds Network Performance Monitor is the most impressive real-time network monitoring tool on this list. The system starts its service life by scanning your network after installation and logging all of the devices that connect your network together. It creates a network inventory and then draws up a network topology map from that information.
Key Features:
- Autodiscovery
- Device inventory
- Network topology map
- SNMP polling
- Alerts for performance problems
Why do we recommend it?
SolarWinds Network Performance Monitor stands out for its comprehensive network monitoring features and intuitive and customizable dashboard. The ability to auto-discover devices and generate a network topology map offers a clear, real-time view of the network, ensuring immediate identification and resolution of any emerging issues.
The software inventory and network topology map are updated regularly with information derived from SNMP status checks, so the monitor immediately knows where any devices have been added, moved, or removed. This constant review of the infrastructure will also tell you whether unauthorized devices have been connected to the network.
Once the network inventory has been created, the Network Performance Monitoring tool starts its real-time tracking of all network issues. The attractive dashboard for the service includes easy-to-read color-coded graphics that assist in instant problem recognition.
You don’t have to sit and watch the screens of this tool in order to make sure that you don’t miss any problems emerging on the network because the service will notify you if your attention is needed. The system gets status notifications from agent software running on each network device and sends you a warning by email or SMS so you know to come back to the console.
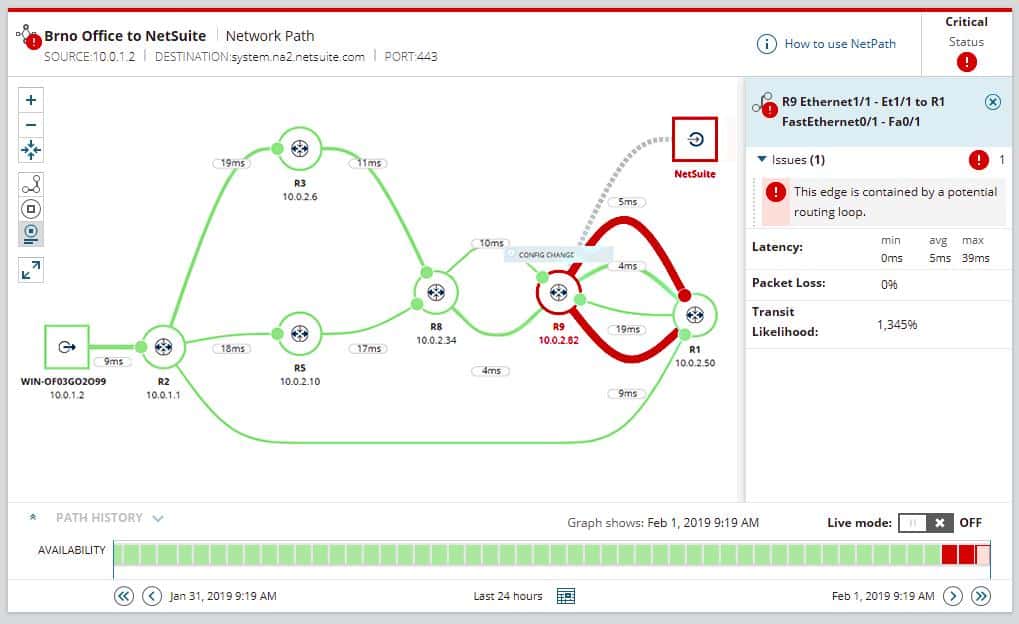
Other features in this tool include performance analysis features, such as NetPath, which allows you to see the statuses of all connections on a route between any two given points on the network. The tool can reach across the Internet to monitor remote networks and it can also analyze the paths to Cloud-based services.
Who is it recommended for?
This tool is particularly beneficial for medium to large-scale businesses with complex networks. Its capacity to offer detailed insights makes it suitable for IT administrators and network managers who need a bird’s eye view of the entire network and granular details to troubleshoot specific issues. Given its advanced features, it might be overkill for small businesses with straightforward network setups.
Pros:
- Helps troubleshoot networks on various environments via hop-by-hop analysis feature
- Its customizable dashboard aids in improving operational efficiency.
- Allows users to send alerts and create a report in real-time.
- Better visibility into the status of VPN tunnels
- The autodiscovery help create network topology maps
Cons:
- SolarWinds NPM is suitable for small LANs and operations
The Network Performance Monitor installs on Windows Server and SolarWinds offers it for a 30-day free trial.
provided by VMWare or Oracle Virtual Box. There are versions of the system available for cloud access on Azure and AWS platforms. ITRS offers OP5 Monitor on a 30-day free trial.
12. Fortra’s Intermapper
Fortra’s Intermapper is a complete system monitoring tool that covers networks, network equipment, servers, endpoints, And other devices connected to a network. The software is available in free and paid versions. The free plan has all of the features of the paid system but it is limited to monitoring only five devices.
Key Features:
- Autodiscovery
- Network mapping
- SLA tracking
Why do we recommend it?
Fortra’s Intermapper’s availability in both free and paid versions offers flexibility to users. Even the free plan provides access to all features, making it an attractive choice for those monitoring a small network with up to five devices. The tool’s autodiscovery and network mapping capabilities ensure that you always have an up-to-date view of your network’s topology.
As the name of this tool suggests, it is driven by a network map, which forms a menu through to device performance statistics. The system discovers all devices connected to the network and uses this information to create the network topology map. The map is constantly updated as the monitor polls devices for live statuses.
As well as providing live network monitoring, the Intermapper service stores performance metrics and supports the analysis of historical data. The service will also help you track SLA goal achievement and send out an alert if performance deteriorates to the point where it could become noticeable by the users, or approach the limits of SLA service expectations.
Who is it recommended for?
Intermapper is recommended for both small and large organizations looking for a complete system monitoring solution. The free version is an excellent choice for small networks with up to five devices, while the paid version offers scalability to meet the needs of larger, complex networks. Its cross-compatibility with Windows, macOS, and Linux operating systems makes it suitable for a wide range of environments.
Pros:
- Discovers devices, collect data, and creates network topology maps
- Perform historical data analysis
- Helps users maintain a record of SLA goal achievements
- Works great with Windows, macOS, and Linux operating systems
- Sends immediate alerts to the administrators on detecting performance issues
Cons:
- It can be difficult to build and connect if a device isn’t automatically detected
- The user interface can occasionally be a bit confusing
Intermapper installs on Windows, macOS, and Linux. Fortra offers the paid service of Intermapper on a 30-day free trial.
13. Nagios XI
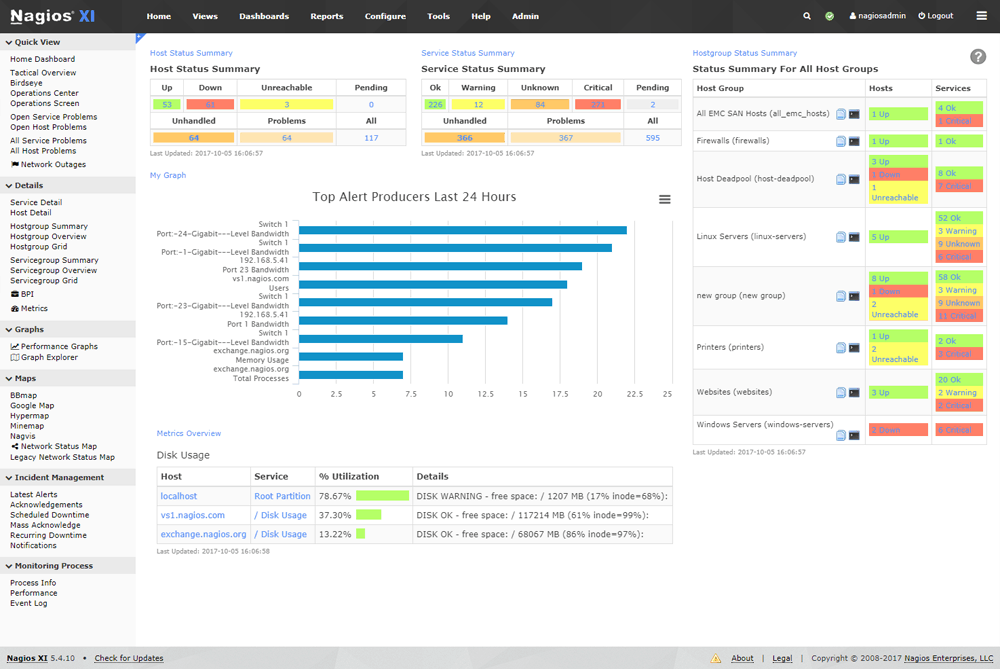
Nagios XI is a remarkable system monitoring tool that covers networks, servers, and applications. This is the paid version of the widely-distributed free, open-source Nagios Core. A notable feature of both Nagios versions is the large library of free plug-ins that is available to extend and tailor the capabilities of the monitoring system.
Key Features:
- Full stack monitoring
- Network inventory and map
- Performance thresholds and alerts
Why do we recommend it?
Nagios XI builds upon the foundation of the widely-used Nagios Core, providing an extensive library of free plugins to tailor and extend its monitoring capabilities. The automated network discovery and topology mapping feature, along with performance thresholds and alerts, make it a reliable choice for real-time monitoring and alerting.
Nagios XI has a network discovery and automated topology mapping feature that is constantly updated while the system scans for live performance metrics. Like the other tools in this list, Nagios XI places performance thresholds on all of the statistics that it monitors. When performance drops below acceptable levels, Nagios XI raises an alert.
As well as providing live status monitoring, the Nagios XI system stores performance statistics and includes analytical tools to identify trends and capacity requirements from those data sources.
Other features in the Nagios XI system include access rights management, configuration management and protection, Web application performance monitoring, and virtualization monitoring.
Who is it recommended for?
Nagios XI is recommended for organizations seeking a robust and customizable system monitoring solution. Its extensive library of plugins and analytical tools makes it suitable for businesses of all sizes.
Pros:
- Helps monitor servers, applications as well as network protocols
- Visibility into network elements and data.
- Quick insights into third-party data
- Supports integration with third-party applications.
- Uses configuration wizards to track new devices and apps
Cons:
- The open-source version offers poor assistance
- Difficult and complicated installation procedure
Nagios XI installs on Linux. If you only have Windows servers, you can install it over a VM. Nagios XI is available for a 30-day free trial.
Related Post: Best NetApp Monitoring Software
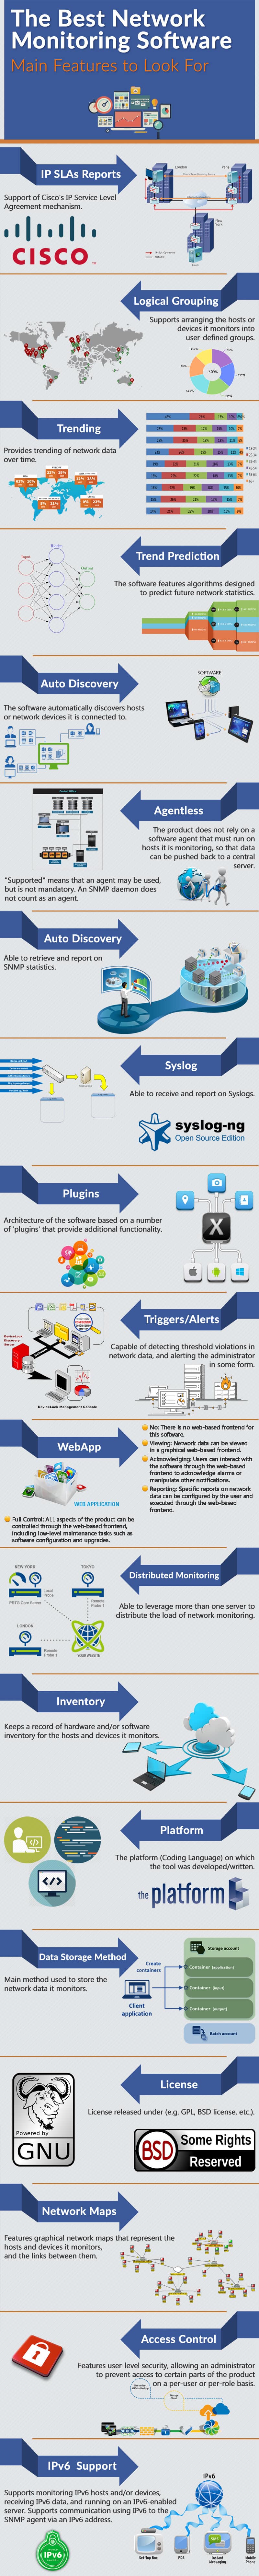
Feel Free to Embed this Infographic in your site with the Code Provided below.
