
Finding a the Best Virtualization Manager Software to Monitor and utilize your hyper-visor to its fullest is Crucial in any environment. Virtualization offers a ton of benefits in the form of cost saving, improved performance, reduced workloads and increased efficiency in business operations. This is why it’s an integral part of every business today.
Here is our list of the best VM monitoring software:
- NinjaOne – EDITOR’S CHOICE This remote monitoring and management (RMM) package is delivered from the cloud and can monitor multiple sites simultaneously, covering networks, servers, and applications, including virtualizations. Access a 14-day free trial.
- Paessler PRTG – FREE TRIAL This bundle of monitoring services includes sensors that discover and track VMware, Hyper-V, Citrix, and Nutanix systems. Available as a SaaS platform or a software package for Windows Server. Get a 30-day free trial.
- ManageEngine OpManager – FREE TRIAL A network and server monitor that includes monitoring for VMWare, Hyper-V, Citrix, and Nutanix virtualizations. Available for Windows Server and Linux. Access the 30-day free trial.
- Site24x7 VMware Monitoring – FREE TRIAL A monitor for networks, servers, and applications that includes the monitoring of virtualizations and containers. This is a cloud-based service. Get a 30-day free trial.
- ManageEngine Applications Manager – FREE TRIAL A monitor for applications that covers virtualizations, including VMWare and Hyper-V. Installs on Windows Server and Linux. Start 30-day free trial.
- IntelliMagic Vision This system monitor drills through VMWare virtual structure, into a storage fabric, and through to the resources of underlying physical resources to create a full stack view of virtualization performance. Offered as a virtual appliance or as a cloud platform.
- Datadog Infrastructure An app stack monitor that covers all services from user interfaces down to the server operating system and has integrations that monitor the major virtualization brands. This is a cloud-based system.
- SolarWinds Virtualization Manager This on-premises package will monitor Hyper-V, VMware vSphere, and Nutanix AHV systems. It will also scan the hosts of these systems and identify network issues.
- VMWare vRealize Operation Manager This is a monitoring system for VMWare products, including vShpere, vCloud, and Kubernetes containers. Runs on top of VMWare hypervisors or can be subscribed to as a cloud SaaS.
- Veeam ONE Monitors virtualizations by VMware vSphere, Microsoft Hyper-V and Nutanix AHV plus backup systems. Installs on Windows and Windows Server.
At the same time, the maintenance and management of these virtual machines have to be handled well because they are critical for the very operations of a business. In other words, these virtual machines can never go down, or for that matter, even slow down.
To manage these virtual devices and to ensure they are up and running always, you need a proactive and comprehensive virtualization manager.
Here’s a look at some of the best virtualization managers for different virtualization software such as Hyper-V, VMWare, ESXi and more. These Reviews and Features are a good starting point for choosing which one you should implement in your network and we highly suggest you download and start monitoring today.
Methodology for selecting the Best Virtualization Manager
Most companies rely on Virtualization Manager to resolve performance issues and improve efficiency. If you are looking for the best Virtualization Manager for your organization, here are a few methodologies that you must consider:
- Check if it has the ability to analyze physical server resource usage
- Does it provide real-time monitoring with graphical data interpretations?
- Does it support remapping VMs to servers?
The Best VM Management & Monitoring Software
1. NinjaOne – FREE TRIAL
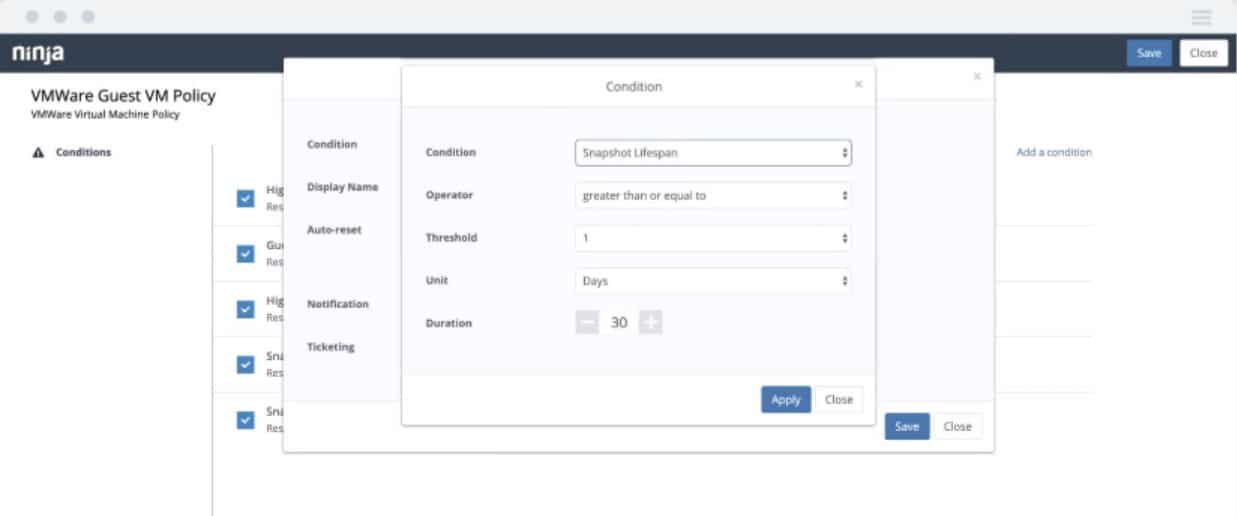
NinjaOne includes the performance monitoring and management of Hyper-V and VMware virtualizations as part of its remote monitoring and management services.
The management functions in the package let you access details of all of your virtualization implementations, which could be on multiple sites, in one console.
The full package looks after networks, servers, cloud platforms, and applications.
Key Features:
- Virtualization discovery
- Visual representation of the mapping between VMs and virtual servers
- Physical host monitoring
- Guest allocation to hosts
- Snapshot management
- The ability to monitor virtualizations on many sites from one location
- A cloud-based service that can be accessed by technicians based in different offices or at home
- The monitoring and management of Hyper-V and VMware virtualizations
Why do we recommend it?
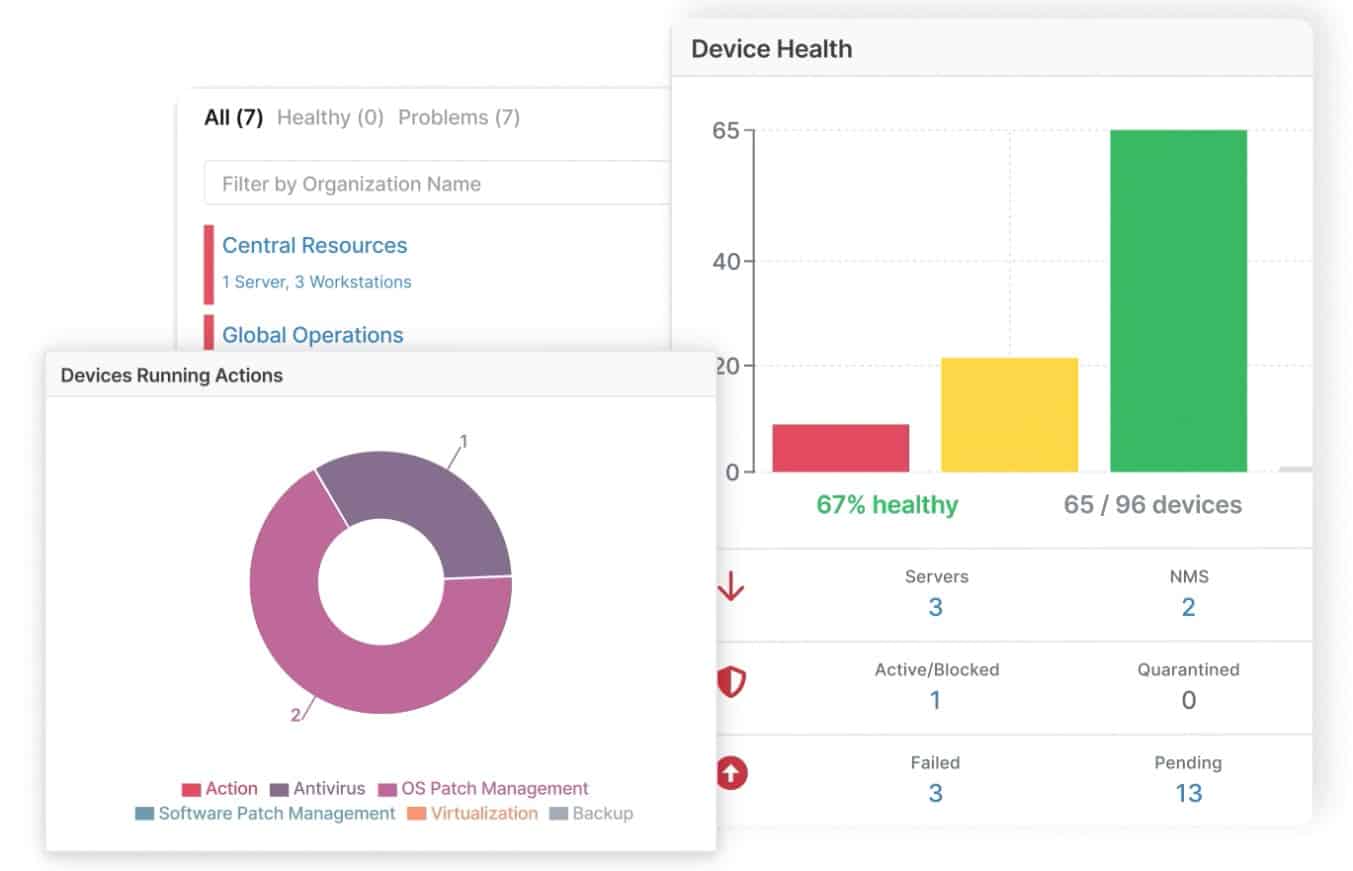
NinjaOne provides tools for IT support technicians. The package includes a Help Desk ticketing system and so also provides some team and task management features. All of the technician tools operate on remote systems and provide automated monitoring services with alerts for system problems and maintenance automation with features such as a patch manager.
This system discovers and maps your Hyper-V and VMware instances and that representation gives managers a better understanding of virtual infrastructure.
The documentation also forms a foundation for automated performance monitoring and root cause analysis features in the package.
The console enables a system administrator to manage multiple virtualizations in one dashboard.
The package is available in an optional multi-tenanted architecture for use by managed service providers.
The inventory of VMs includes static details, such as the brand, the version number, and the license conditions. The tool also records the most recent continuous uptime period.
Who is it recommended for?
NinjaOne is suitable for use by managed service providers and can keep the data of different clients separate by implementing subaccounts. The package, without the subaccount feature, is a good choice for IT departments for in-house use. It can monitor IT assets on one network or on multiple sites.
Pros:
- Tracks the physical resource usage of virtual systems
- Identifies overprovision of resources and inactive VMs
- Automated VM discovery and tracking
- Patching for operating systems and applications
- Optional multi-tenant architecture for managed service providers
Cons:
- No price list
Assess NinjaOne with a 14-day free trial.
EDITOR'S CHOICE
NinjaOne is our top pick for a virtualization management and monitoring software package because it is able to track the activity of VMware and Hyper-V systems. With observations on resource usage and demand on the virtual environment., this package gives you inputs to decision making over VM management. You might discover that a particular virtual server or vSwitch is overloaded and that you can solve the problem by shifting VM to server allocations. The tool also watches over the statuses of physical servers – the systems that host your virtualizations. The unavailability of server resources is one of the main reasons why VMs hang or stop working. Ensuring that those resources are available is an important task in delivering a quality service to your users. The NinjaOne platform is widely used by managed service providers, so you might have to ensure that the IT systems of multiple companies keep working effectively. Thus, the alerting system in the NinjaOne package really helps you head off disaster while managing multiple sites and multiple systems.
Download: Get a 14-day FREE Trial
Official Site: https://www.ninjaone.com/freetrialform/
OS: Cloud-based
2. Paessler PRTG – FREE TRIAL
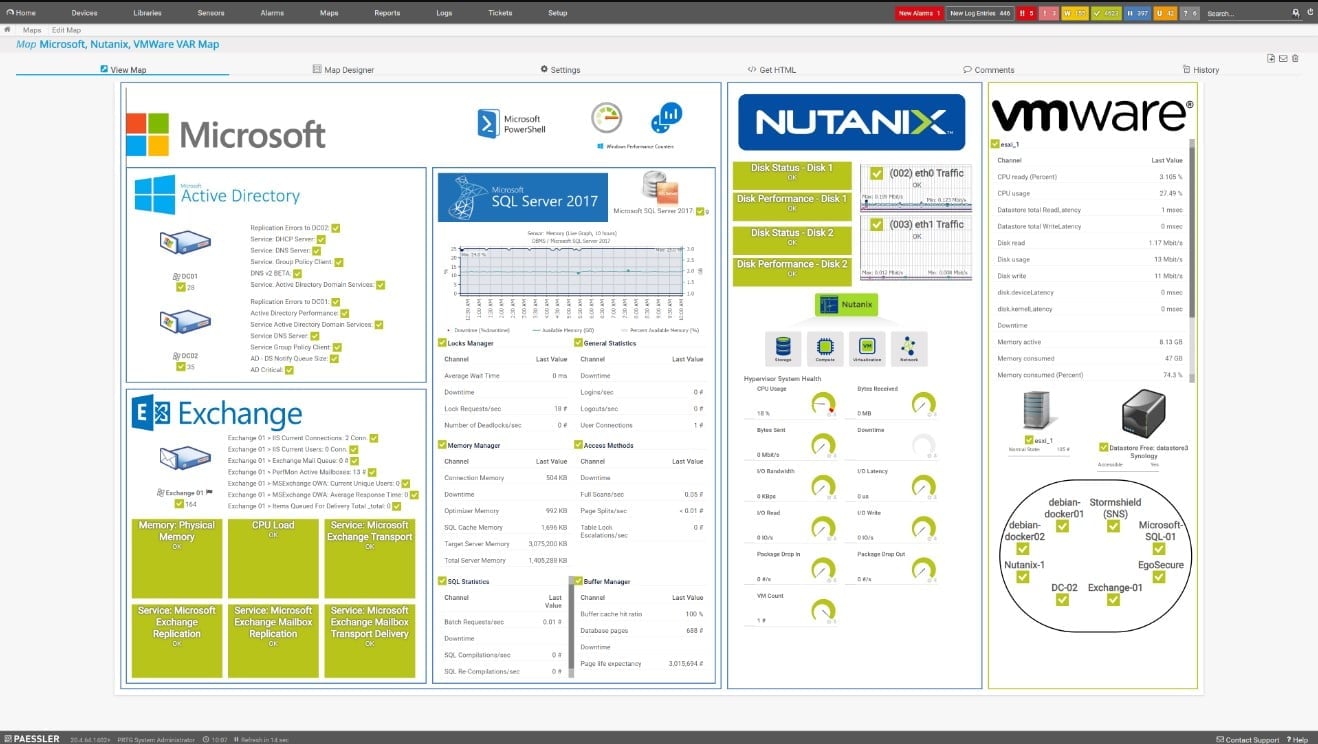
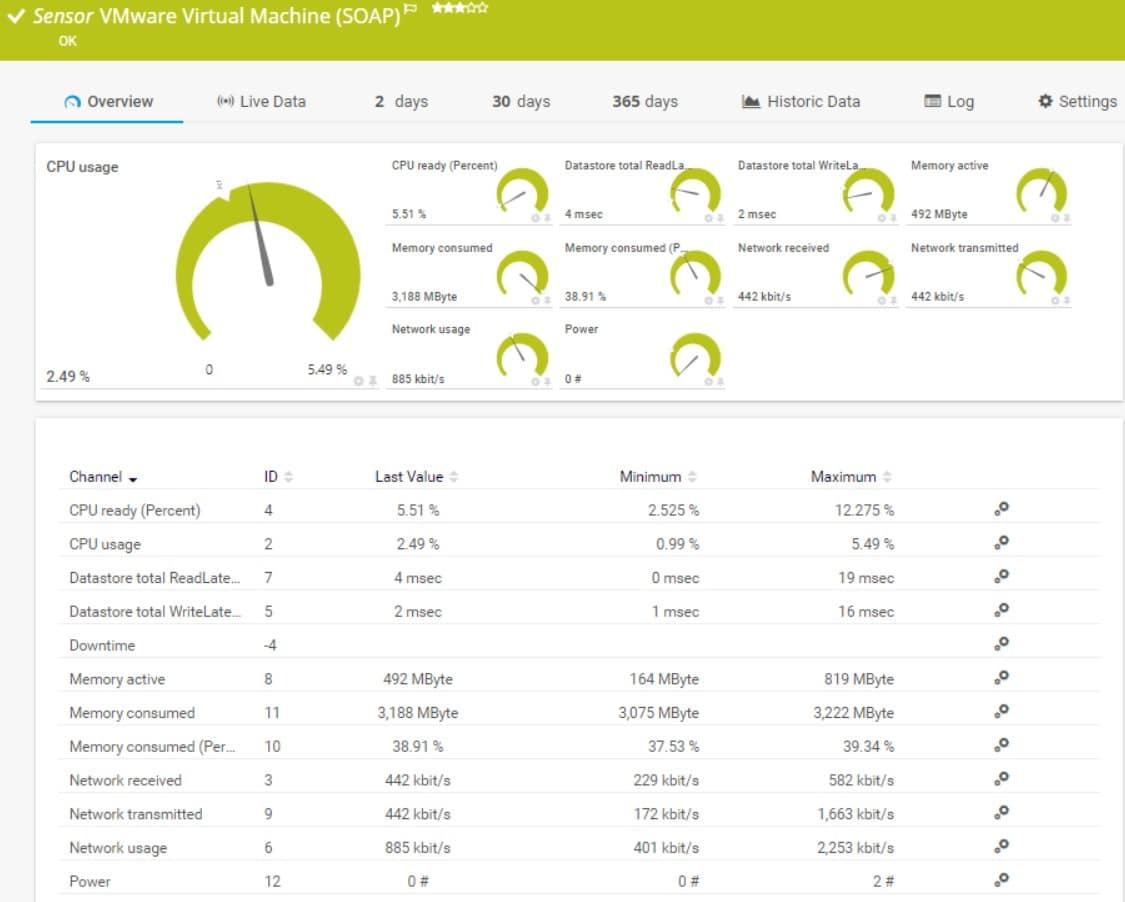
Paessler PRTG is a large bundle of monitoring tools that include sensors for VMware, Hyper-V, Citrix Xen, and Nutanix. The package includes many other sensors for networks, servers, and applications.
The buyer chooses which of the sensors in the package to activate, which makes the dashboard more manageable than enabling all of the possible screens for the console.
PRTG enables administrators to create custom screens, which can involve adapting a pre-written screen or assembling an entirely new screen.
Key Features:
- Monitoring for VMWare vShpere and ESXi
- Microsoft Hyper-V, Citrix XenServer, and Nutanix HCI monitoring
- Virtualization discovery and mapping
- Live VM activity monitoring
- Alerts for resource shortages
- Response time monitoring
- Tracking of the performance of the systems hosted on VMs
Why do we recommend it?
Paessler PRTG is a comprehensive package that provides performance monitoring for virtualizations, the systems that run on them, the server resources that support them, and the networks that deliver them. The PRTG bundle also includes monitoring for cloud-based services. The console is customizable, enabling the buyer to enhance the pre-written screens of the dashboard.
The PRTG package includes sensors for every type of network, including wireless networks and internet connections.
Every metric that PRTG gathers can have thresholds placed on them. These are performance expectations or resource utilization levels.
If a threshold is crossed, PRTG will raise an alert. You can adjust these threshold levels according to your own team’s typical response speed.
The system can be set up to forward alerts to technicians by email or SMS.
Alerts are shown in the dashboard and show a time, which makes root cause analysis possible because the first notification will indicate the original problem that rippled into problems in dependent services.
Who is it recommended for?
This package is suitable for any business because it isn’t limited to monitoring VMs but can track the performance of many other IT assets. The service is permanently free to use if you only activate 100 sensors. The charge rate for the package is levied according to how many sensors the buyer wants to use, which makes the package very scaleable.
Pros:
- Tracks interdependent technologies
- Additional sensors are available for physical server resource monitoring
- Examines the activity within a VM
- Observes VM resource needs
- Alerts that can be forwarded by SMS or email
Cons:
- Not available for Linux
Paessler PRTG is available as a SaaS platform and it can also be downloaded as a software package for Windows Server. You can get a 30-day free trial of PRTG with access to all sensors.
3. ManageEngine OpManager – FREE TRIAL
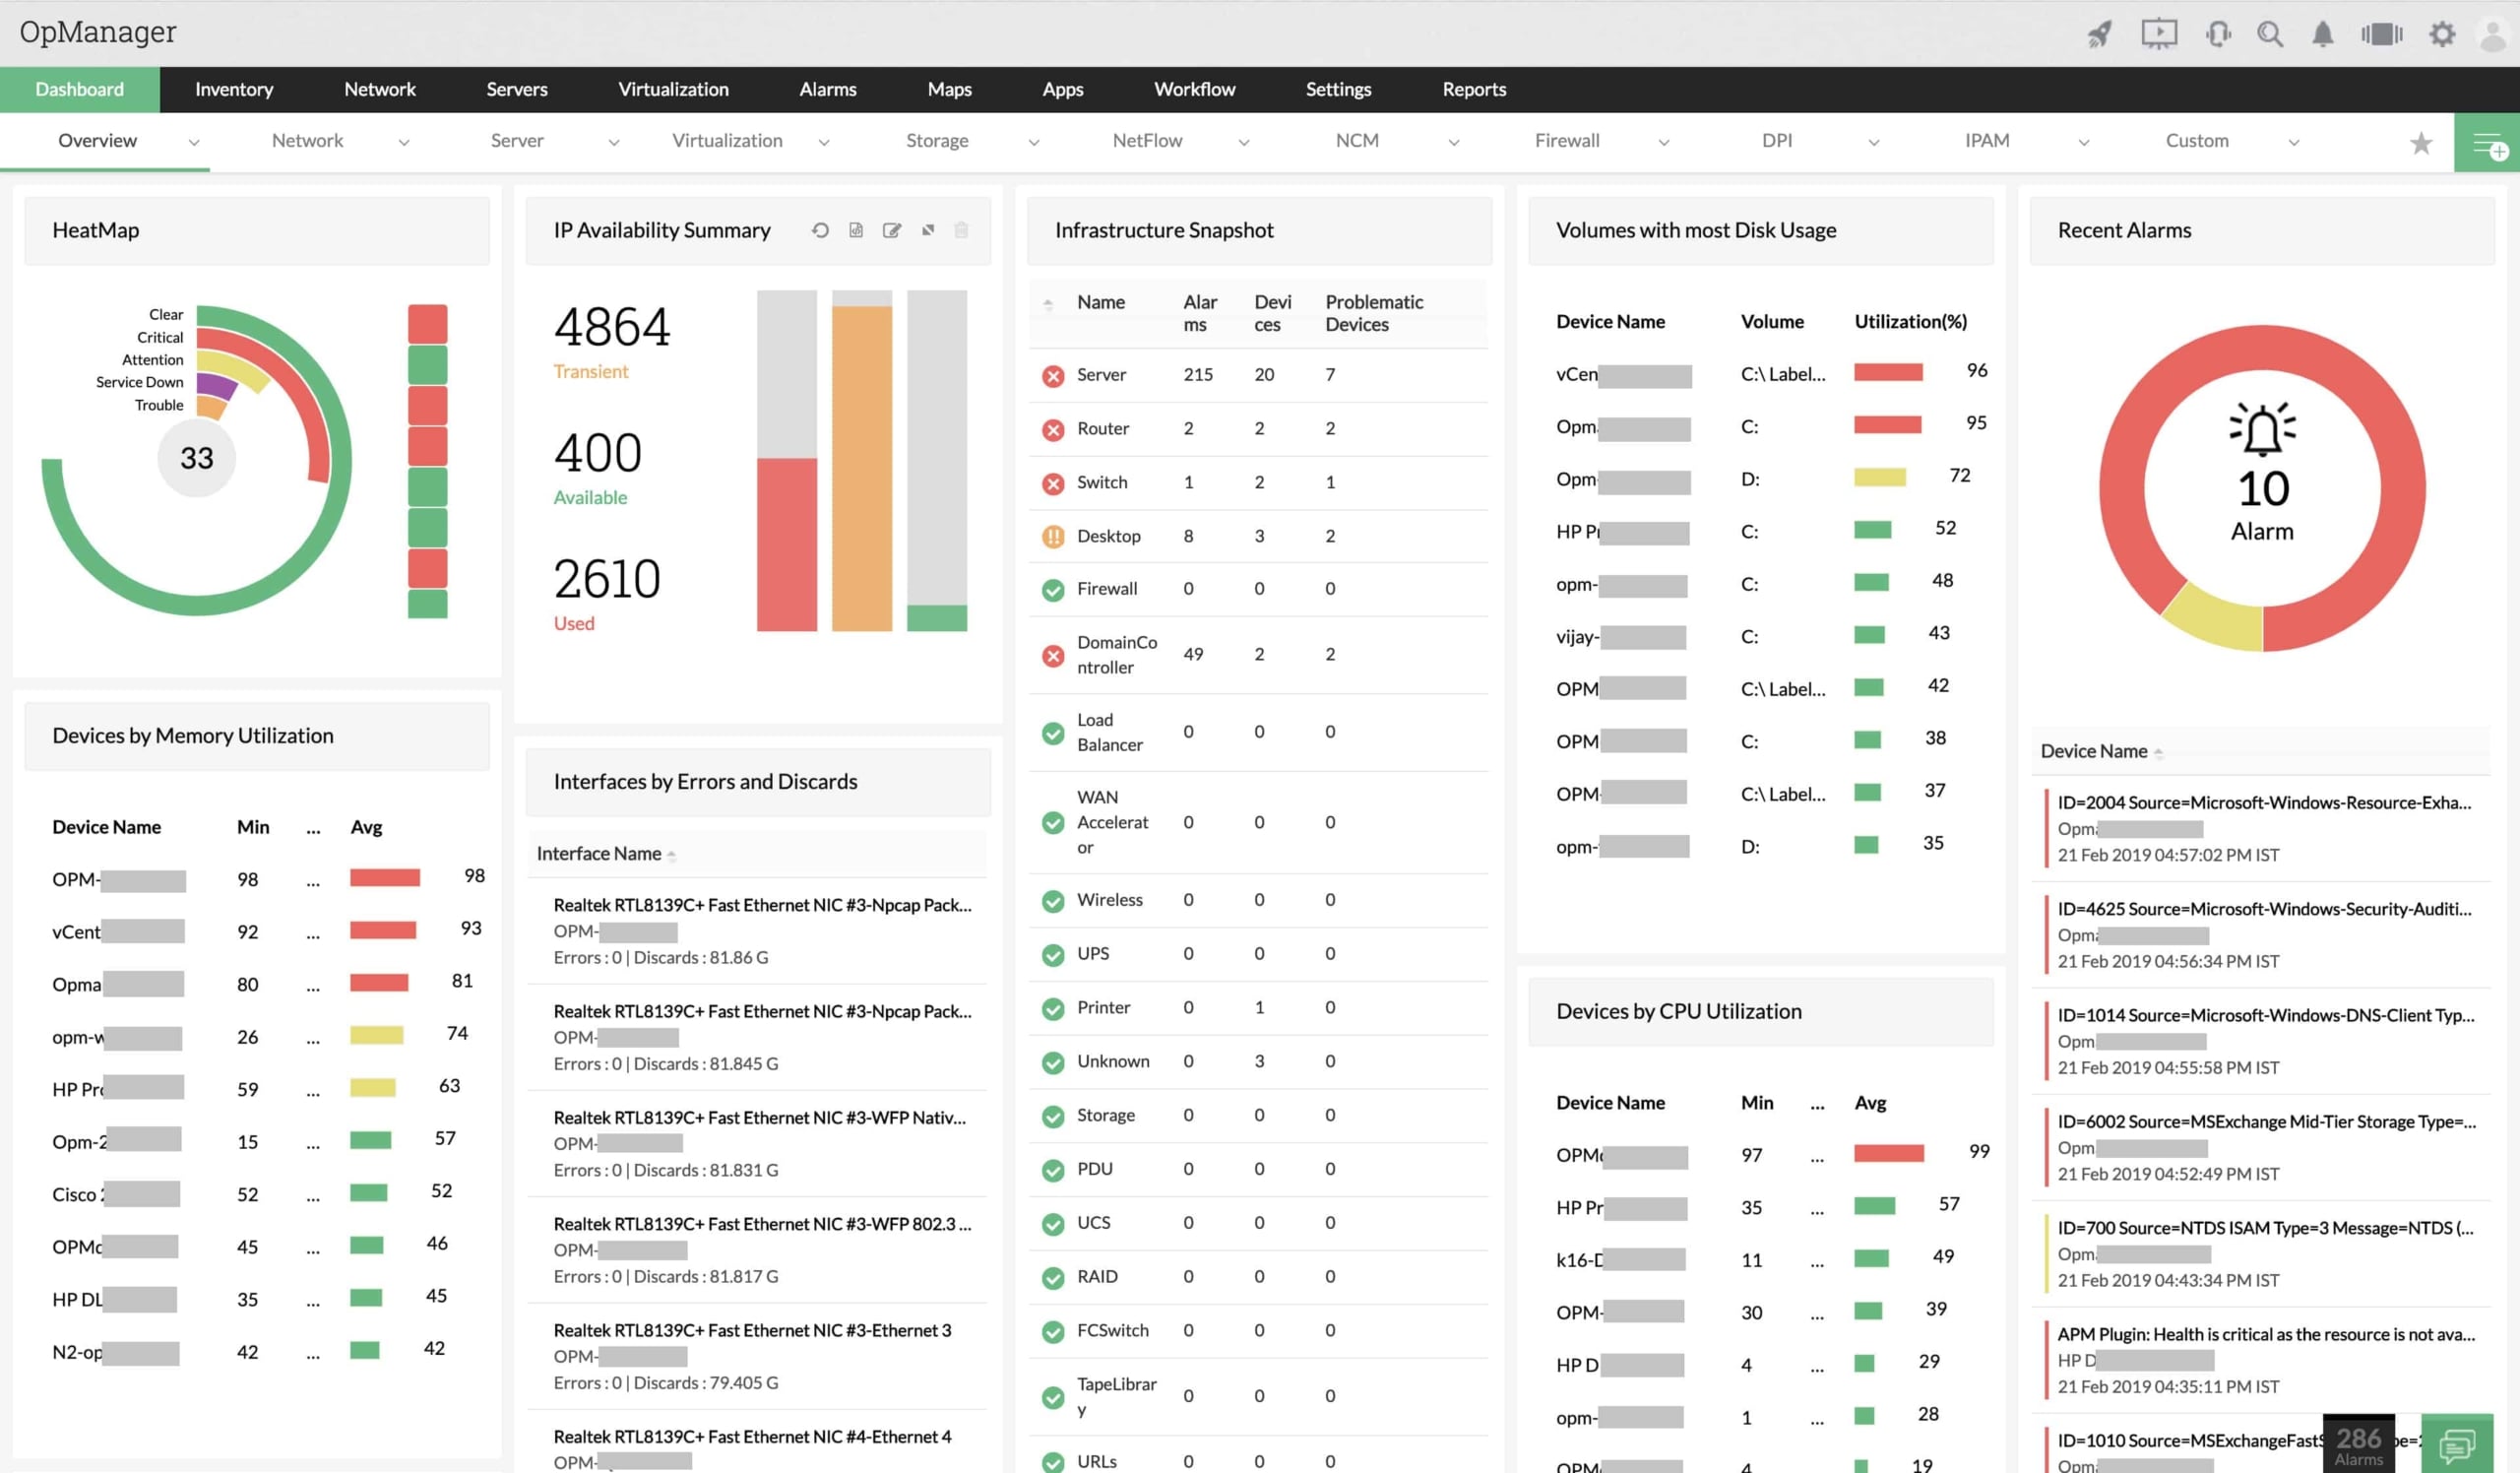
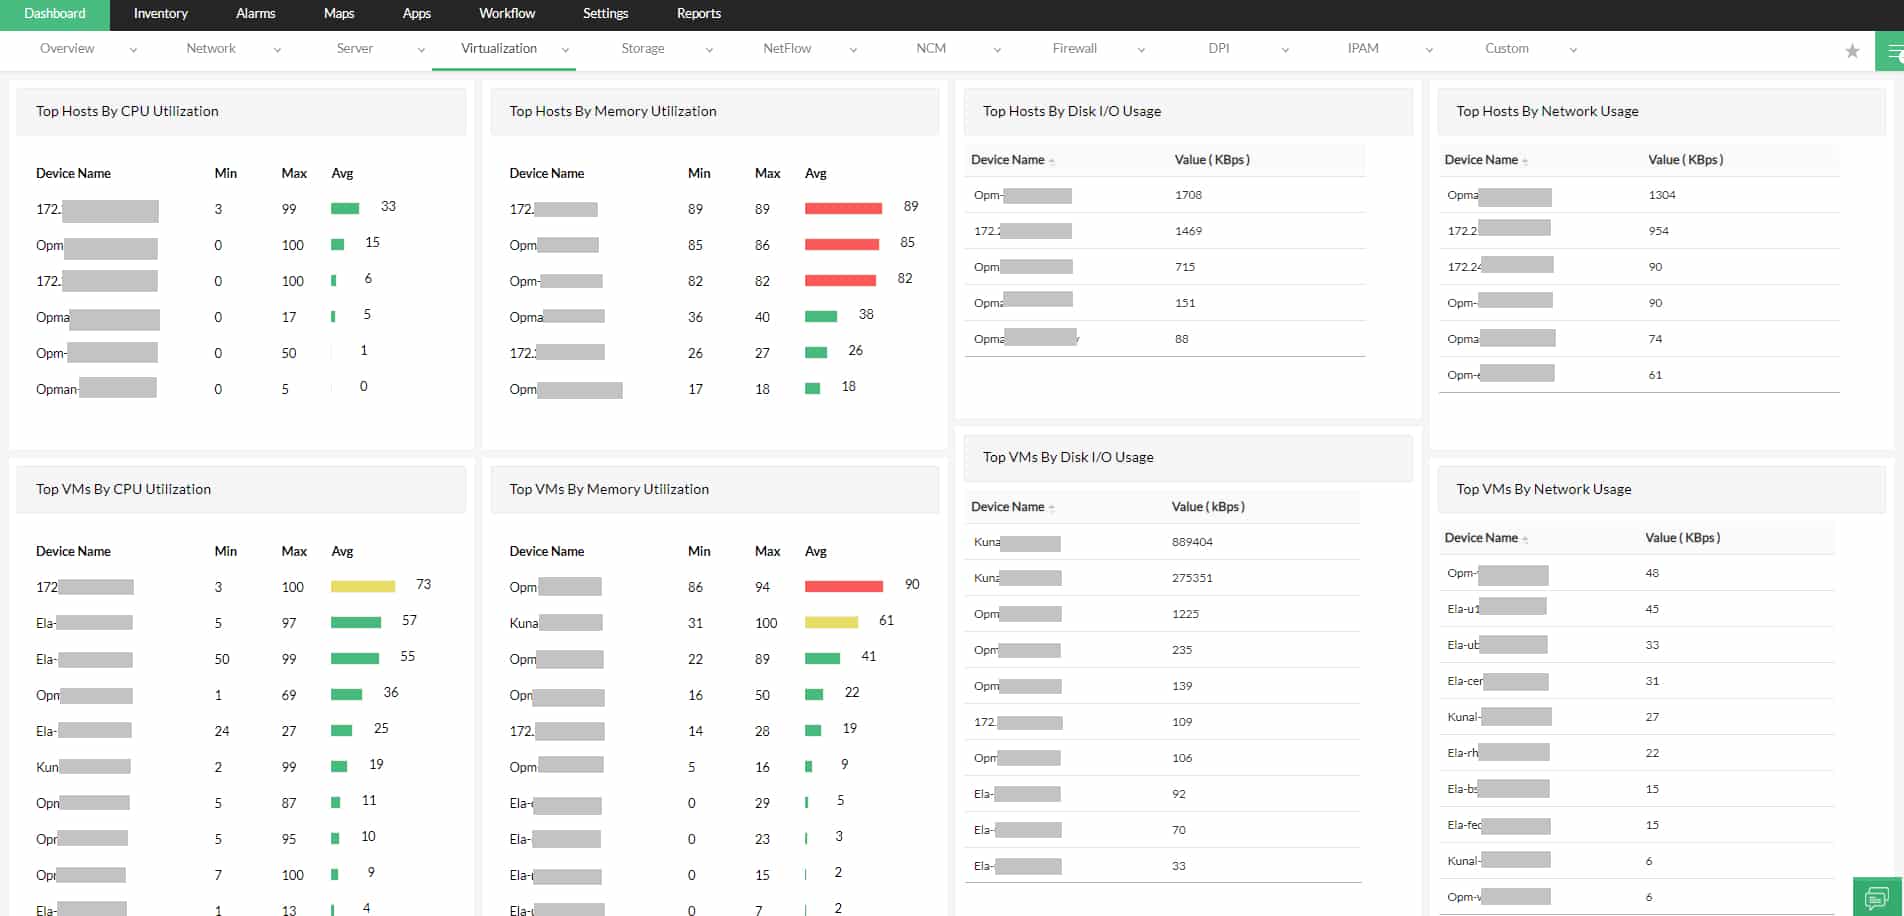
ManageEngine OpManager is a network and server monitor that has the ability to track the performance of virtualization systems. It is able to monitor VMWare vShpere and ESXi, Microsoft Hyper-V, Citrix XenServer, and Nutanix HCI.
Key features
- Performance thresholds on VM resource usage.
- A list of the top 10 VMs for memory usage.
- A live visual representation of all virtual infrastructure.
- Alerts for conditions when virtualization statuses hit problems.
- Tracking of supporting host resources.
- Notifications by email or SMS for system issues.
- Full network monitoring with an autodiscovery feature.
- Network topology mapping.
Why do we recommend it?
ManageEngine OpManager offers a comprehensive suite of monitoring tools that not only caters to virtual environments but also provides a broader network overview. The software’s versatility in monitoring multiple virtual platforms and its historical analysis tool for up to 6 hours sets it apart, ensuring no blind spots in system analysis.
The hypervisor monitor will identify each virtual server. Once you enter access credentials for each, it will then map the entire virtual infrastructure and start to record its performance.
Who is it recommended for?
OpManager is recommended for IT professionals, network managers, and systems administrators who are in charge of diverse virtualization platforms. Those looking for an integrated solution to monitor both their virtual environment and wider network infrastructure, especially across platforms like VMWare, Hyper-V, Citrix, and Nutanix, will find this tool particularly beneficial.
Pros:
- Allows monitoring Hyper-V, Citrix, Kernel-based Virtual Machine as well as VMWare
- Displays live performance data collected from the virtualization for analysis
- Users can check the past 6 hours of activities from the historical analysis tool
- Easy to use, view and monitor performance attributes
- Supports integration with different internal portals and monitoring solutions
Cons:
- Does not have an intuitive GUI
There are three versions in OpManager.
- The Free edition will monitor up to three devices.
- The Standard version can monitor up to 1,000 devices.
- The Enterprise version adds on distributed monitoring for multiple sites.
Contact ManageEngine to get a quote on either of the paid versions.
You can download a 30-day free trial here.
4. Site24x7 VMware Monitoring – FREE TRIAL
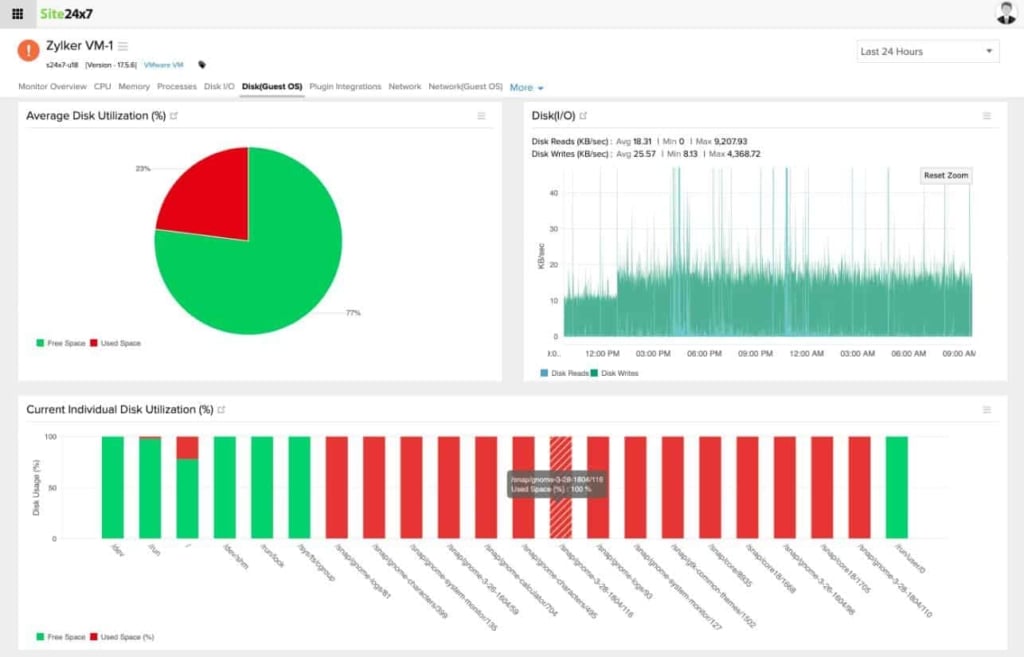
Site24x7 is a cloud-based monitoring service that covers networks, servers, and applications. This monitoring system also has the capability to monitor virtualizations and containers. The Site24x7 system can be extended by “integrations.” These are vendor-specific or resource-specific plugins. There are a number of integrations for virtualization products.
Key features
- A hosted service that includes processing power and storage in with the price of the software.
- No setup fees, deposit requirements or contacts with minimum service periods.
- Mapping of virtual machines to servers for VMWare and Hyper-V virtualizations.
- Monitoring of the Nutanix hyper-converged infrastructure system.
- Server resource monitoring.
- Alerts on performance metrics.
- System capacity exhaustion alerts.
- Problem notifications forwarded to technicians by SMS, email, voice call, or instant messaging post.
- Root cause analysis support.
- Customizable screens in a Web-based dashboard.
Why do we recommend it?
Site24x7 VMware Monitoring provides a holistic approach to infrastructure monitoring, catering to both virtualizations and containers. With its cloud-based architecture, the system eliminates the need for extensive on-premises infrastructure. Its integration capabilities, combined with detailed alert systems and analysis features, make it a robust choice for organizations of various sizes.
Virtualization integrations from Site24x7 include VMWare, Hyper-V, and Nutanix and also a plugin for Docker container monitoring. The Infrastructure system presents performance data related to the internal mappings of VMs to servers, the hypervisor system, and the server resources that support them.
Ste24x7 Infrastructure isn’t limited to monitoring virtualizations, the bundle also includes network monitoring, which tracks the statuses of network devices through SNMP procedures. There is also a traffic monitor included in the system. Application monitoring extends to website performance testing with real user monitoring, synthetic transaction monitoring, and response and uptime monitors.
The services of Site24x7 Infrastructure are charged for by subscription, which can be paid monthly or yearly. Site247 offers a 30-day free trial of the Infrastructure monitor.
Who is it recommended for?
Site24x7 VMware Monitoring is best suited for IT managers, systems administrators, and DevOps teams who require extensive virtual and container monitoring solutions. Organizations with hybrid cloud environments, especially those utilizing VMWare, Hyper-V, Nutanix, Docker, and Kubernetes, will find this tool indispensable for their monitoring needs.
Pros:
- Easy to monitor VMWare virtualizations onsite, as well as Microsoft Hyper-V
- Offers control over containers run by Kubernetes or Docker
- Allows tacking Nutanix hyper-converged infrastructure system
- Sends color-coded alerts to quickly identify problems
- Helps remap VMs to hosts using analysis feature
Cons:
- Users may take time to examine and try out available features
Site24x7 costs $9 per month when paid annually. For more information and access to a 30-day free trial.
5. ManageEngine Applications Manager – FREE TRIAL
ManageEngine Applications Manager includes the capability to monitor virtualizations. Specifically, the tool is designed to monitor VMWare, Hyper-V, Citrix, Red Hat Virtualization, and Kernel-based Virtual Machine.
Although this section of the Applications Manager is called the Virtual Machine Monitor, it covers virtualization servers as well as VMs. The monitor extracts live performance data from the virtualization and displays it in the console of the Applications Manager.
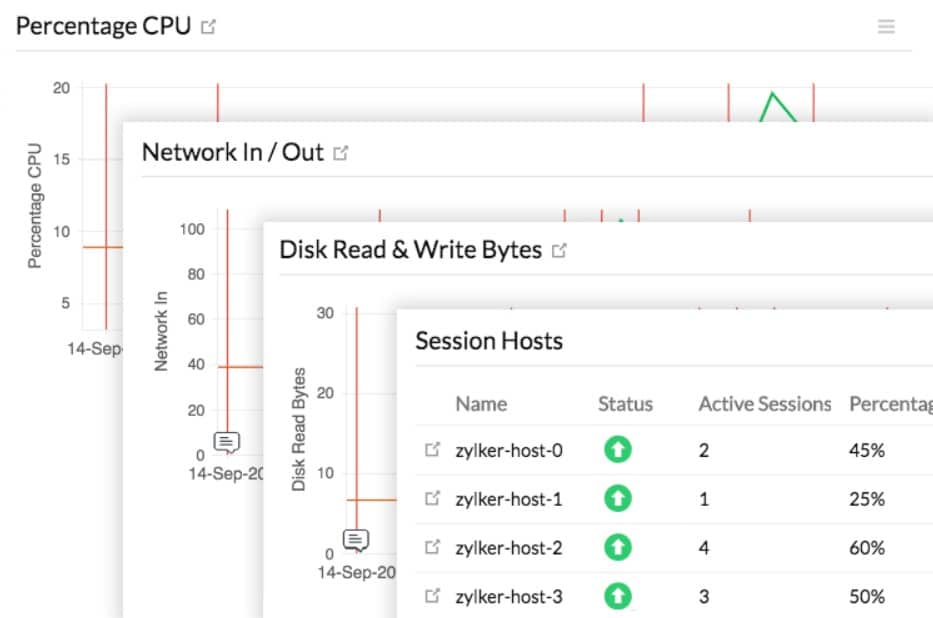
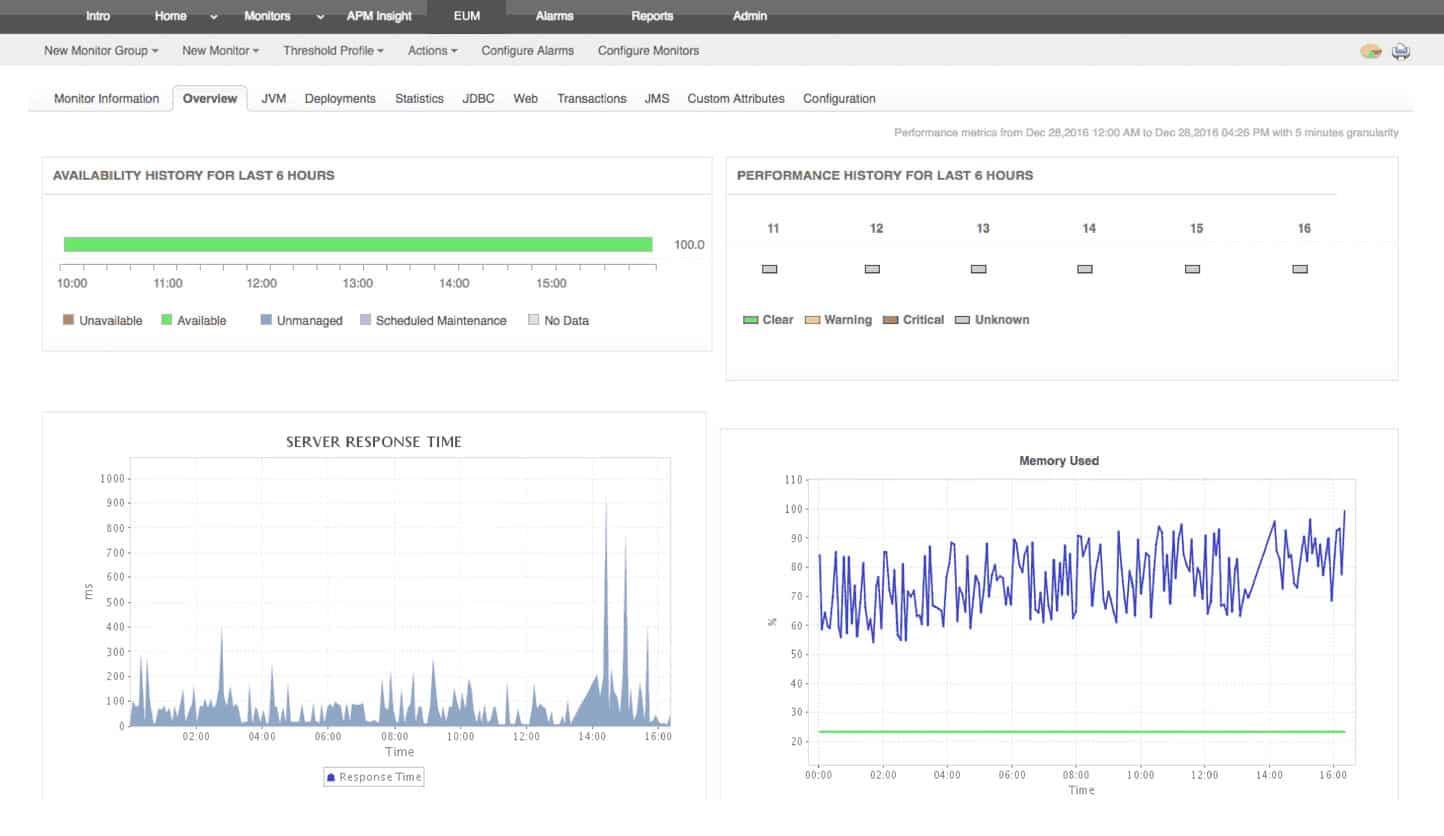
The main categories of information provided by the Virtual Machine Monitor are:
- Availability with a recent history over the past 6 hours.
- Physical server performance with the CPU and memory usage of the virtualization on the physical server.
- Recent disk and network usage, shown as a graph covering the last three hours.
- Drill down memory usage details
- Resource usage per VM showing the highest consumption according to CPU, memory, disk I/O, and network utilization.
Why do we recommend it?
ManageEngine Applications Manager provides a comprehensive insight into virtualizations across a variety of platforms, ensuring real-time performance metrics are easily accessible. Its ability to map and record the entire virtual infrastructure combined with versatile alerting mechanisms ensures businesses can act promptly on potential issues, reducing downtime and performance hitches.
The Applications Manager also provides analysis features for virtualizations that include historical analysis tools, for which, the system stores the performance metrics that it reaps as well as displaying that information live in the console.
There are three editions of the Applications Manager: Free, Professional, and Enterprise. The Free edition is limited to five monitors – remember the Applications Manager doesn’t just monitor virtualizations.
The Professional edition can monitor up to 500 applications, but not all at once. The Enterprise edition allows up to 10,000 monitors, running simultaneously.
ManageEngine offers a 30-day free trial of the Applications Manager.
Who is it recommended for?
ManageEngine Applications Manager is ideal for IT administrators and infrastructure managers in medium to large-scale enterprises who need an in-depth monitoring tool for their virtual environments. It’s especially beneficial for organizations utilizing multiple virtualization platforms like VMWare, Hyper-V, Citrix, and Red Hat, as it offers a unified monitoring solution for all.
Pros:
- Track performance of operating systems, CPU availability, etc
- Allows mapping and recording of the entire virtual infrastructure and its performance
- Provides a real-time visual display of all virtual infrastructure
- Sends email or SMS to notify about system issues
- Tracks supported host resources
Cons:
- Users may take time to master the feature-rich tool
Get in touch with the sales team for a personalized quote.
6. IntelliMagic Vision for SAN
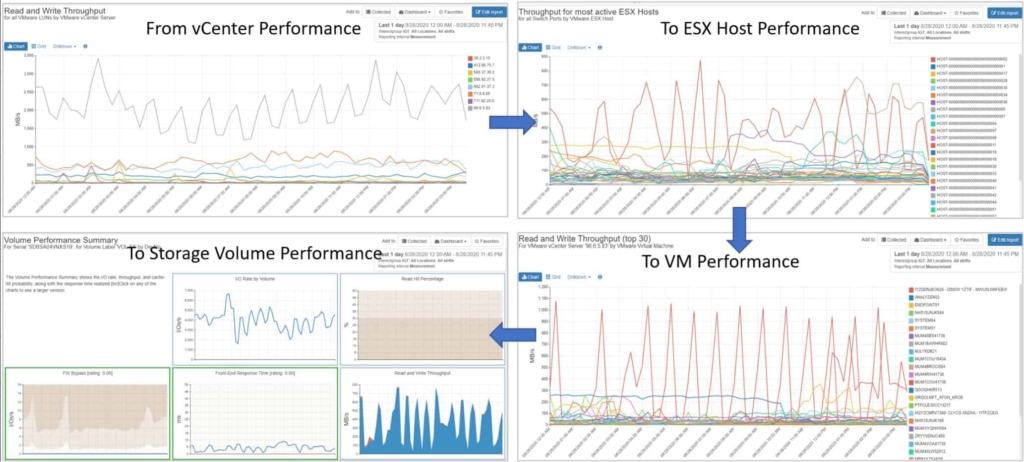
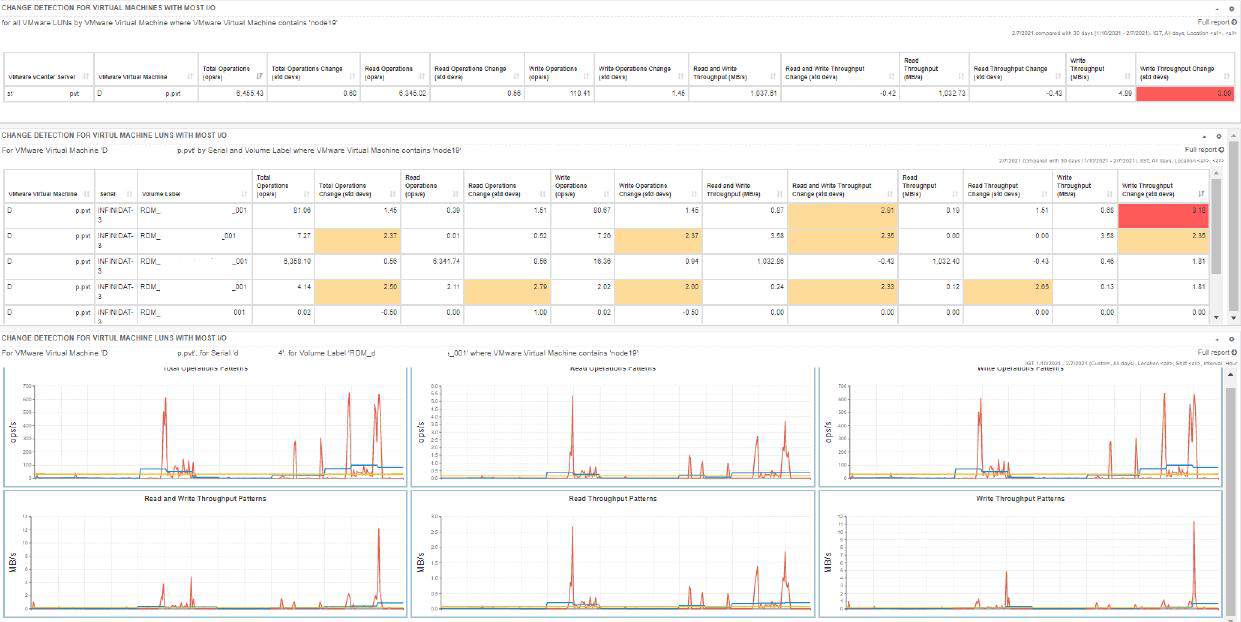
IntelliMagic Vision is adept at tracking the complexities of virtualizations and hyper-converged environments. Its VMWare monitoring solution identifies all VMs and maps them to their virtual hosts. That’s a nice enough service, however, this monitor is able to drill further into virtualized environments, connecting to storage fabrics and tracing the interplay between the VMWare virtualization to the virtualized storage system. This continuity of tracking solves the problems that you might be facing when examining these two environments through separate monitoring systems.
Key features
- Full-stack views of all virtualizations when where they link through to other virtual products from different suppliers.
- Performance monitoring on virtual machines and their hosts, examining resource availability and room for expansion.
- Tracking of VM support even when automation remaps them.
- Seamless crossing over the connections between infrastructure components.
- AI-based resource matching to identify service dependencies.
- Capacity alerts and issue alarms.
- Live monitoring plus historical analysis utilities.
- Links through to storage fabric mapping.
- Troubleshoots virtual and physical network connection problems.
- Options for on-premises or cloud installation.
Why do we recommend it?
IntelliMagic Vision offers a comprehensive solution to monitor and trace virtualizations, ensuring smooth operations in complex and hyper-converged environments. Its ability to seamlessly link VMWare virtualization to virtualized storage systems, coupled with AI-driven configuration analysis, makes it stand out in ensuring optimal configurations and avoiding potential system issues.
As well as identifying the links between virtual resources, the IntelliMagic Vision system is able to examine configuration issues and spot settings that are badly defined and mapping strategies that are just not working. The IntelliMagic system uses AI processes to keep track of automatically adjusted mappings and boundaries and it also puts AI thinking into configuration analysis.
IntelliMagic rides the rails through to storage fabrics built on SAN or NAS designs. The entire virtual system is monitored for load issues and capacity demand. Alerts in the system draw your attention to evolving issues so you can take action before the whole system hits the buffers and users start calling.
The stack examination chains down through virtual dependencies through to the underlying physical resources so you can keep ahead of shortages and clear out space where necessary.
Who is it recommended for?
This tool is ideal for businesses and IT professionals managing complex virtualized environments, especially those with intricate mappings between VMWare virtualizations and storage systems. If there’s a need to stay ahead of configuration challenges and monitor automatic remapping, IntelliMagic Vision provides the right set of features.
Pros:
- Helps monitor virtualization complexities
- Supports detection and mapping of all VMs to their virtual hosts
- Users can set alarms and get notified
- Helps examine configuration issues
- Offers VM support tracking no matter how often automation remaps them
Cons:
- Intervals should be more precise
- Few bugs found in complex calculations
Contact the Sales Department to get a quote. You can request a free demo of IntelliMagic Vision.
7. Datadog Infrastructure
Datadog Infrastructure is a SaaS tool that monitors servers and the applications that provide services to front-end assets. The system identifies app stacks that provide a chain of dependency right down to the operating system of the host. The tool is part of a wider platform of system monitoring utilities.
Key features
- An aggregated overview of all VMs and servers
- Automatic detection of the mappings of VMs to servers and real-world servers
- The capability to monitor cloud hypervisors as well as on-premises implementations
- The ability to combine monitoring for geographically dispersed systems
- A click-through feature that drills down to details views of each VM
- Load balancer monitoring
- Resizing and remapping suggestions
- The identification of abandoned VMs and spare capacity
- Alerts when capacity limits are approached
- Acceptable performance threshold alerts
Why do we recommend it?
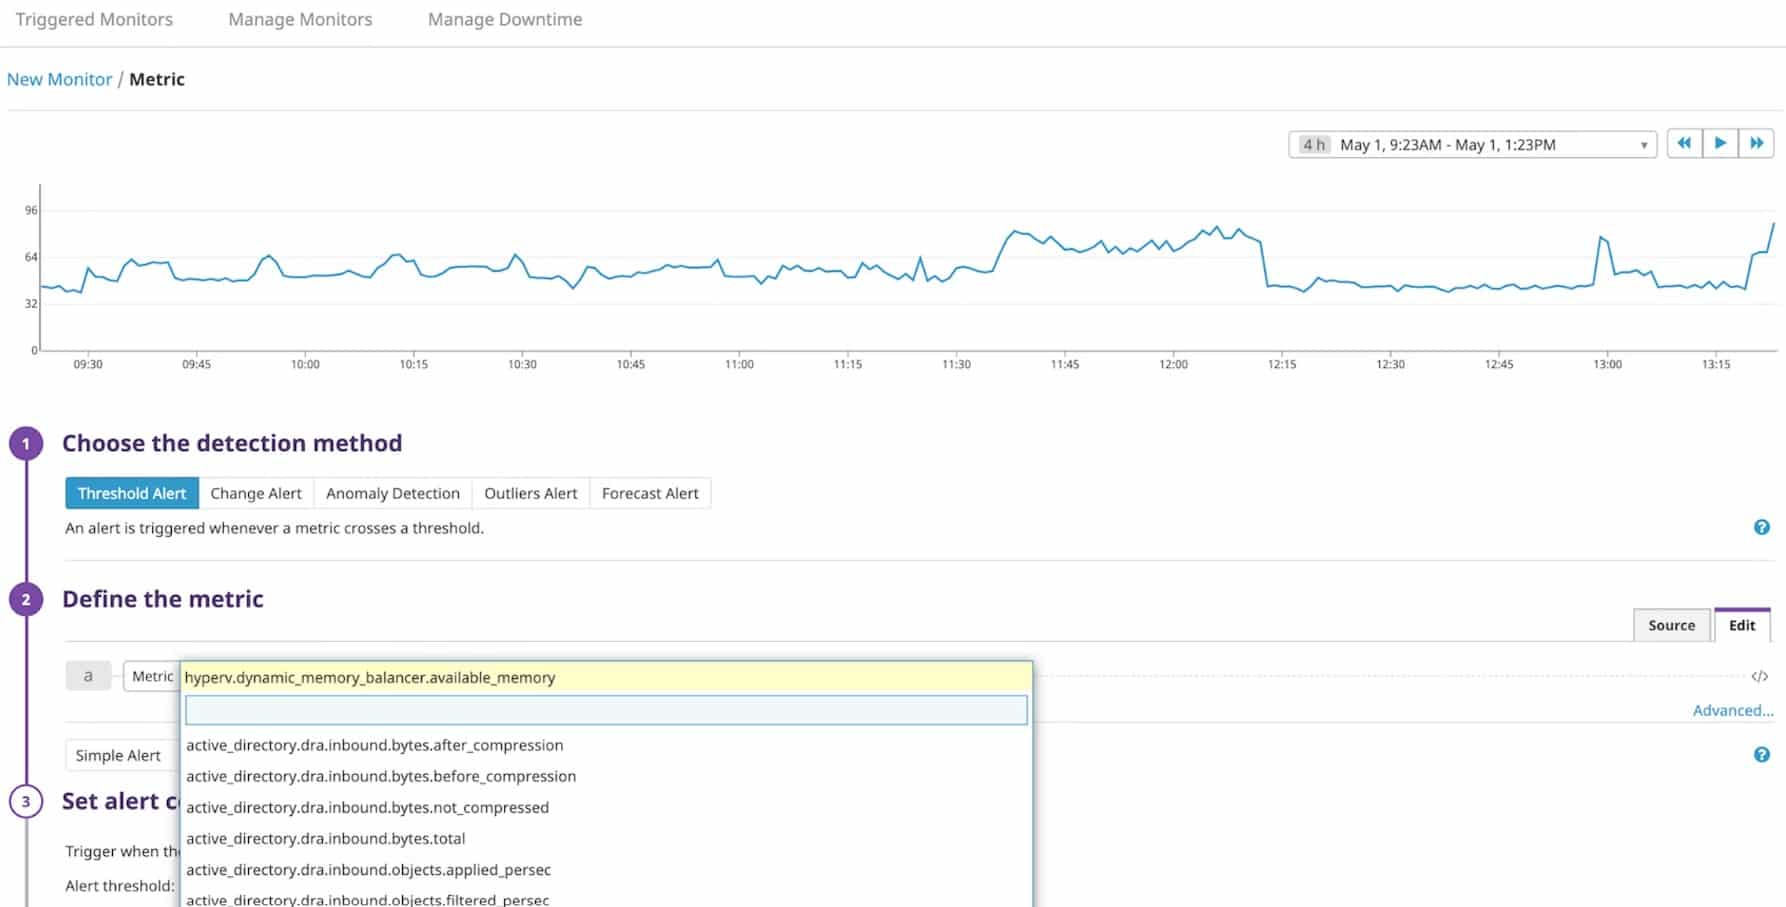
Datadog Infrastructure provides a flexible and holistic approach to system monitoring, making it easier for IT professionals to gain insights into their operations. The integration adaptability allows for precisely monitoring specific environments such as Microsoft Hyper-V and VMWare vSphere.
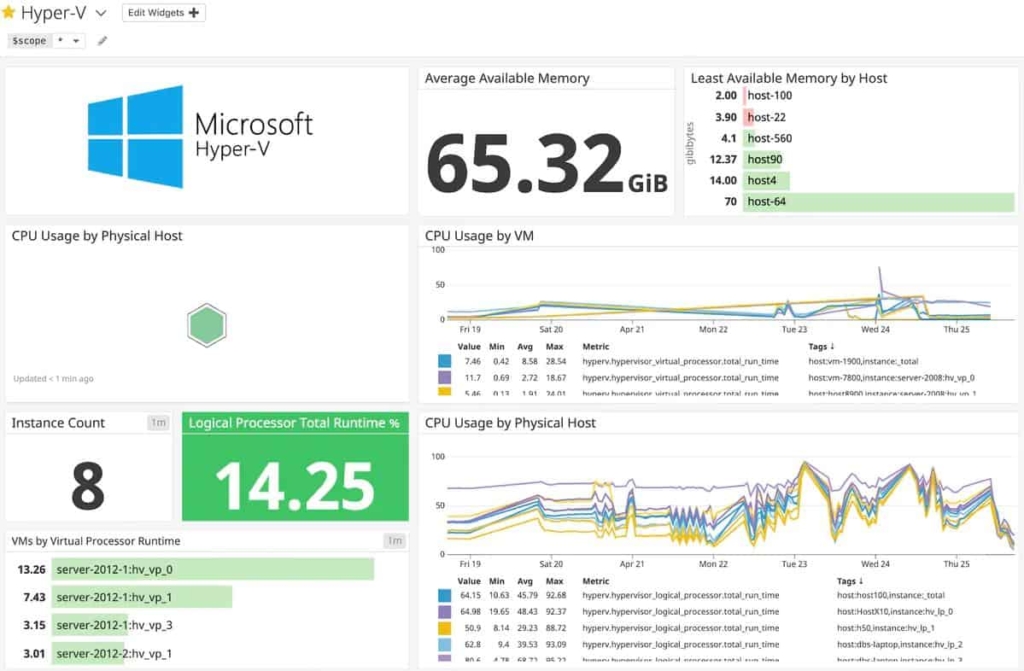
The Datadog strategy provides generalized tools that can be adapted by activating “integrations.” These provide extra services and screens to monitor specific vendor products or system services. There are free integrations available for Microsoft Hyper-V and VMWare vSphere.
Datadog Infrastructure also has extensive container monitoring capabilities. Outside of hypervisors, the tool will give you insights into all of your applications and their inter-dependencies, enabling root cause identification of front-end performance issues.
Datadog Infrastructure is available in three editions: Free, Pro, and Enterprise. All of them are capable of monitoring virtualizations. The Free version is limited to monitoring five servers and its data retention period is just one day. The Pro edition has a longer data retention period of 15 months. That edition and the Enterprise edition are priced per host. The Enterprise edition has extra features, such as AI-based automated performance threshold adjustments.
Who is it recommended for?
Datadog Infrastructure is suitable for businesses of all sizes due to its scalable offering in different editions. Whether you’re a small company with a few servers or a large enterprise with complex, geographically dispersed systems, Datadog can accommodate your needs.
Pros:
- Offers free integrations for VMWare vSphere and Hyper-V
- Automated mappings between virtual machines (VMs) and physical servers
- Notifies when maximum capacity is reached
- Allows tracking on-premises as well as cloud hypervisors implementations
- Helps detect the underlying causes of front-end performance problems
Cons:
- Navigating new areas can be confusing
- Lacks documentation in some places
Price:
- Free $0
- Pro $15 per host per month
- Enterprise $23 per host per month
Official Download: For more information and access to a 14-day free trial.
8. SolarWinds Virtualization Manager
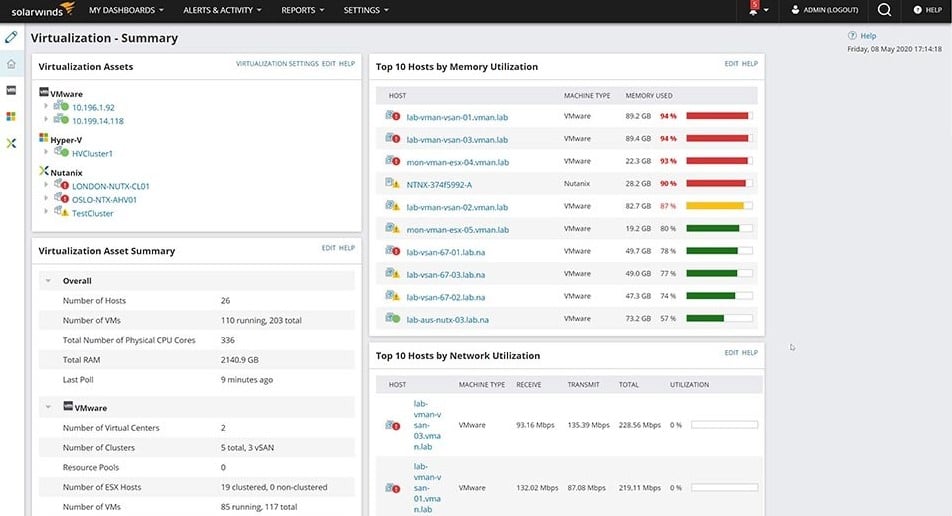
SolarWinds Virtualization Manager is an on-premises system that can monitor virtualizations on site, on the cloud, or both. It is specifically designed to track the performance of VMware vSphere, Microsoft Hyper-V, and Nutanix AHV.
Key features
- Tracking of VM to host mapping
- Virtual system problem management
- Physical server and network interface monitoring
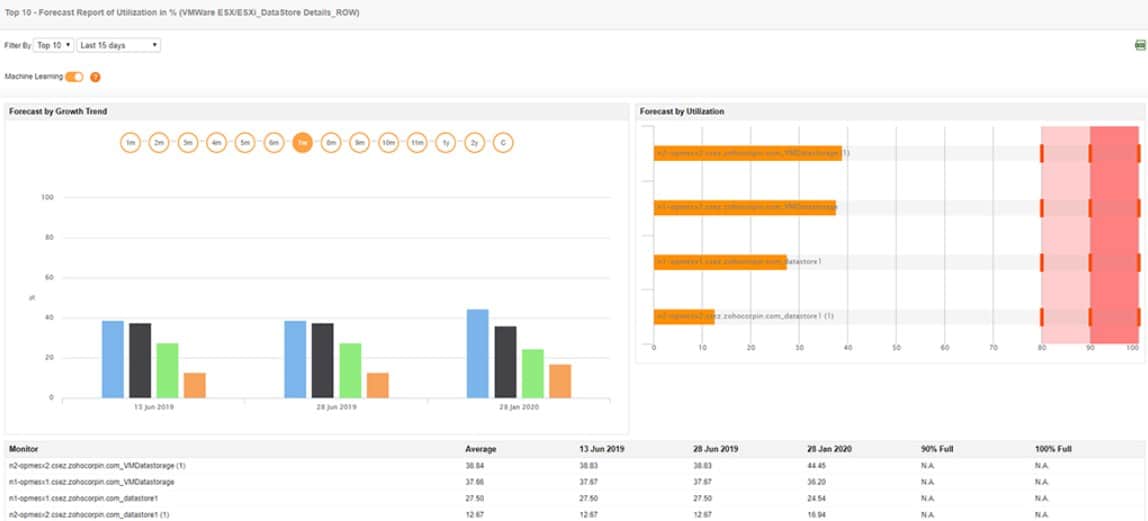
- Capacity planning with predictive resource requirements recommendations
- VM sprawl management
- Chargeback reporting
Why do we recommend it?
SolarWinds Virtualization Manager provides comprehensive monitoring for virtual environments, offering detailed performance metrics and efficient problem management. Its integration capabilities with popular platforms like Azure and Amazon EC2 set it apart, ensuring a holistic approach to virtual system monitoring.
Who is it recommended for?
This tool is ideally suited for IT administrators and network professionals managing medium to large-scale virtual environments. Specifically, those leveraging platforms like VMware vSphere, Microsoft Hyper-V, and Nutanix AHV, and seeking a unified solution for on-premises and cloud virtualizations will benefit immensely from it.
Pros:
- In-depth monitoring of the environment of virtual devices
- The dashboard displays detailed performance metrics as well as live performance line graphs
- Sends color-coded alerts for better understanding
- Allows monitoring of multiple hosts and VM resources
- Supports integration with Azure and Amazon EC2
Cons:
- Not an ideal option for home users and small businesses
The Virtualization Manager runs continuously and it provides live metrics in the console for the system and also raises alerts for resource shortages. The software package runs on Windows Server and you can get a free trial.
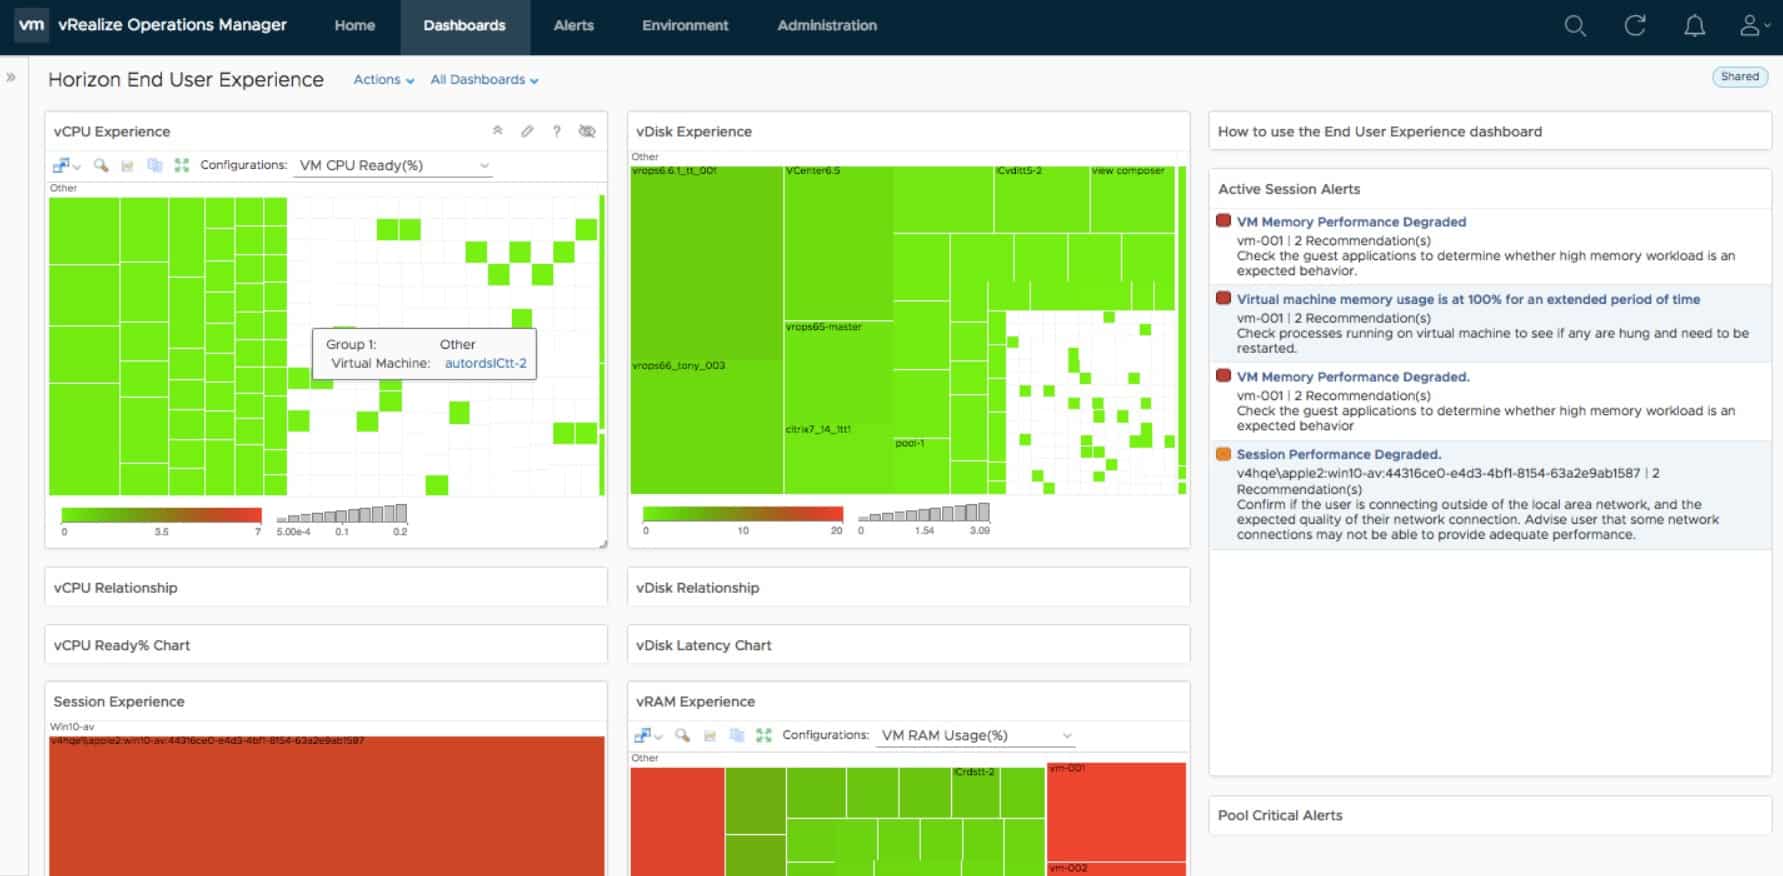
9. vRealize Operations Manager (vROps)
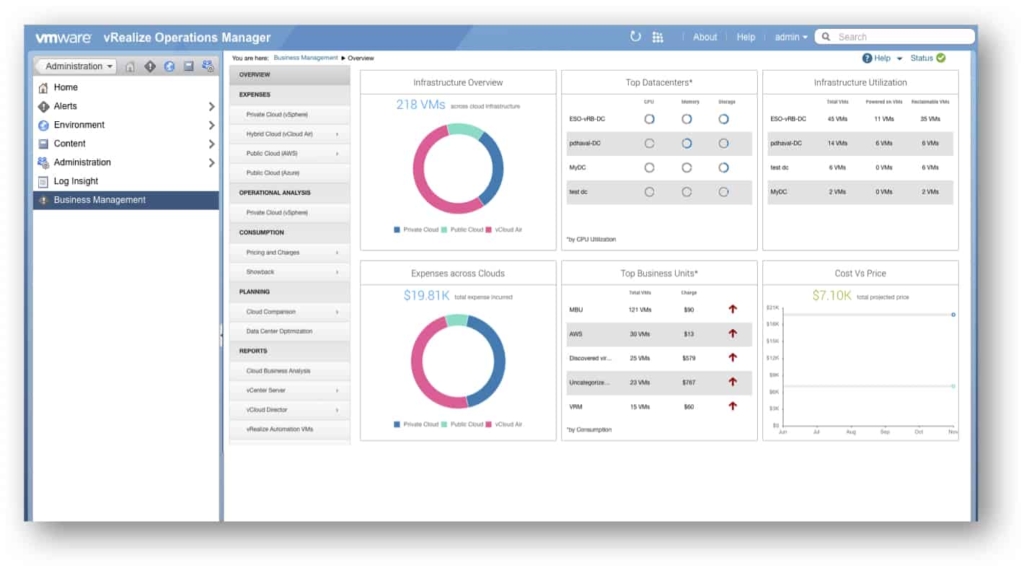
vRealize Operations Manager (vROps) monitors VMware devices to improve application performance, enhance efficiency and minimize disruptions. It provides insights into virtual devices using data collected from system resources.
Key features
- Helps to run hassle-free production operations
- Delivers continuous performance optimization
- Improves the efficiency of capacity management
- Offers deep insights to plan proactively
- Supports the planning, optimization and deployment of SDDC and multi-loud deployments
- Provides application-to-storage visibility across all physical, virtual and even cloud infrastructures.
- Comes with rich analytical tools to identify hidden issues and to find solutions to complex technical problems.
- Helps to identify the health of any single virtual object
Why do we recommend it?
vRealize Operations Manager (vROps) not only proactively monitors virtual networks but also identifies issues often before they impact the customer. Furthermore, it suggests corrective measures immediately, ensuring timely resolution of problems.
As a result, it is easy to identify issues, even before a customer notices a problem. Along with identifying the issue, vROps also suggests corrective action, so the problem can be fixed right away.
Besides such proactive monitoring of virtual networks, vROps also comes with many other useful features.
vROps comes in three versions – standard, advanced and enterprise.
Features |
Standard |
Advanced |
Enterprise |
| Standalone | Per operating system instance (OSI) | Per operating system instance (OSI) or per processor (CPU) | Per operating system instance (OSI) |
| Suite availability | VMware vSphere with operations management | VMware vRealize Suite and vCloud suite standard, advanced. | VMware vRealize Suite and vCloud suite standard, enterprise. |
| Scale out operations platform | Yes | Yes | Yes |
| Single sign-on | Yes | Yes | Yes |
| Remote collectors | Yes | Yes | Yes |
| Visualization options like reports, graphs and charts | Yes | Yes | Yes |
| Policy management | Yes | Yes | Yes |
| vSphere security and compliance | Yes | Yes | Yes |
| Real-time predictive capacity | Yes | Yes | Yes |
| Data center cost views | Yes | Yes | Yes |
| Support for private cloud and VMware Cloud on AWS | Yes | Yes | Yes |
| DRS management | Yes | Yes | Yes |
| Guided remediation | Yes | Yes | Yes |
| Log insights | Yes | Yes | Yes |
| vSAN overview and migration | Yes | Yes | Yes |
| Wavefront integration | Yes | Yes | Yes |
| Automated failover of platform nodes | No | Yes | Yes |
| Customizable dashboards and reports | No | Yes | Yes |
| Super metrics | No | Yes | Yes |
| Automated and schedulable workload balancing | No | Yes | Yes |
| Automated actions | No | Yes | Yes |
| vSAN troubleshooting and capacity management | No | Yes | Yes |
| SDDC health management pack | No | Yes | Yes |
| vRealize Orchestrator management pack | No | Yes | Yes |
| Multi-cloud monitoring management pack | No | Yes | Yes |
| Care system analytics management pack | No | No | Yes
|
| Application, middleware and database monitoring | No | No | Yes |
Pricing is based on the number of processors for standard and advanced editions, and per virtual machine for standard, advanced and enterprise editions.
Who is it recommended for?
vROps is ideal for businesses and IT professionals who rely on VMware devices. It’s beneficial for those seeking continuous performance optimization, in-depth insights for proactive planning, and those who need a holistic view from application to storage across various infrastructures, including physical, virtual, and cloud environments.
Pros:
- Collects data from system resources and generates insights into virtual devices
- Quickly identifies issues and suggests corrective measures
- Determines the health status of each virtual object
- Provides ongoing performance improvement
- Supports SDDC and multi-cloud deployments
Cons:
- Policy objects can be a little challenging
- Only a few metrics are available for virtual machine adapters
Get in touch with the sales team for a personalized quote.
10. Veeam ONE
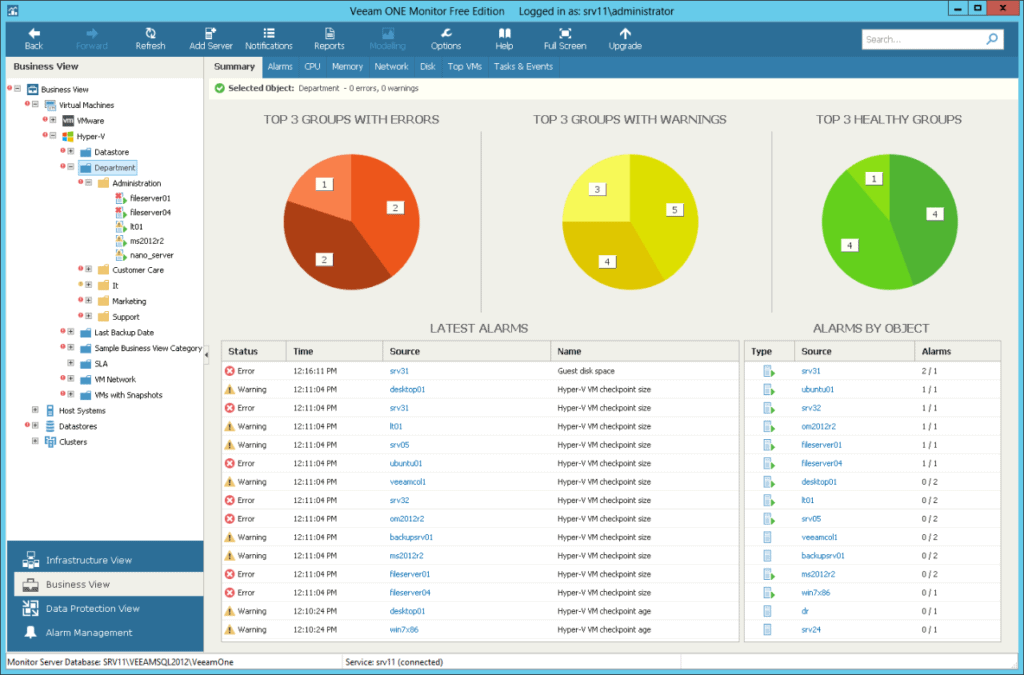
Veeam ONE is a good choice for both vSphere and Hyper-V. This tool also integrates well with other Veeam tools such as Veeam Backup & Replication to provide more advanced capabilities in physical and virtual environments.
Key features
- Continuously monitors virtual, physical and cloud-based environments in real-time
- Notifies users of availability and performance issues to avoid losses due to downtime.
- Meets the compliance standards for virtualization monitoring and management
- Evaluates the performance of infrastructure and makes appropriate recommendations
- Suggests configuration changes for best practices and for optimal utilization of resources
- Forecasts resource usage and utilization using “what if” modeling
- Comes with a real-time dashboard that has one-click and drill-down views.
- Isolates the root cause quickly to resolve issues
- Supports vCenter, vSphere, ESX, ESXi and Hyper-V
- Allows users to define configuration parameters, performance metrics and filters.
- Gives access to raw performance data and custom infrastructure reports
- Comes with a custom report builder that can pull data from any field in any report into a single document.
- Displays infrastructure performance and trends
Why do we recommend it?
Veeam ONE offers comprehensive monitoring capabilities across virtual, physical, and cloud environments, while seamlessly integrating with other Veeam tools. Its real-time monitoring and instant notifications ensure minimal downtime, and its robust analysis tools recommend optimal configurations, boosting the overall efficiency of the infrastructure.
Veeam ONE comes in two versions – free and enterprise. The free version can be downloaded here.
The enterprise version has more advanced monitoring capabilities when compared to the free version. Some of the additional features available in the enterprise version include:
- Assessment and reporting to determine if the installation of Veeam Backup & Replication meets best practices.
- Performance monitoring and alerting for Veeam Backup & Replication jobs
- Collection of all events recorded in Windows event log
- Creation of custom alarms to meet the unique needs of any virtual environment
- Capacity planning for Hyper-V and vSphere
- Chargeback capabilities for host resource usage, hardware, VM configuration and VM performance
- Multi-tenant reporting and monitoring
- Agent monitoring and reporting
- Automated report generation and delivery
- Customized report builder
- Predefined dashboard for backup
This version costs $900 per socket and comes with a 30-day free trial.
Who is it recommended for?
Veeam ONE is perfect for businesses and IT teams utilizing both vSphere and Hyper-V platforms. It’s especially beneficial for those who prioritize compliance, need in-depth analytics, forecasting, and seek efficient resource management in their infrastructures.
Pros:
- Strong system backup and recovery
- Real-time monitoring and alert
- Offers access to raw data
- Apart from customization options, it offers access to 200+ preconfigured sensors
- Complies with regulatory requirements for virtualization monitoring and administration
Cons:
- Outdated interface
- It might be cumbersome when maintaining multiple virtual machines
Starts at $900 per Socket
Conclusion
To conclude, Virtualization Manager Software is essential to have a complete control over any virtual environment.
This tool helps to plan and understand capacity utilization and at the same time, helps to prevent a virtualization sprawl. It also offers advanced monitoring options, elaborate reporting and more.
We recommend downloading a Trial/Free version of the tool that has the features you are looking for and get started on monitoring Virtual machines in your Environment – You’d be surprised at the insights that many of these tools provide right out of the box!
