
The emergence of different data types and formats has brought up problems related to storage, interoperability, and compatibility. In turn, this led to the development of document databases that allowed users to handle data through schema validation.
One such well-known database is MongoDB that created a new format called the Binary JSON format (BSON) and data stored in this format can be quickly indexed and searched, thereby increasing the overall efficiency of storage and retrieval.
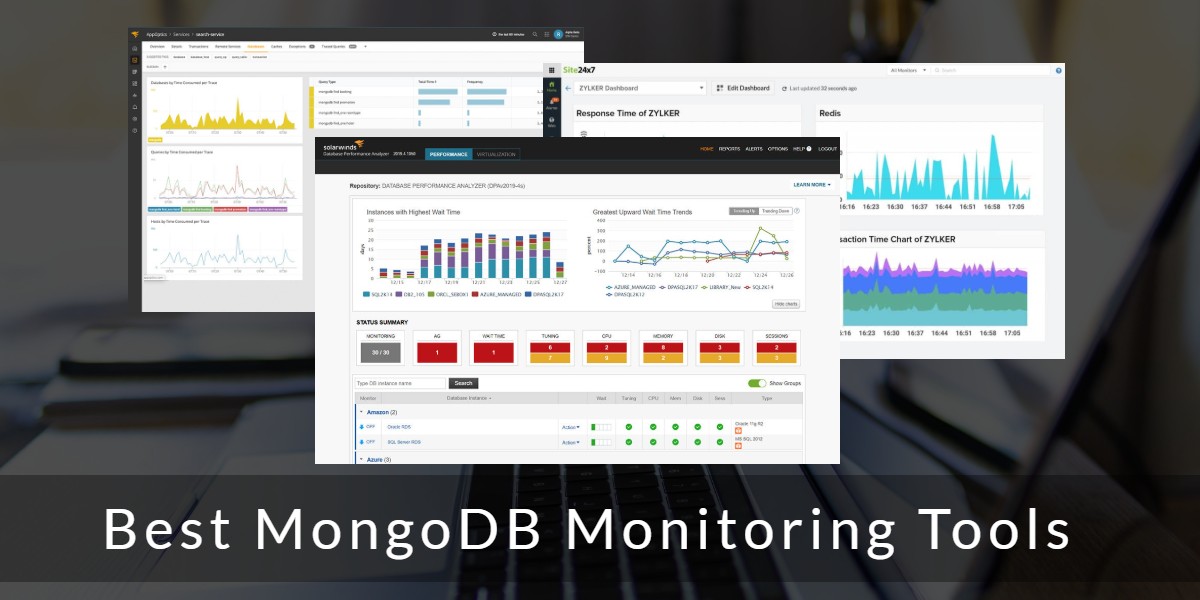
Here is our list of the Best MongoDB monitoring tools:
- ManageEngine Applications Manager – FREE TRIAL A comprehensive tool that monitors MongoDB databases and provides all the information you need to evaluate its performance. Get a 30-day free trial.
- Site24x7 – FREE TRIAL A comprehensive monitoring tool that comes with the capabilities to monitor a wide range of databases and systems, including MongoDB. Start a 30-day free trial.
- Datadog This robust monitoring system aggregates and visualizes the metrics from your MongoDB and even combines it with other parts of your IT infrastructure to give a streamlined view.
- SolarWinds Database Performance Monitor Monitors the health of many databases including MongoDB. It is designed to ensure performance and optimization, as it comes with advanced analytics to understand the root cause of problems and even provides expert tuning advice to fix them.
- MetricFire An infrastructure and application monitoring platform that displays all the information you need in a visually appealing way, and this helps to give you real-time insights and visibility.
- Foglight for MongoDB A centralized management tool for MongoDB databases that continuously monitors the health and performance of your MongoDB databases and sends alerts and notifications when needed.
Due to its popularity, MongoDB has become an essential part of organizations’ IT systems and environments, hence it becomes necessary to ensure that its performance and efficiency are at optimal levels at all times. Some of the aspects that must be monitored at all times to ensure optimal performance are:
- Throughput
- Latency in reading/write operations
- Resource utilization and saturation
- Errors
- Replication lags
- Number of database connections
- CPU usage
- Execution time
- Operation counts and memory
- Abnormal changes and possible overloads
This leads to the role of MongoDB monitoring tools and thankfully, you have a lot of choices today. Let’s look at some of them in this article.
Our methodology for selecting the Best MongoDB Monitoring Tools:
We’ve broken down our analysis for you based on these key criteria:
- Comprehensive monitoring capabilities that cover all essential aspects of MongoDB.
- User-friendly interface with customization options for different user needs.
- Advanced analytics and diagnostics to pinpoint and resolve issues effectively.
- Proactive alerting and reporting features for timely problem resolution.
- Integration with other systems and support for collaboration among teams.
The Best MongoDB Monitoring Tools
1. ManageEngine Applications Manager – FREE TRIAL
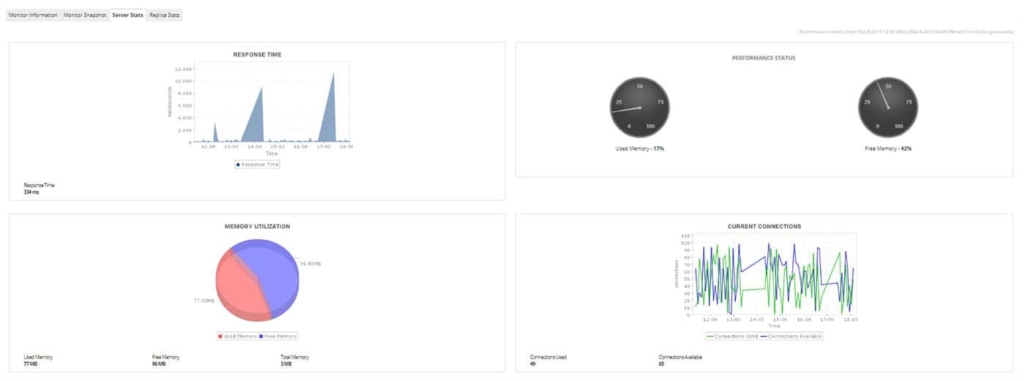
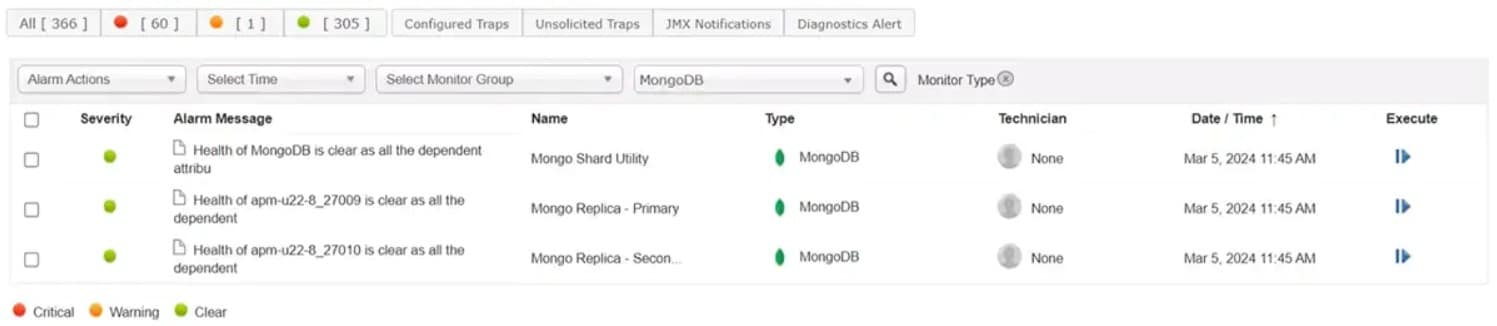
ManageEngine Applications Manager is a comprehensive tool that can monitor most common applications, databases, servers, and other components in your IT infrastructure. It also monitors MongoDB databases and provides all the information you need to evaluate its performance.
Key Features:
- Gives comprehensive usage metrics, so you can handle load distribution and capacity planning accordingly
- Offers deep visibility into the important metrics of MongoDB
- Provides a thorough understanding of performance efficiency
- Comes with intelligent analytical features for analyzing the performance trends
- Helps with forecasting utilization trends
- Identifies bottlenecks and troubleshoots them at the earliest
- Monitors lock stats such as read/write locks to prevent latency problems
- Provides database operations statistics with sharding and replication details
- Helps to resolve performance issues quickly
- Evaluates the performance and trends of MongoDB usage
- Comes with comprehensive reports that provide all the information you need
- Uses advanced machine learning techniques to help with capacity planning
- Supports all MongoDB versions up to 4.0.2
Why do we recommend it?
After installing and navigating through the 30-day free trial of the ManageEngine Applications Manager, we conducted a thorough assessment of its features. The tool offers an impressive range of metrics, aiding in effective load distribution and capacity planning.
Who is it recommended for?
ManageEngine Applications Manager is tailor-made for IT professionals and database administrators who require a holistic view of their IT infrastructure, including MongoDB databases. It’s especially beneficial for those aiming to achieve efficient load distribution and anticipate utilization trends. Organizations looking to pinpoint and resolve performance bottlenecks swiftly will find this tool indispensable.
Pros:
- Comprehensive usage metrics for effective load distribution.
- Intelligent analytics for performance trend analysis.
- Advanced machine learning for capacity planning.
Cons:
- The interface might be complex for users new to database monitoring.
Pricing: ManageEngine offers a custom quote based on your specific requirements, so reach out to the sales team with your requirements.
Download: Register here for a 30-day free trial.
2. Site24x7 – FREE TRIAL
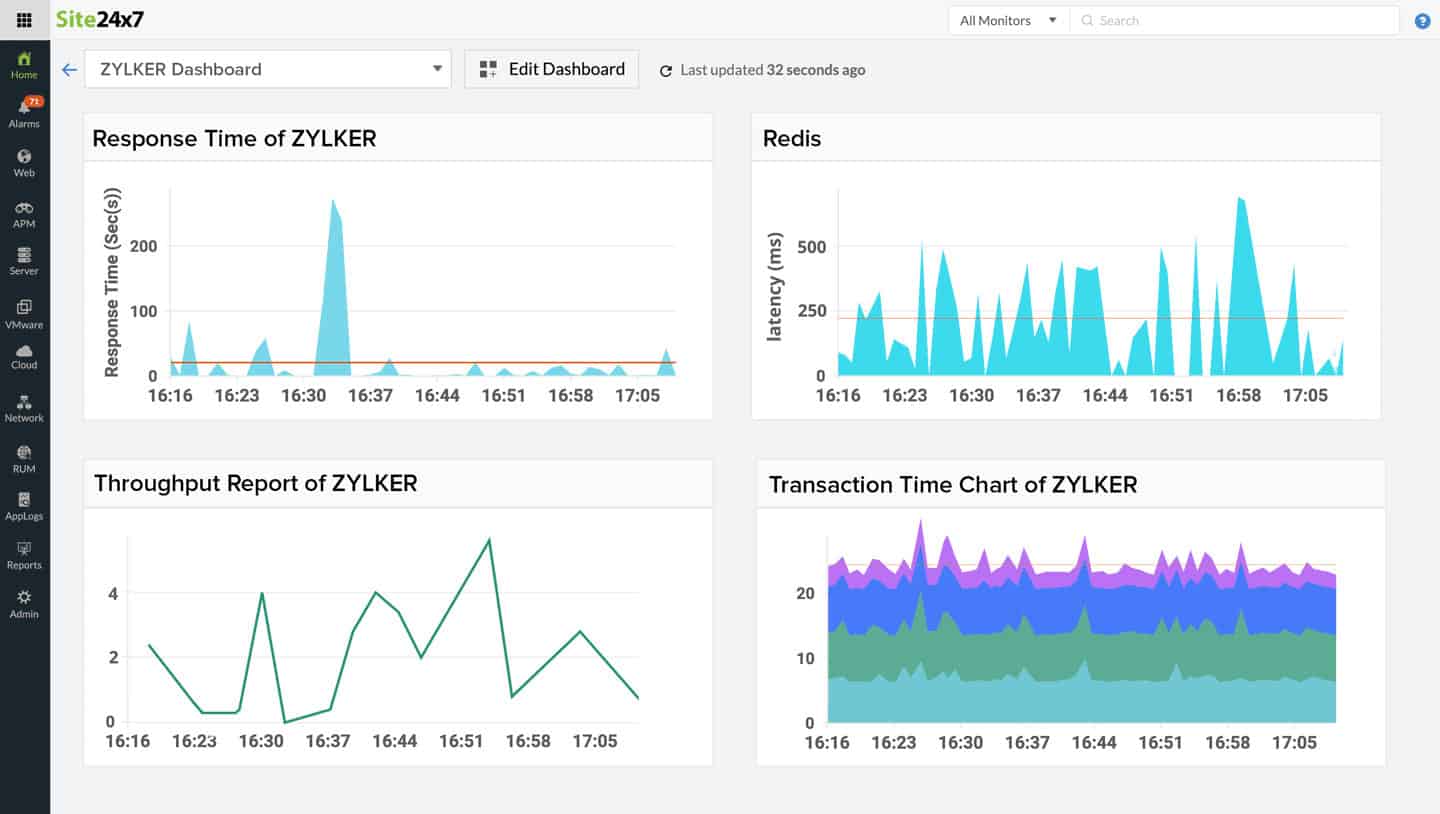
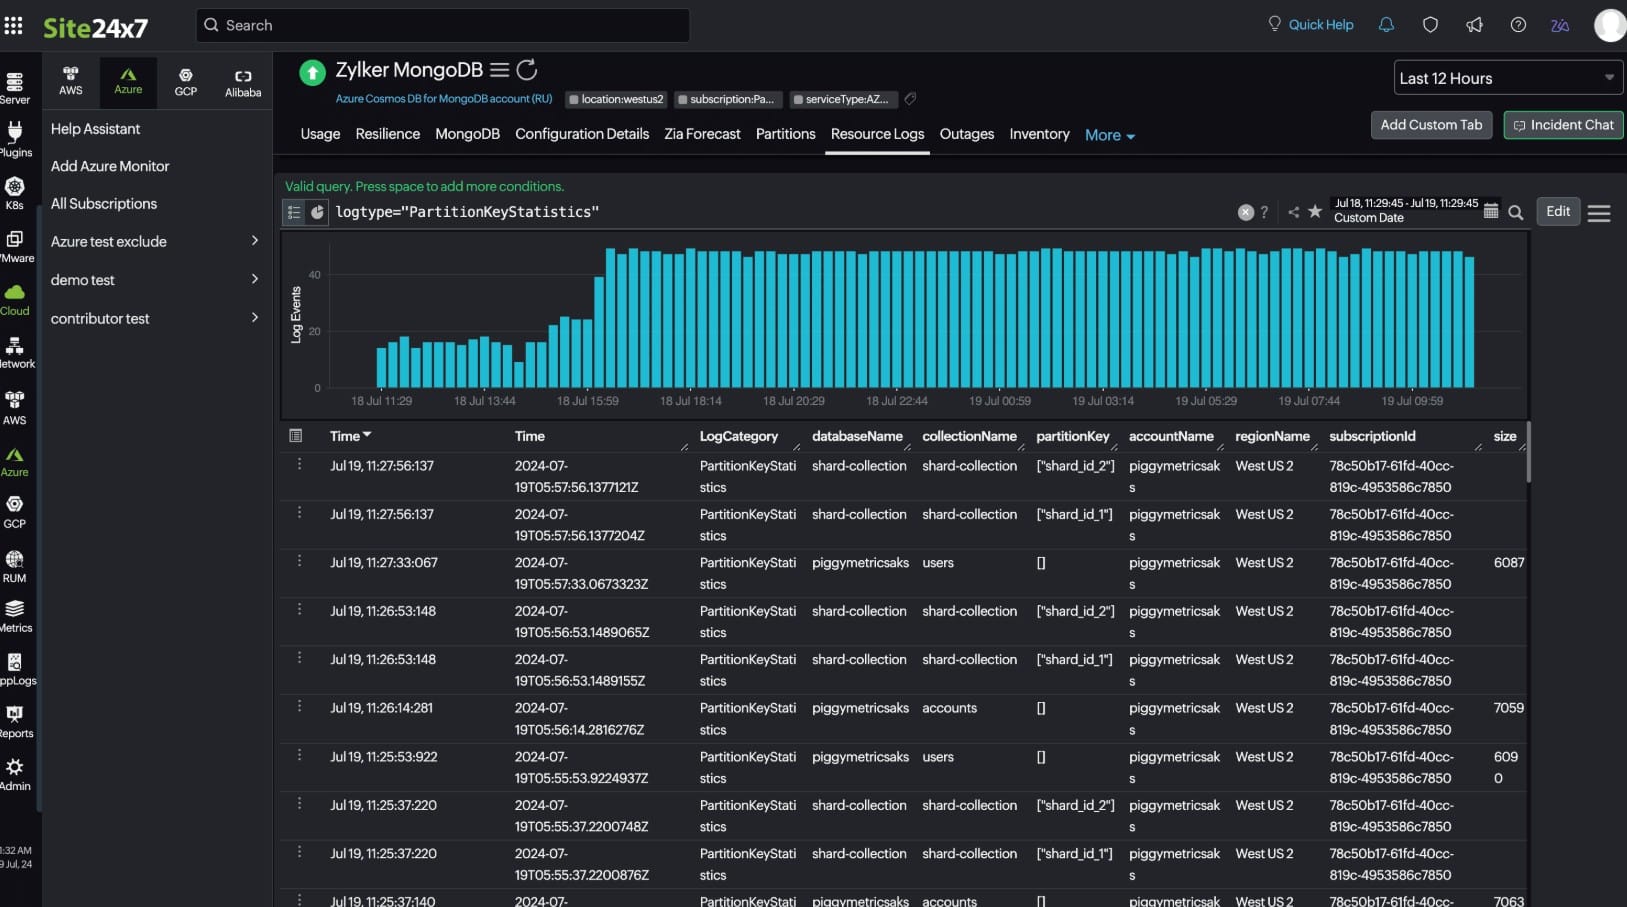
Site24x7 is a comprehensive monitoring tool that comes with the capabilities to monitor a wide range of databases and systems, including MongoDB. This monitoring of MongoDB is handled by its ready-to-install plugin that provides in-depth visibility into the performance, availability, and usage of the MongoDB databases.
Key Features:
- Counts and records the number of unused connections to help you decide on resource utilization and capacity planning
- Provides real-time monitoring
- Supports the use of custom plugins to monitor your database
- Provides detailed visibility into the performance metrics of your MongoDB databases
- Integrates well with Site24X7 data center to give you a comprehensive view of your infrastructure’s health and performance.
- Displays various charts to give you a quick update on performance, and you can also further drill down to get detailed insights
- Pinpoints performance issues, so you can fix them right away
- Alerts can be customized to meet your requirements
Why do we recommend it?
Upon downloading the 30-day free trial of Site24x7, we dove into its MongoDB monitoring capabilities. We found the tool’s ability to count and record unused connections particularly valuable for resource utilization and capacity planning decisions. Its integration with the Site24x7 data center provided a holistic view of our infrastructure’s performance.
Who is it recommended for?
Site24x7 MongoDB Monitoring is a top pick for IT professionals and database administrators who need a wide-ranging monitoring solution for their databases, including MongoDB. Organizations that prioritize real-time monitoring and desire the flexibility to use custom plugins will find Site24x7 invaluable. Its detailed performance metrics and drill-down capabilities make it an excellent choice for those wanting in-depth insights.
Pros:
- Plugin support for in-depth performance insights.
- Integrates with Site24X7 data center for a comprehensive view.
- Detailed performance charts for quick updates and analysis.
Cons:
- Additional costs for plugins and add-ons can add up.
Pricing: The Starter plan starts at $9/month, paid annually, and additional plugins cost extra. Depending on your needs, the add-ons can range anywhere from $15/month for basic monitoring of 10 servers to $2,000/month for 1000 NetFlow interfaces. So, the cost depends on the number of add-ons and devices.
Download: Start with a 30-day free trial.
3. Datadog
Datadog’s MongoDB monitoring capabilities help you stay on top of the health and performance of your MongoDB database. This robust monitoring system aggregates and visualizes the metrics from your MongoDB and even combines it with other parts of your IT infrastructure to give a streamlined view.
Key Features:
- Since MongoDB monitoring comes with the Datadog Agent package, no separate installation is required
- Provides complete visibility into the performance of your MongoDB database
- Comes with advanced alerting mechanisms that help you stay on top of anomalies
- Combines real-time data with historical one to give in-depth insights into the performance of your database
- Provides many advanced monitoring capabilities such as dynamic slicing and aggregation
- You can set up custom alerts to meet your preferences
- Integrates well with many popular tools such as Slack and PagerDuty, so you can use them to send notifications to specific teams or individuals
- The dashboard is highly intuitive and can be customized to meet your preferences
Why do we recommend it?
After integrating Datadog into our test environment, we appreciated its seamless setup, given that MongoDB monitoring comes pre-packaged with the Datadog Agent. The tool’s ability to combine real-time data with historical metrics stood out, offering a comprehensive view of database performance.
Who is it recommended for?
Datadog is tailor-made for IT professionals and database administrators seeking an all-encompassing solution to monitor MongoDB alongside other IT infrastructure components. Its robust alerting mechanisms and integrations with tools like Slack and PagerDuty make it ideal for teams that prioritize real-time notifications and insights.
Pros:
- Complete visibility into MongoDB performance.
- Advanced alerting mechanisms for proactive monitoring.
- Integrates with popular tools for enhanced functionality.
Cons:
- Pricing can escalate for larger infrastructures.
- May require technical know-how for advanced features.
Pricing: Datadog offers three pricing tiers and they are:
- Free – Retains metrics for a day and supports up to five hosts
- Pro ($15 per host per month) – 400+ integrations, out-of-the-box dashboards, and retains metrics for up to 15 months
- Enterprise ($23 per host per month) – Provides alerts based on machine learning, detects anomalies automatically, and has other advanced features
Download: Click here to get started with the free plan.
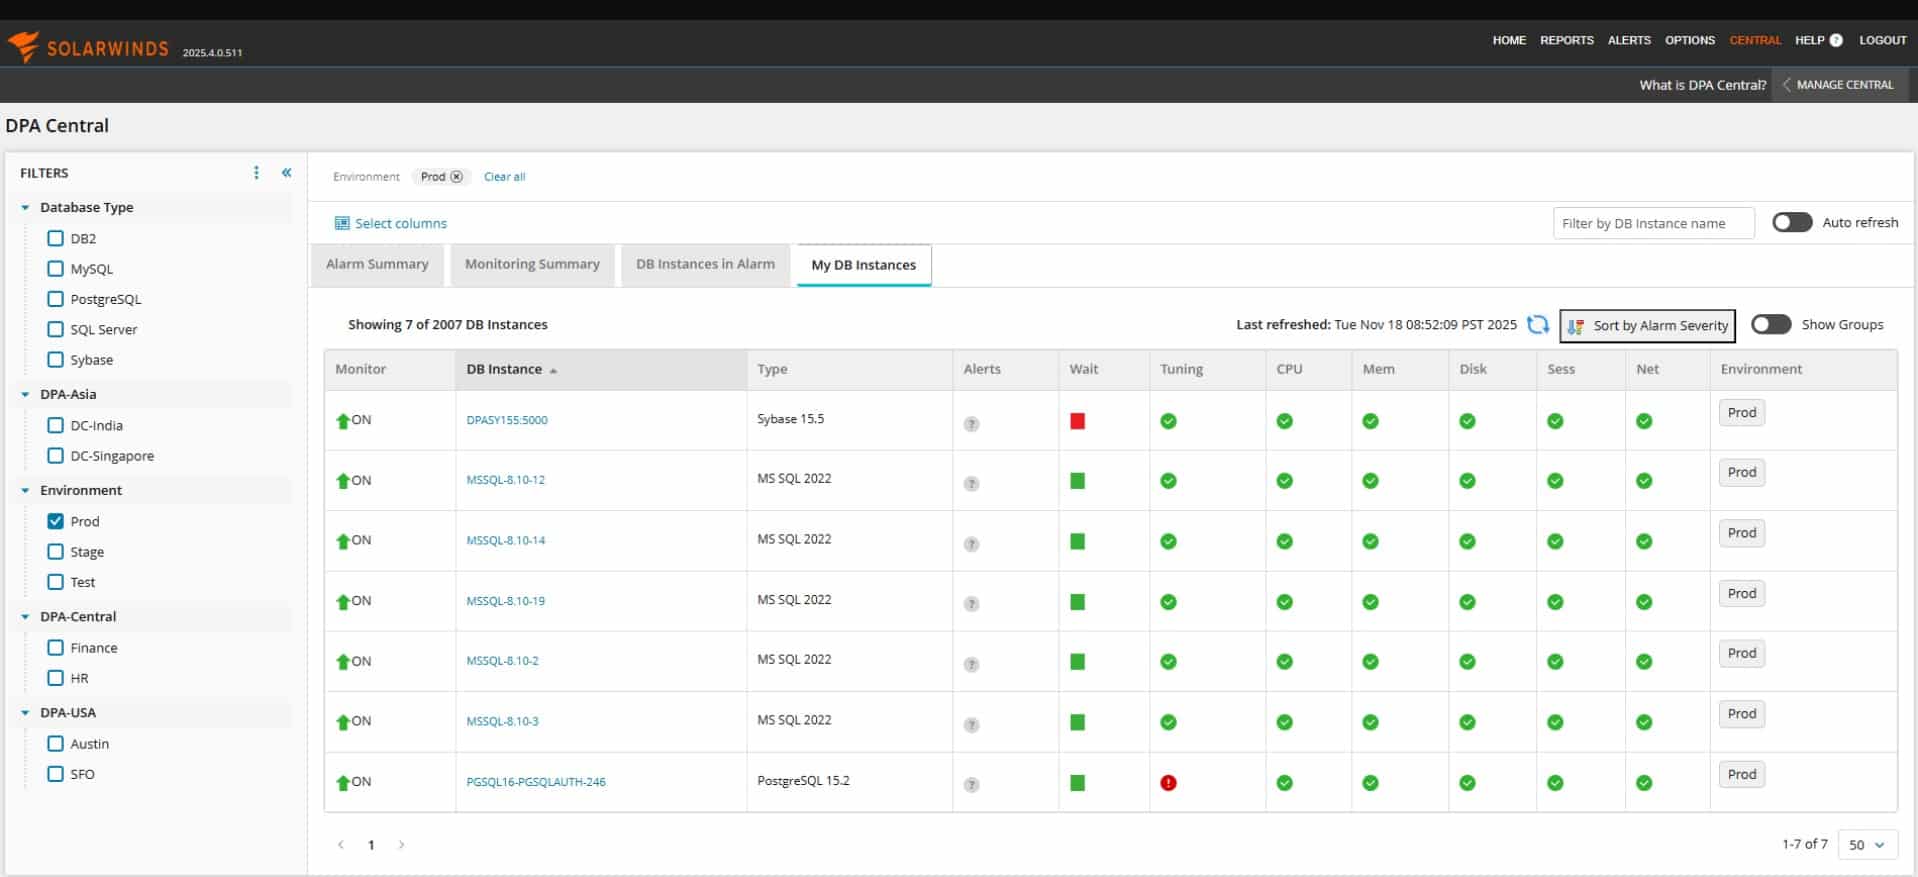
4. SolarWinds MongoDB Monitoring Tool
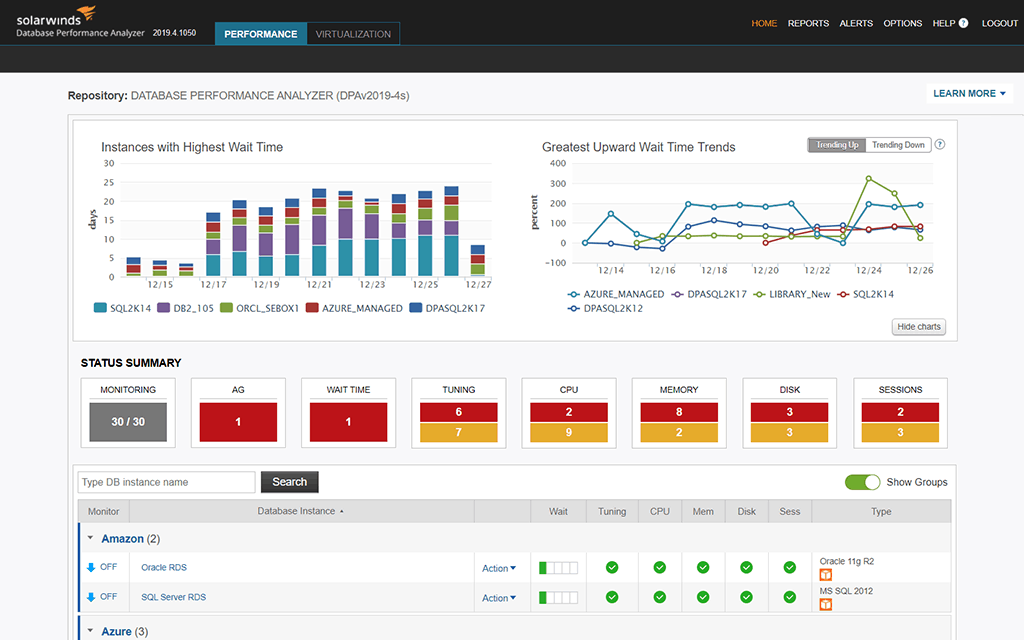
The SolarWinds MongoDB Monitoring Tool is designed to ensure performance and optimization, as it comes with advanced analytics to understand the root cause of problems and even provides expert tuning advice to fix them. This monitoring tool is a part of the Database Performance Monitor from SolarWinds.
Key Features:
- It is a SaaS platform with a web-based user interface
- Provides 24/7 real-time monitoring to help you stay on top of your KPIs
- Allows you to create custom dashboards that can give the insights you want
- Tracks specific metrics related to your MongoDB database so you’re on top of its health at all times
- Sends recommendations based on best practices
- Offers real-time and historical information to make it easy to narrow down to the issues
- Uses automated profiling analysis to track latency, output errors, and more
- Slaves your performance issues in minutes by giving you the right inputs
- Points out inconsistencies with MongoDB’s best practices
- Mitigates the risk of cyberattacks by pointing out misconfigurations in MongoDB
- Provides ongoing compliance status updates
- Comes with ad Adaptive Fault Protection feature to find minor interruptions in server or service availability
- Enhances collaboration among teams to streamline the issues
- Helps application engineers to see the effects of code deployment
Why do we recommend it?
We installed the free trial of the SolarWinds MongoDB Monitoring Tool and rigorously tested its functionalities. The tool truly stands out with its 24/7 real-time monitoring and ability to track specific metrics, ensuring MongoDB’s optimal health. Its automated profiling analysis quickly identified latency and output errors in our tests. While it offers a plethora of features, some users might find the custom dashboard setup initially challenging.
Who is it recommended for?
The SolarWinds MongoDB Monitoring Tool is suitable for database administrators and IT teams that prioritize performance optimization and security. Organizations looking for in-depth insights into their MongoDB database will benefit from its custom dashboards and real-time monitoring. It’s also ideal for application engineers keen on observing the impact of their code deployments.
Pros:
- 24/7 real-time monitoring for constant oversight.
- Custom dashboards for tailored insights.
- Automated profiling for latency and error tracking.
- Offers expert tuning advice for performance optimization.
- Enhanced security with misconfiguration alerts and compliance updates.
Cons:
- Pricing may be steep for small businesses.
Pricing: Starts at $1,340.
Download: Click here for a fully functional 14-day-free trial.
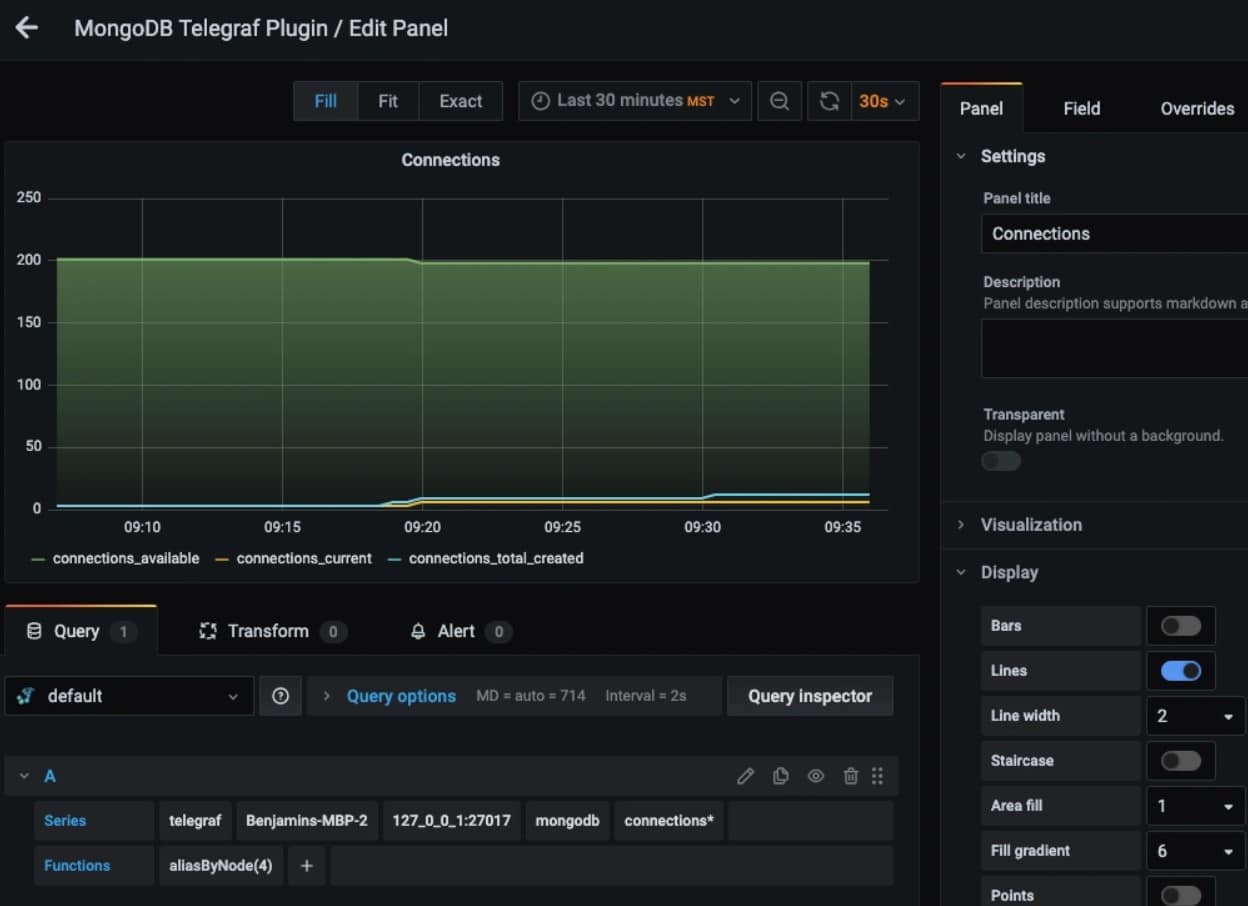
5. MetricFire
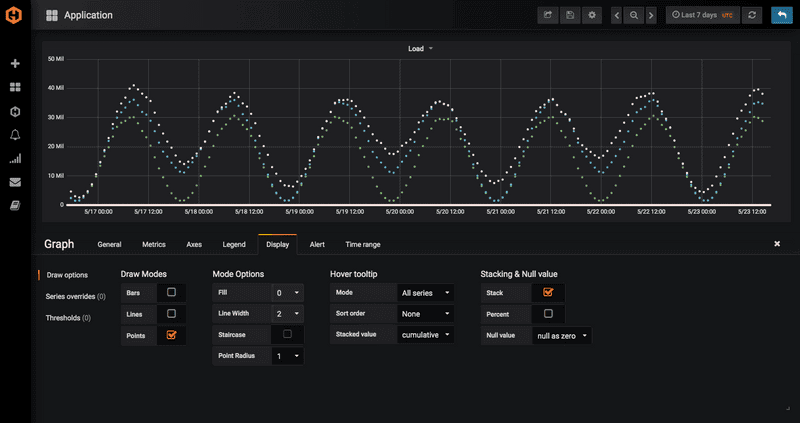
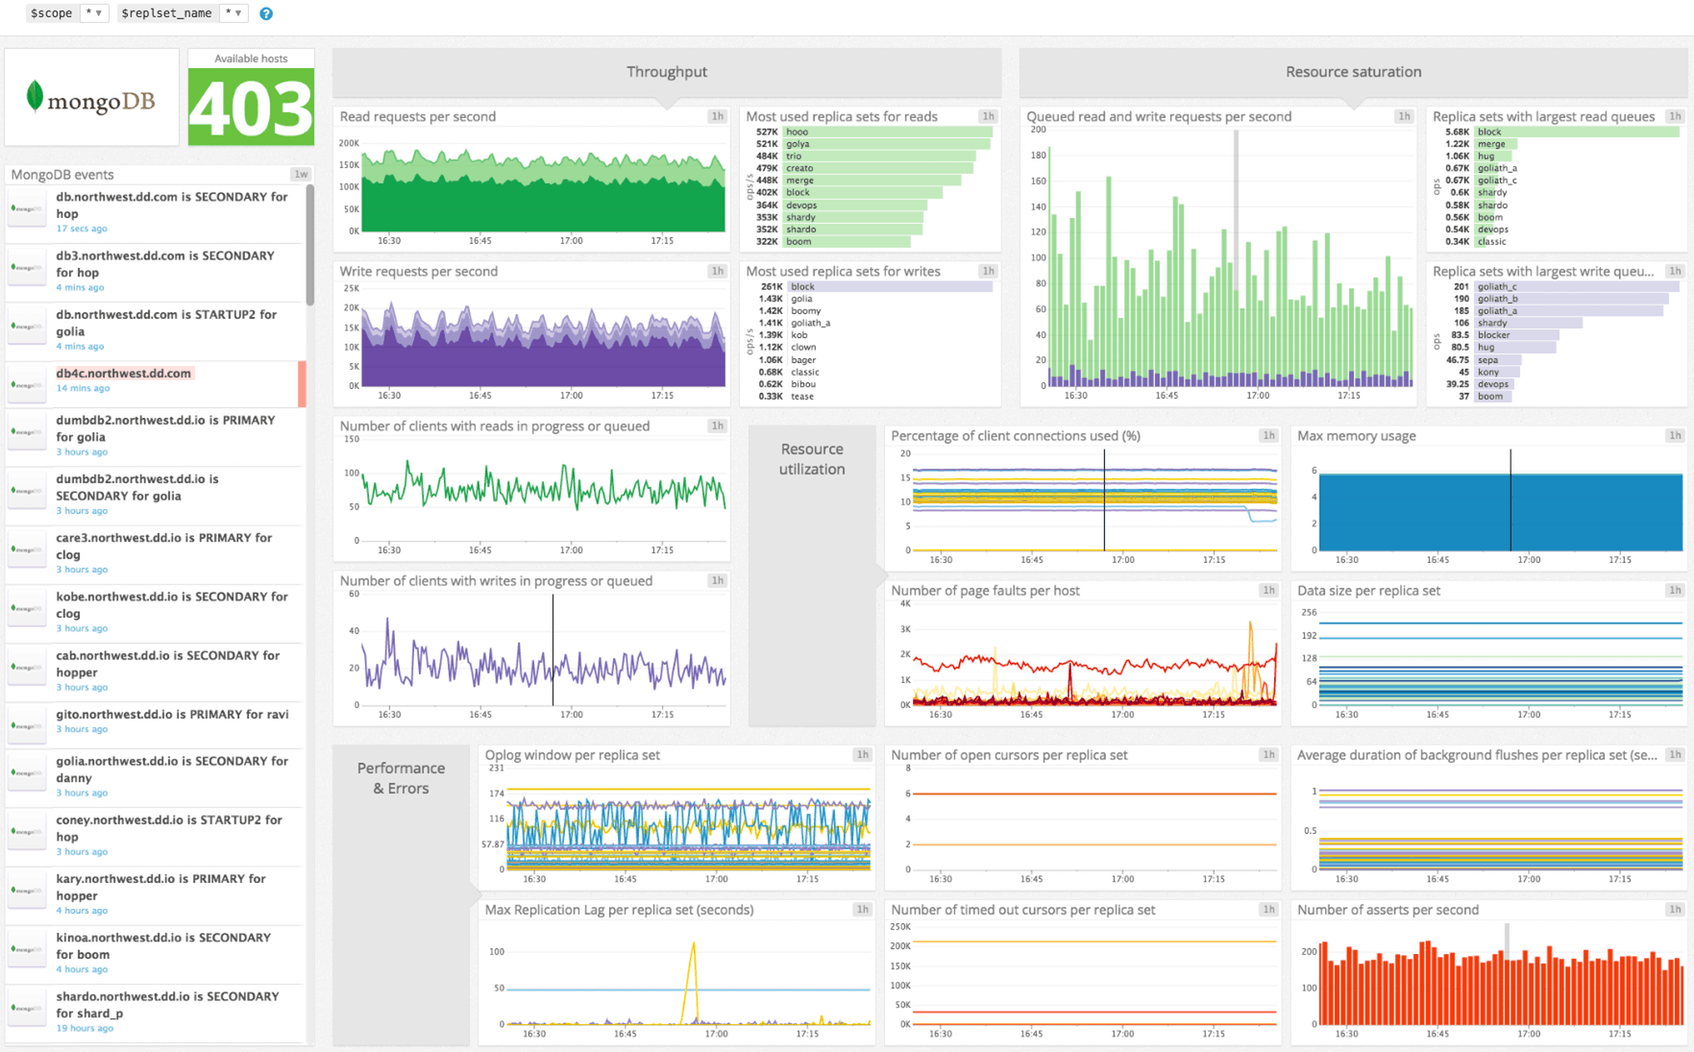
MetricFire is an infrastructure and application monitoring platform that displays all the information you need in a visually appealing way, and this helps to give you real-time insights and visibility. You can choose from one of its two products, namely, Hosted Prometheus and Graphite.
Key Features:
- You can set up custom alerts and have them sent across multiple channels
- Comes with the APIs and integrations you need to connect the insights with your overall monitoring environment
- All metrics are displayed on a Grafana dashboard
- Your team can quickly share and collaborate the metrics
- Retains the metrics for an extended time, depending on your plan
- All read and write operations happen through HTTPS
- Gives complete control as you can make changes quickly to the config file
- The UI is intuitive and feature-rich
- Data can be exported at any time
Why do we recommend it?
Upon implementing MetricFire in our test setup, we were immediately drawn to its visually engaging dashboard which provided real-time insights with ease. The platform’s ability to set up custom alerts and deliver them across multiple channels ensured we stayed informed at all times.
Who is it recommended for?
MetricFire is an excellent choice for organizations that prioritize real-time insights from an infrastructure and application monitoring platform. Its Grafana dashboard display and collaboration features are especially beneficial for teams that need to share metrics swiftly. Additionally, its intuitive UI and robust control mechanisms make it ideal for professionals who desire quick adjustments and data export capabilities.
Pros:
- Customizable alerts and extensive API integrations.
- Intuitive UI with feature-rich Grafana dashboard.
- Extended metrics retention depending on the plan.
Cons:
- Plans and pricing can be complicated for smaller teams.
Pricing: There are four plans available shown on the table below:
| Feature/Plan | Basic | Startup | Growth | Large |
|---|---|---|---|---|
| Retention period | 6 months | 13 months | 18 months | 24 months |
| Alerts | 10 | 25 | 100 | 150 |
| Metrics | 750 | 3,000 | 15,000 | 40,000 |
| Team users | 2 | 2 | 5 | 10 |
| Cost per year | $85 | $429 | $1,099 | $1,599 |
Download: Click here to get started.
7. Foglight for MongoDB
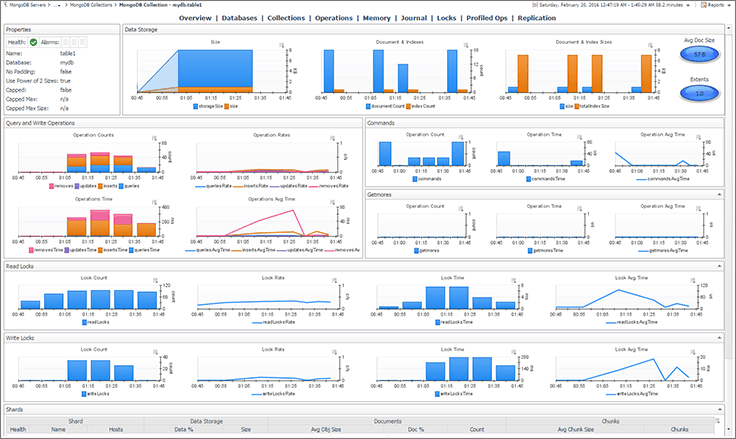
Foglight for MongoDB is a centralized management tool for MongoDB databases that continuously monitors the health and performance of your MongoDB databases and sends alerts and notifications when needed. Also, its detailed analytics and reporting make a big difference in optimizing your database usage.
Key Features:
- Gives a global view of the performance of all your database instances
- Tracks the number of concurrent connections, their memory requirements, and other pertinent parameters. It also sends an alert when the number of connections exceeds the normal or threshold levels
- Its advanced analytics provides a wealth of information on different aspects
- Sends notifications when the page faults increase suddenly
- Provides a detailed analysis of all the database operations
- Helps to resolve concurrency issues
- Avoids false alerts and ensures that messages are triggered only when the baselines are triggered.
- Comes with expert advice to handle some issues
- Stores historical monitoring data safely in an embedded warehouse a no extra cost.
- Supports MongoDB 2.4 and above
Why do we recommend it?
After integrating Foglight for MongoDB into our testing environment, its centralized monitoring capabilities impressed us, especially the continuous health and performance checks of MongoDB databases. The tool’s advanced analytics provided in-depth insights, and its alert system, which avoids false notifications and only triggers when baselines are met, ensured accuracy.
Who is it recommended for?
Foglight for MongoDB is ideal for organizations requiring a centralized management tool for their MongoDB databases. Database administrators who value real-time monitoring, detailed analytics, and expert advice will find this tool indispensable. Its features, such as tracking concurrent connections and resolving concurrency issues, make it a go-to choice for professionals who prioritize database optimization and performance.
Pros:
- Advanced analytics for detailed operation analysis.
- Helps to resolve concurrency issues efficiently.
- Stores historical data in an embedded warehouse.
Cons:
- Interface and feature set might be overwhelming for beginners.
Pricing: Get a custom quote for your needs.
Download: Click here for a free trial.
Conclusion
In short, the usage of MongoDB is growing at an exponential rate because it offers a ton of functionality that is not available in traditional databases. This widespread usage has also led to the need for specialized monitoring tools for these databases.
The options that we have discussed above are some of the best in the industry and we hope this information helps you make informed decisions on the right monitoring tool for your MongoDB database.
