
PRTG Network Monitor is a powerful solution that monitors your entire infrastructure, including systems, devices, traffic and applications.
This product from Paessler GmbH can monitor and classify systems based on different parameters such as bandwidth usage, up-time and more.
Here’s our list of the top PRTG Alternatives:
- ManageEngine OpManager – Best for large distributed networks with VoIP and WAN monitoring
- Site24x7 – Best for cloud users requiring broad protocol and traffic analysis
- Nagios XI – Best for Linux admins seeking customizable enterprise monitoring
- SolarWinds NPM – Best for deep network performance troubleshooting and mapping
- Zabbix – Best for open-source fans needing free scalable monitoring
PRTG presents an easy-to-understand hierarchical view of a network, generates an exhaustive set of reports and even gives plenty of alerts, so you can always stay on top of what is going on in your system.
Though PRTG comes with many interesting features, there are some downsides to it as well. Firstly, it is quite expensive.
The exact price depends to a large extent on the number of sensors you use. The first 100 sensors are free, and it costs
- $1600 for 500 sensors
- $2850 for 1000 sensors
- $5,950 for 2500 sensors
- $10,500 for 5000 sensors
- $14,500 for unlimited sensors in one core installation
- $60,000 for unlimited sensors in five core installations.
The above pricing clearly shows that PRTG is expensive and hence, is not ideal for all organizations.
The Best PRTG Alternatives
Besides cost, there are also a few other things that can be a spot of bother. Adding and removing sensors or moving devices from one group to another can be quite a hassle. Also, it provides only limited support for Windows 10. If any of these downsides are likely to impact you, it makes sense to look for alternatives to PRTG.
Methodology for selecting the Best PRTG Alternatives for Network Monitoring
Many organizations look for PRTG Alternatives for Network Monitoring for it is quite expensive, may not scale well for larger networks, and is also complex to configure. It does provide real-time monitoring of network devices and other benefits, yet most users prefer PRTG Alternatives. To make it easier for you to choose the best one, we have listed a few methodologies that you must consider before finalizing the software.
- Make sure that your selected product can keep track of networks, servers, as well as applications
- Check if the network autodiscovery feature is available
- Make sure to check if your selected product offers an automated network topology mapper
- Check if your tool is compatible with different operating systems.
- Does it offer free add-ons to extend the functionality of the original software?
- Can you track the health performance and run network traffic analysis with the selected product?
- Does it send instant alerts related to performance and resource availability?
- Does it send a notification by email or SMS on detecting an issue?
- Check if your selected tool provides a money-back guarantee or free trials.
Related Post: Best Storage Monitoring and Management Software
Let’s take a detailed look into the features of each of these products to help you make the right choice, along with some screenshots and download links to get you started right away if you wish to move on.
1. Auvik Network management – FREE TRIAL

Auvik Network Management is a similar package to the PRTG Network Monitor’s SaaS version. The Auvik platform installs an agent on each monitored site and that module scans the network to discover all devices.
Key Features
- A continuous network discovery cycle that identifies all devices connected to the network and can spot rogue devices
- Automated network documentation processes that include hardware inventory
- Generates a network map based on the data in the inventory
- Network device status tracking through the Simple Network Management Protocol (SNMP)
- Alerts for device component failure
- Network traffic monitoring with NetFlow, IPFIX, sFlow, and J-Flow
- Opportunities for manual traffic analysis
- Stored metrics for capacity planning
- Identification of peaks and troughs in network demand
- Able to monitor WANs
- Tracing of connections between sites and cloud platforms
- Network configuration image archiving
- A repeated network configuration check that will detect unauthorized changes
- A Web-based dashboard that can be accessed from anywhere through any standard browser
Why do we recommend it?
Being a SaaS platform, most of the operations of the Auvilk Network Management system take place on the cloud. This means that you don’t have to allocate server space in order to run the software and you can set the package up quickly to monitor multiple networks and the internet connections between them.
Who is it recommended for?
This platform is suitable for any business that runs a network. However, the charging structure for the package makes it particularly interesting for large companies. This is because there is no accounting for the number of endpoints on a site or the number of sites monitored in one account – the charge is the same.
System requirements:
This package is delivered from the cloud and so it can be accessed through any standard Web browser.
Pros:
- Network discovery that repeats and spots layout changes or new equipment
- Detection of rogue devices
- Network configuration management that identifies settings changes
- Routine device status checking
- Network traffic analysis
Cons:
- Need to make contact for a price list
The Auvik Network Management platform is available for a 14-day free trial.
EDITOR'S CHOICE
Auvik Network Management is our top pick for a PRTG alternative because it bears a lot of similarities to PRTG. This is a cloud platform – which is one of the delivery options for PRTG. Like its rival, the Auvik package implements network discovery and compiles a hardware inventory. The discovery process can reveal unauthorized devices connected to the network. The routine repeats periodically and it will automatically update the network inventory if a device has been added, moved, or removed. The package provides a network map, which is generated from the data in the hardware inventory. So, when the hardware inventory updates, the map does too. The network monitoring service includes an SNMP-based device monitor that checks for system hardware problems. The other main service in the package is a network traffic analyzer, which uses NetFlow, sFlow, J-Flow, and IPFIX flow protocols to gather data throughput information from switches and routers. The package also provides a network configuration manager – a service that PRTG doesn’t provide.
Download: Get a 14-day FREE Trial
Official Site: https://www.auvik.com/features/#trial
OS: Cloud-based
2. Progress WhatsUp Gold – FREE TRIAL
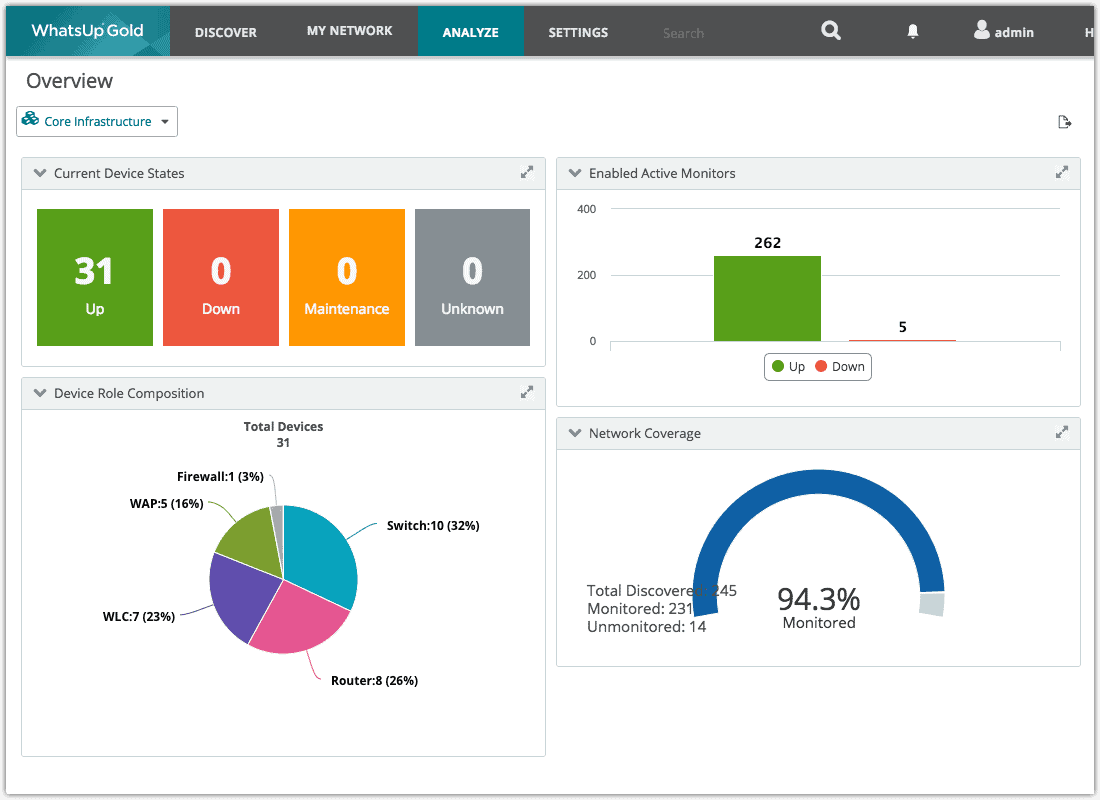
Progress WhatsUp Gold is a network monitoring software that provides visibility into your network devices, including their performance and availability. Using this information, you can quickly troubleshoot issues to improve operational efficiency and ensure device availability.
In particular, its customizable dashboards provide information in an easy-to-understand format to help your team fix issues quickly. Its real-time alerts also support a proactive approach to maintaining your network’s performance.
Key Features:
- Analyzes every device that connects to your network and presents the findings on an intuitive dashboard.
- Its dashboards are highly customizable, allowing every employee to view the information that matters most to them.
- It supports the creation of custom policies to meet your specific SLAs.
- Comes with a configurable Network Operations Center (NOC) to gain comprehensive visibility into current and potential network issues.
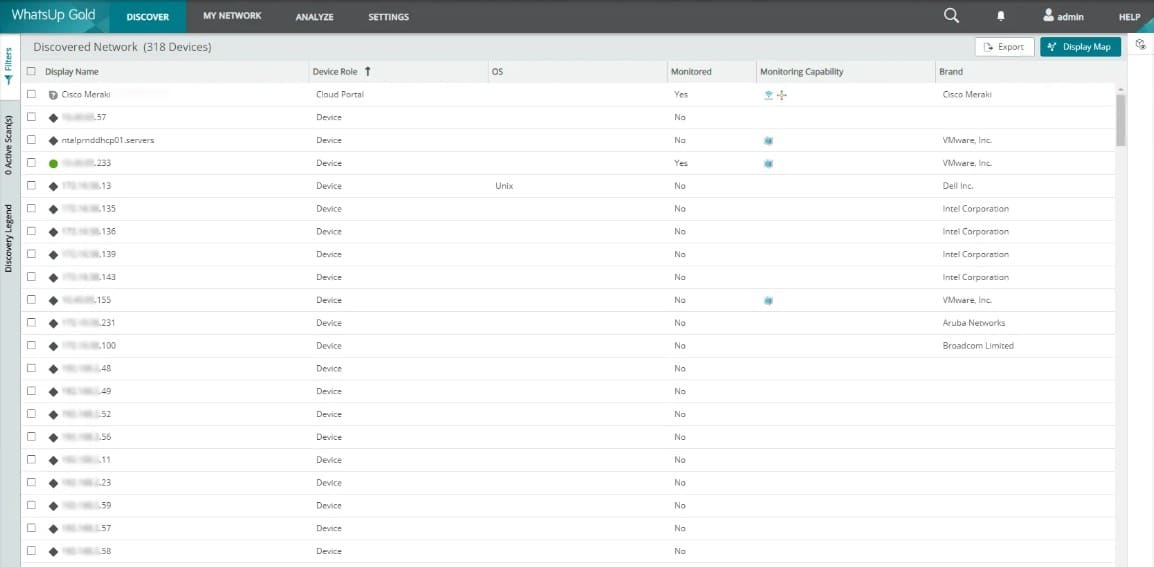
- Automatically discovers all devices that connect to your network. Its powerful Layers 2 and 3 scan ensures that every device is discovered.
- Uses SNMP queries to detect hardware devices.
- Generates a detailed topology of all devices connected to your infrastructure.
- Uses device dependency to identify problems.
- Sends alerts when thresholds are exceeded and helps prioritize your response strategy.
- Monitors a wide range of devices, provided the device has an IP address that can be accessed through standard monitoring protocols.
Why do we recommend it?
WhatsUp Gold is well-known for its extensive coverage, as it can detect and monitor every kind of device that connects to your network. Moreover, the presentation of the analysis on customizable dashboards makes it highly useful for troubleshooting, capacity planning, and other data-driven decisions.
Who is it recommended for?
This tool is ideal for Managed Service providers (MSPs) and network administrators who need a robust tool for network monitoring, troubleshooting, and management. It also works well for medium to large enterprises that need real-time insights into network performance, device health, and application behavior.
System Requirements
WhatsUp Gold works best on Microsoft Windows Server 2019, 2022, and 2025. It requires a storage of 25GB, a quad-core processor, SQL Server 2022 Express Edition, and 8 GB of memory. Its recommended browsers are Microsoft Edge, Google Chrome, and Mozilla Firefox.
Pros
- Offers drag-and-drop functionality to build interactive network maps and customized dashboards.
- Automatically discovers all devices with an IP address.
- Combines network monitoring, management, and troubleshooting through a single console.
- Generates alerts based on predefined thresholds.
- Highly scalable and customizable to meet the needs of different organizations.
Cons
- High learning curve for advanced features.
WhatsUp Gold offers a perpetual license and subscription-based pricing. The subscription options are:
- Business
- Enterprise
- Enterprise Plus
- Enterprise Scale
Start a 30-day free trial.
3. Atera – FREE TRIAL

Atera is a package of tools for managed service providers that includes automated remote monitoring for networks, servers, and applications. This system has a multi-tenant architecture, which keeps the data of MSP clients separate.
Key Features
- SNMP-based network device performance monitoring
- Server hardware monitoring
- Application activity monitoring
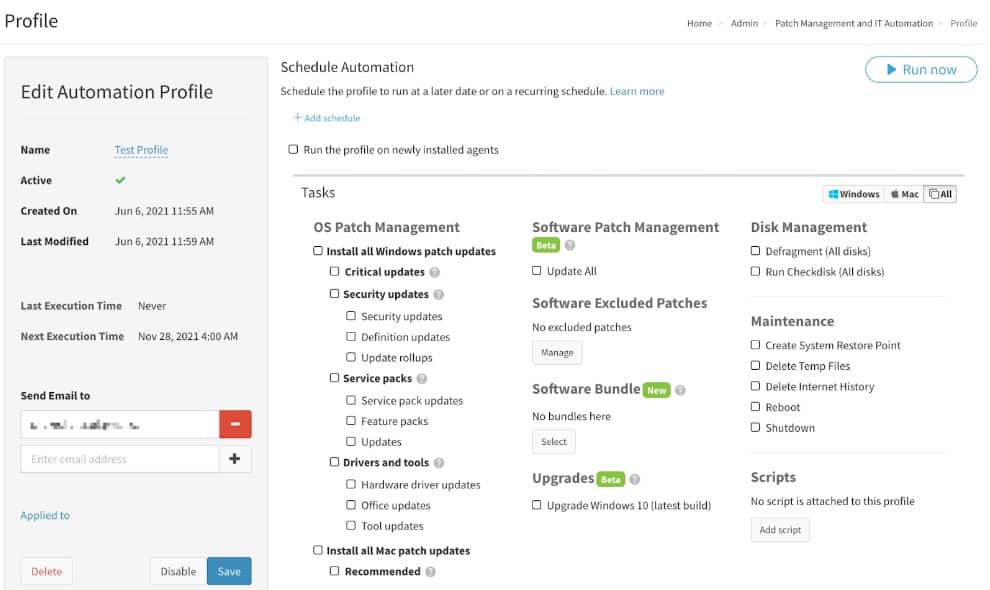
- Operating system patching for Windows and macOS
- Automated maintenance tasks implemented on schedules
- Software installer and updater
- A ticketing system for task tracking and team management
- A technician dashboard with task management utilities
- Remote desktop tools – Splashtop and AnyDesk
- Chat windows for communication between technicians and users
- Professional services automation (PSA) tools for MSP business management
- Alerts for device status issues
- Performance thresholds that spot evolving problems
- Cloud-based service that can be accessed by work-from-home technicians
- Per technician pricing suitable for independent support consultants and MSPs of all sizes
Why do we recommend it?
Atera stands out for its comprehensive toolkit designed specifically for managed service providers, offering features like SNMP-based monitoring, automated maintenance, and professional services automation. Its cloud-based architecture and per-technician pricing model offer unparalleled flexibility for MSPs of all sizes.
Who is it recommended for?
Atera is recommended for managed service providers and independent support consultants looking for an all-in-one solution for remote network monitoring, task automation, and business management. It’s particularly useful for teams that require remote access capabilities and a scalable pricing structure.
System requirements: This cloud-based system can be accessed through any standard Web browser.
Pros:
- Users can watch over unlimited devices from a single console anytime
- You can streamline your operations and communications with a support desk and insightful reports
- Uses third-party tools like TeamViewer, AnyDesk, etc. to instantly run sessions
- Automate the installation of Windows, and Mac, as well as other program updates on the devices of your end users.
- Runs security scans of all your networks and alerts on discovering device status issues
Cons:
- Not a great solution for smaller businesses
There are three plans for Atera that are charged for on a subscription per technician and with monthly or yearly payment plans. The price for each plan per month when paid annually is:
- Pro – $129
- Growth – $179
- Power – $209
Atera is available on a 30-day free trial.
4. ManageEngine OpManager – FREE TRIAL
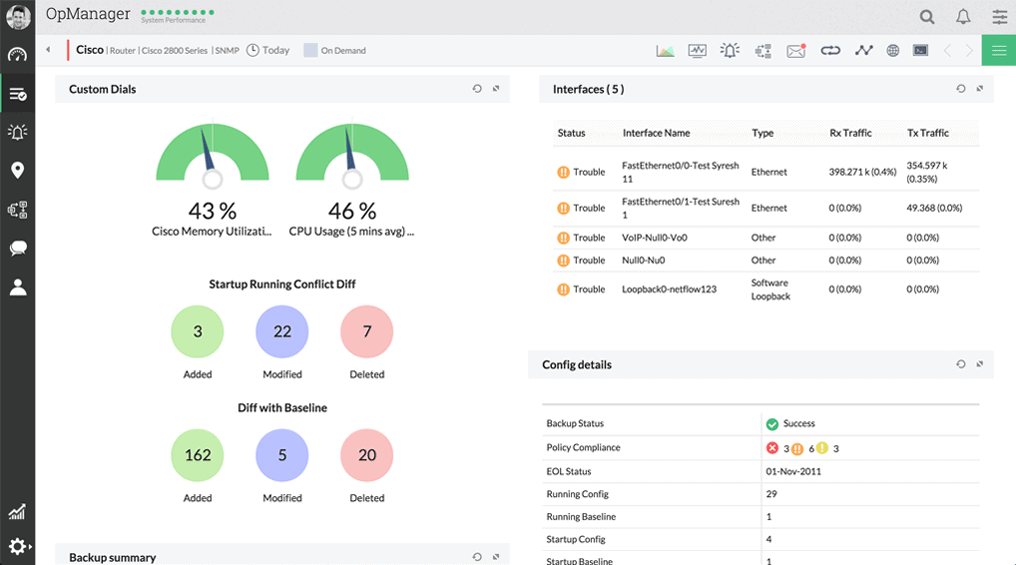
ManageEngine OpManager is a powerful and user-friendly monitoring software that can monitor different elements in your infrastructure such as routers, switches, firewalls, servers, virtual machines and more.
Key Features
Salient features of ManageEngine OpManager are:
- Visualizes and resolves WAN or router problems.
- Monitors routers, interfaces, bandwidth and WAN links for both availability and performance.
- Proactively monitors VoIP call quality across the entire WAN infrastructure. it even troubleshoots poor performance of any VoIP call.
- Automatically maps L1 and L2 networks to identify network outages and performance problems.
- Leverages Cisco IP SLA technology to monitor WAN link availability and latency.
- Monitors physical and virtual servers across different operating systems such as Windows, Linux, Unix, VMware, BSD and more.
- Uses more than 70 VMware performance monitors to agentlessly monitor VMware virtualized servers.
- Uses WMI credentials to monitor the performance of hyper-v hosts and guests.
- Monitors Citrix Hypervisor and provides the necessary details about its performance
- Uses SNMP/CLI/WMI to manage processes running on discovered devices and to gather pertinent data.
- Performs first and second-level troubleshooting tasks
- Supports more than 300 SNMP traps per second.
- Monitors critical security logs across all Windows servers and workstations.
- Provides insights into capacity performance and configuration of RAID controller devices.
- Automatically discovers fabric switches in a SAN environment.
- Creates an exact replica of your data center in 3D format.
- Tracks your network bandwidth usage in real-time.
- Scales up to 10K devices and ensures high availability of these devices
- Allows you to extend the scope of OpManager by installing add-ons.
Why do we recommend it?
ManageEngine OpManager offers a robust set of features for monitoring various elements of your infrastructure, from routers and firewalls to virtual machines. Its capacity for real-time troubleshooting, root-cause analysis, and scalability up to 10K devices makes it a leading choice in its category.
Who is it recommended for?
OpManager is well-suited for IT professionals overseeing small to large and distributed networks. It offers particular advantages for those needing to monitor a mix of physical and virtual servers, as well as WAN and VoIP performance, across multiple operating systems.
Editions: There are two editions available for OpManager, and they are:
- Essential for small and medium enterprises
- Enterprise for large and distributed networks
Pros:
- Watch over firewalls, servers, routers, VMs, etc.
- Investigates a problem’s root cause and resolve it in real-time
- Generates in-depth stats for routers, and WiFi systems to monitor strength and network traffic
- Based on the security level, you can send color-coded alerts
- Real-time network bandwidth usage monitoring
Cons:
- Too complex for non-technical users
Essential edition starts at $715 for 25 devices while Enterprise starts at $19,795 for 500 devices. Start with a 30-day free trial to figure out your network requirements.
5. Site24x7 – FREE TRIAL
Key Features
Here is a rundown of the main network monitoring features of the Site24x7 platform:
- Prices as a subscription package on a cloud platform
- Local agents for Windows Server and Linux
- SNMP-based network status reports
- Network device discovery
- Hardware inventory creation and maintenance
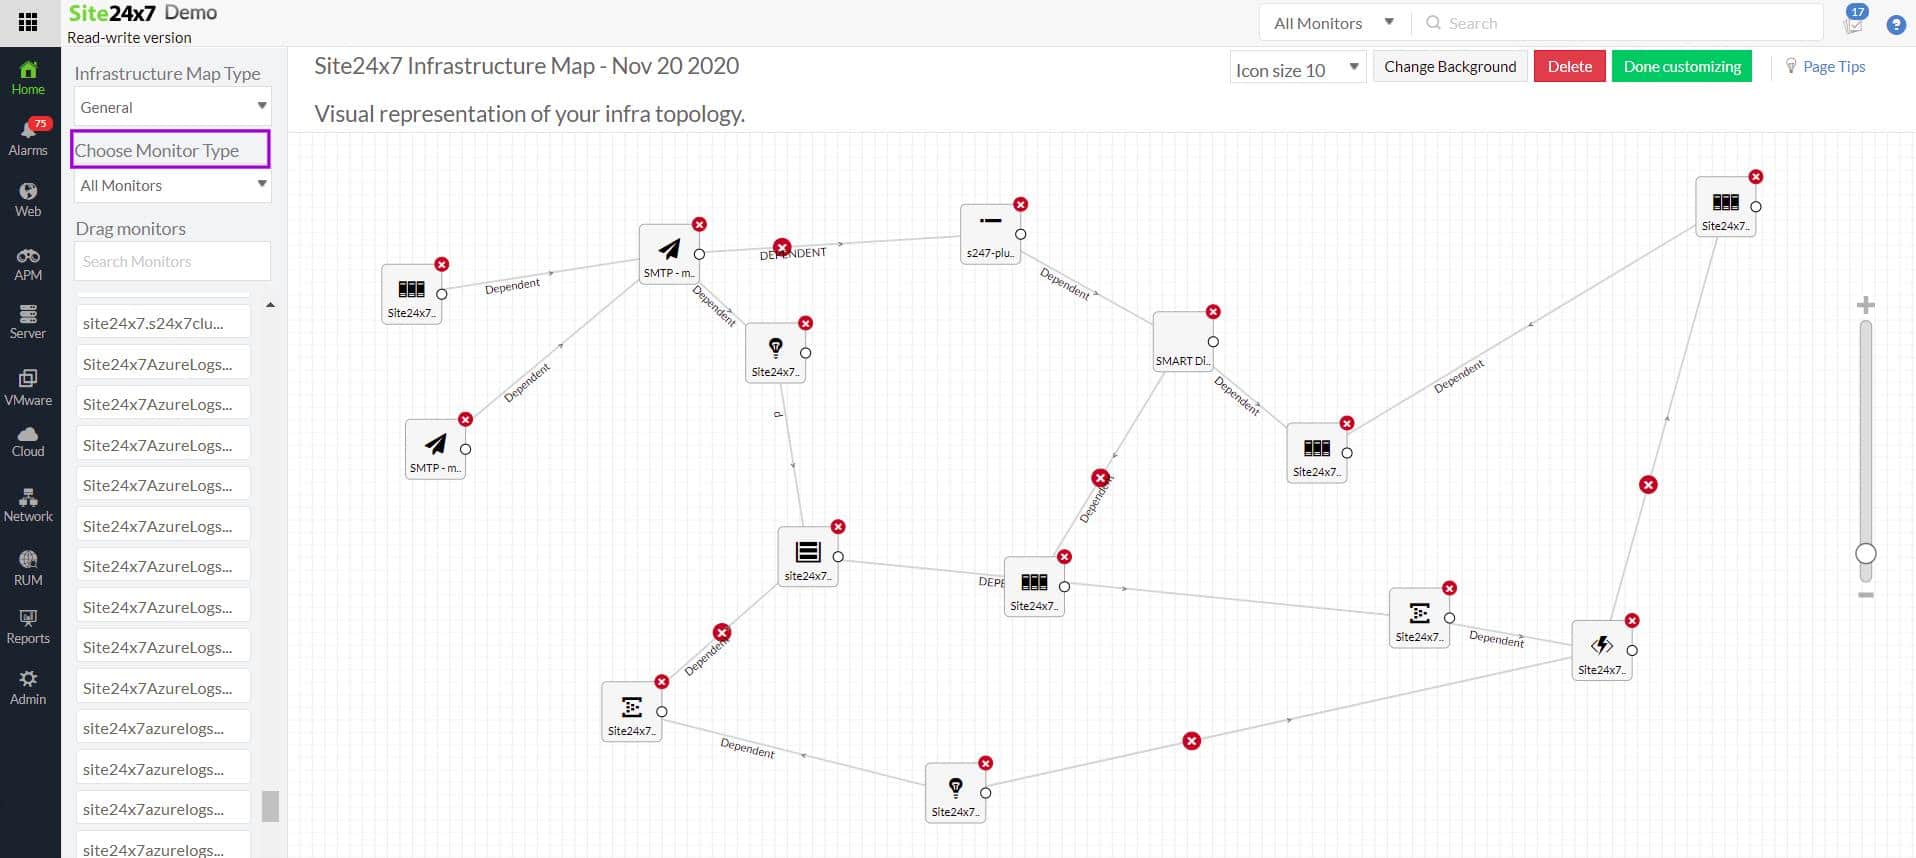
- Network topology mapping
- Constant network device status monitoring
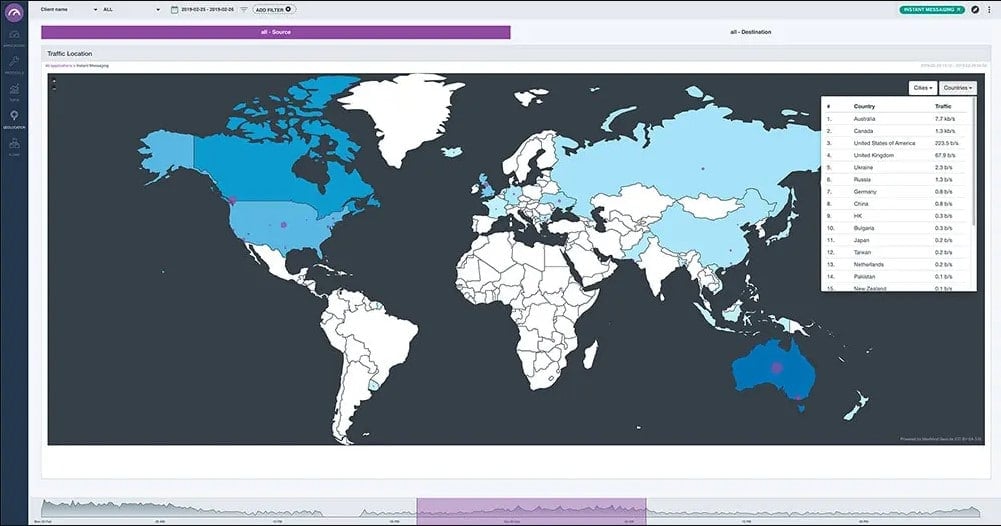
- Network traffic analysis through the use of the NetFlow, sFlow, J-Flow, CFlow, IPFIX, AppFlow, and NetStream protocols
- VoIP quality of service measurements in terms of IP SLA and MOS
- A Ping testing utility that can be run on-demand or on a schedule
- Virtualization monitoring
- Internet conneciton monitoring
Why do we recommend it?
Site24x7 offers a comprehensive cloud-based solution for network monitoring, complete with features like SNMP-based reports, network topology mapping, and VoIP quality of service measurements. Its versatility in traffic analysis protocols and range of subscription packages make it a flexible choice for diverse needs.
Who is it recommended for?
Site24x7 is suitable for businesses of all sizes, particularly those requiring constant network monitoring and granular traffic analysis. It’s an ideal choice for companies that employ various network protocols and wish to monitor their internet connection and VoIP services comprehensively.
There are five editions available: Website Monitoring, Infrastructure Monitoring, APM, All-in-One, and MSP. The Website and All-in-One editions are offered in four plans each. The lowest price for each edition is:
- Website Monitoring – $9 per month
- Infrastructure Monitoring – $9 per month
- APM – $35 per month
- All-in-One – £35 per month
- MSP – $45 per month
These rates are calculated from the annual subscription price. You can access a 30-day free trial.
6. Nagios XI
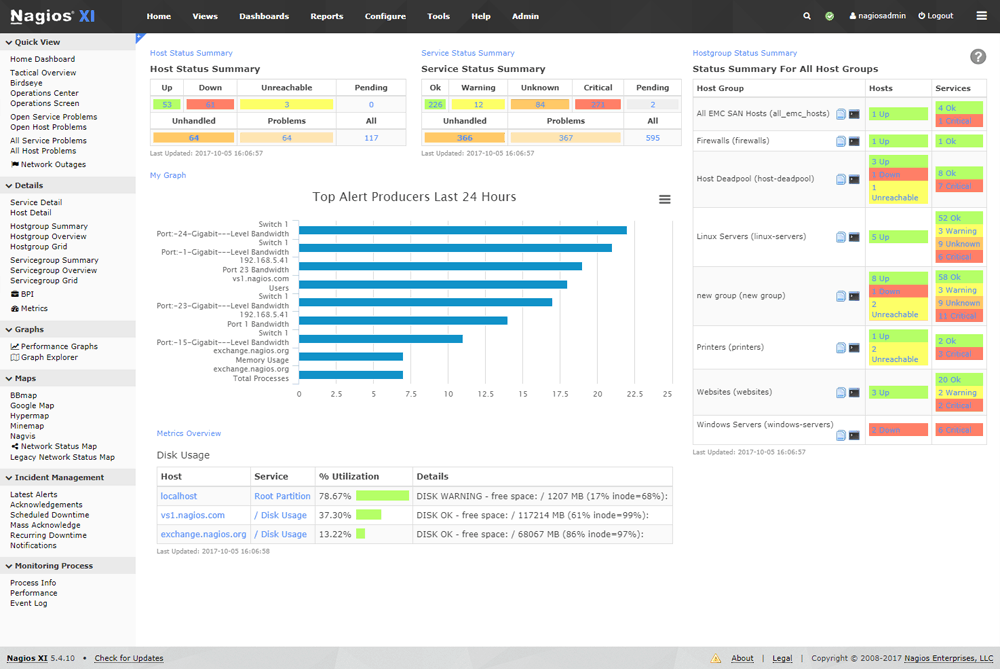
Nagios XI is a comprehensive enterprise server and network monitoring software. It is an integral component of Nagios’ powerful suite of applications.
Key Features
Here is a look at what Nagios XI can offer for your organization.
- Monitors all the critical components of IT infrastructure including applications, services, operating systems, network protocols, devices and more.
- Offers a web interface that gives access to a powerful dashboard. You can monitor and control every aspect of your infrastructure monitoring through this dashboard.
- Uses a powerful monitoring engine called Nagios Core 4.
- Comes with configuration wizards that make it easy for users to do many operations such as adding new devices. This reduces a lot of time and effort for users.
- Capacity planning makes it easy to identify existing issues and come with the right infrastructure mix for optimal performance.
- Its advanced graphs give a quick insight into the performance and availability of different devices in the network.
- Delivers multi-tenant capabilities. It means this software can accommodate multiple users and provides the capability to manage these different users.
- Gives the option to extend its capability through APIs and add-ons.
- Provides network-specific and customizable alerts
Why do we recommend it?
Nagios XI offers a robust monitoring engine and an intuitive web interface, streamlining the management of diverse IT components from network protocols to operating systems. Its advanced graphs and multi-tenant capabilities make it a comprehensive solution for enterprise-level monitoring.
Who is it recommended for?
Nagios XI is tailored for IT administrators and network managers in medium to large enterprises who need a highly customizable, scalable, and comprehensive monitoring solution. The tool is particularly beneficial for those who require advanced reporting and capacity planning features.
Editions: There are two editions in Nagios XI, namely, Standard and Enterprise.
Standard edition comes with the following features:
- Easy Configuration Wizards
- GUI Configuration
- Advanced Reporting
- Enhanced Visualizations
- Custom User Dashboards
- Custom User Views
- Executive Summary Report
- Custom Actions
- Dashboard Deployment
- Notification Escalations
Enterprise edition has all that is available in the standard edition, and to top it, this edition has the following features.
- Scheduled Reports
- Capacity Planning Reports
- Web-Based Server Console Access
- Bulk-Modification Tools
- Audit Logging
- Notification Deployment
- SLA Reports
- Scheduled Pages
- Automated Host Decommissioning
Pros:
- Keeps track of all the crucial elements of the IT system.
- Uses APIs and add-ons to extend its functionality
- Allows sending customizable alerts to administrators
- Generates advanced graphs that update the performance and availability
- Saves time with configuration wizards
Cons:
- Free software does not come with paid assistance
- Not a great platform for an enterprise environment
The Standard edition starts from $1,995 while the enterprise edition starts from $3,495. You can download a fully functional 60-day free trial from here.
7. SolarWinds Network Performance Monitor
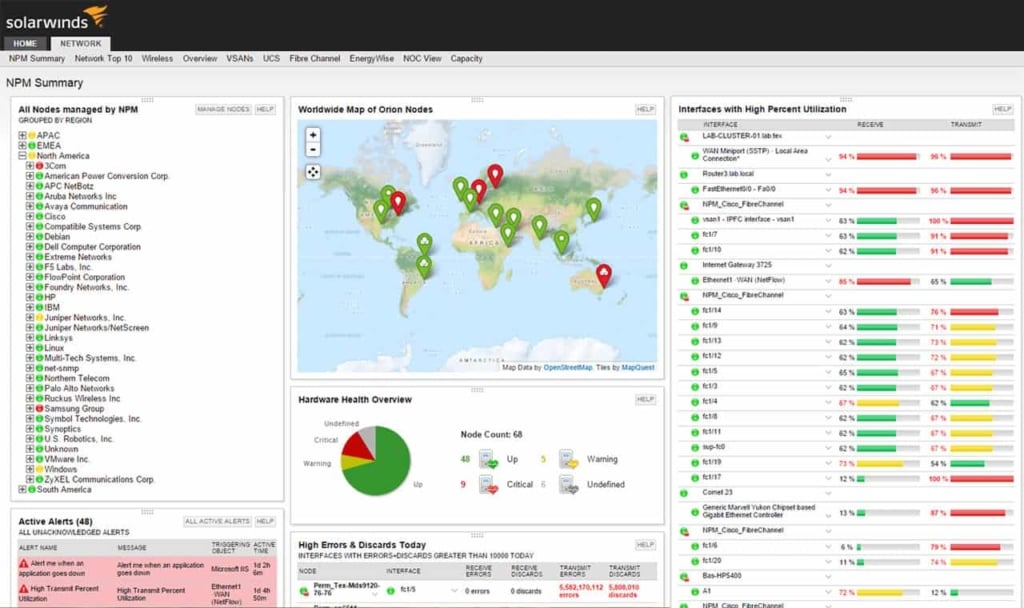
SolarWinds Network Performance Monitor – also known as NPM – is a popular alternative to PRTG. This is an advanced monitoring network that reduces outages and improves overall performance.
Key Features
Important features of SolarWinds NPM are:
- Quickly detects, diagnoses and resolves performance issues
- Gives a hop-by-hop analysis of critical paths.
- Allows you to drag and drop metrics on a common timeline for visual correlation of all your data.
- Offers a customizable topology and intelligent alerts that take into account various dependencies.
- Automatically discovers and maps devices, metrics, link utilization and more.
- Provides insight into the health and performance of any F5 service delivery environment.
- Calculates exhaustion dates using customizable thresholds. This can help with capacity planning, forecasting and budgeting.
- Retrieves performance metrics for autonomous access points, clients and wireless controllers.
- Comes with out-of-the-box alerts and reports, that are advanced and highly relevant to the performance of your infrastructure.
- Installs and deploys within just an hour.
- Offers a web-based network performance dashboards, views and charts.
- Uses Packet Capture and Analysis feature to determine the quality of end-user experience.
- Dynamically calculates baseline thresholds from historical network performance data.
- Monitors, alerts and reports key network monitoring metrics such as temperature and power supply.
Why do we recommend it?
SolarWinds Network Performance Monitor excels in real-time diagnosis, issue detection, and resolution. Its customizable thresholds for calculating exhaustion dates, along with advanced and relevant out-of-the-box alerts, make it a top pick in network monitoring tools.
Who is it recommended for?
This tool is highly recommended for IT administrators, network engineers, and capacity planners who require in-depth monitoring, real-time analytics, and alerting functionalities. It’s particularly beneficial for those managing large and complex networks, as well as F5 service delivery environments.
System requirements:
The system requirements of SolarWinds NPM are:
- CPU : Dual processor, 3.0 GHz
- Memory: 3GB
- Hard drive: 20GB free disk space
- Operating system: Windows server 2008 R2 SP1, Windows server 2012 and Windows server 2012 R2.
- Database: All versions of SQL Server 2008, 2008 SP1, 2008 SP2, 2008 SP3, 2008 SP4, SQL Server 2008 R2, 2008 R2 SP1, 2008 R2 SP3, SQL Server 2012, 2012 SP1, 2012 SP2, 2012 SP3, SQL Server 2014, 2014 SP1 and SQL Server 2016.
- .NET framework: version 4.5 is required.
Pros:
- Runs diagnosis, detects issues and resolves them in real-time
- Scans critical paths by performing hop-by-hop analysis
- Uses custom thresholds to calculate exhaustion dates
- Users can keep track of temperature as well as power supply
- Provides clarity and insights into the overall efficiency and health of the Cisco ASA environment
Cons:
- A more user-friendly interface would be helpful for the Network mapping function
SolarWinds Network Performance Monitor is available on a free trial, download below to Get Started!
8. Zabbix
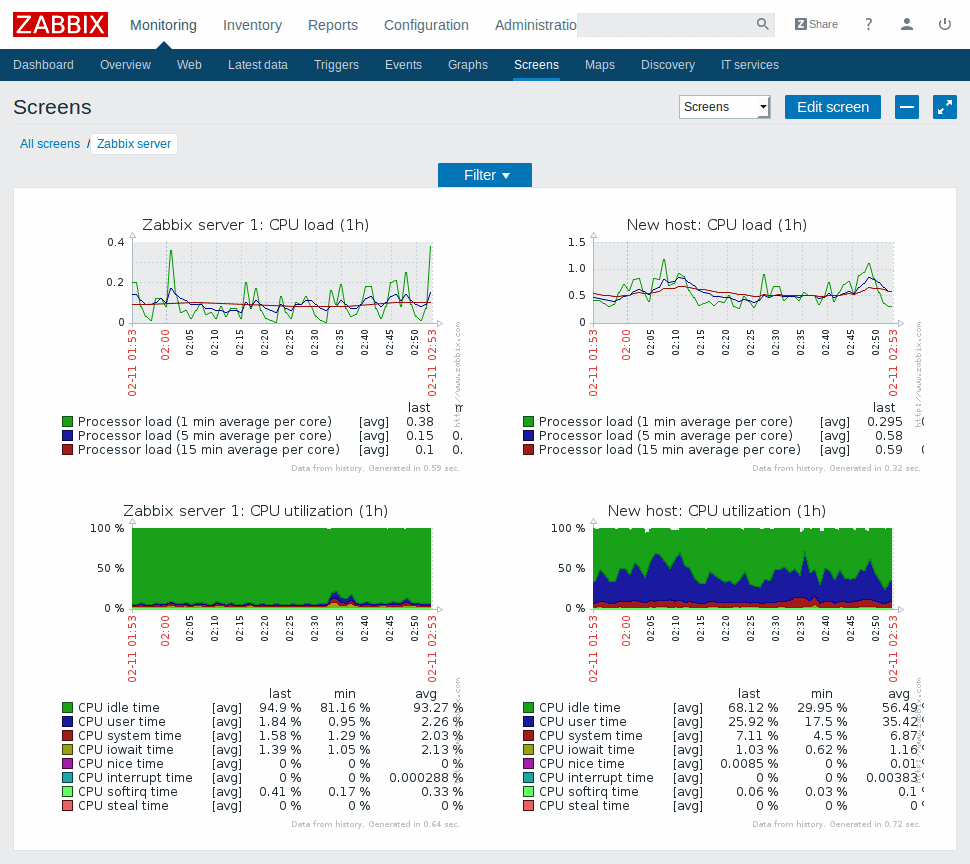
Zabbix is an enterprise-class monitoring solution that can pretty much monitor anything, regardless of the infrastructure, services, applications or devices.
Key Features
- Collects metrics from any device, system or application
- Detects problem states within the incoming information, so there is no need for a separate analysis.
- Offers highly flexible definition options
- Predicts trends, detects anomaly and gives root cause analysis.
- Native web interface gives a visual overview of the entire network.
- Provides many reports, widgets, slideshows and network maps to give you a precise idea of the state of your network
- You have the choice to allow Zabbix to fix all issues automatically.
- Escalates problems based on user preferences
- Customizes messages based on recipient’s role.
- There is a strong encryption among all Zabbix components
- Code is open for security audits
- Installs within minutes
- Build custom templates based on your preferences
- Allows you to monitor thousands of devices through configuration templates
- Periodically scans devices and discovers them automatically.
- Monitors devices even behind firewalls and DMZs
- Remotely runs custom scripts on monitored hosts
- Can be easily integrated with third party software
Why do we recommend it?
Zabbix stands out for its ability to collect metrics from virtually any device, system, or application without requiring separate analysis. The software offers robust features like automatic issue resolution, flexible deployment options, and integration with third-party software, making it a highly adaptable solution.
Who is it recommended for?
Zabbix is suitable for organizations that have complex, multi-faceted infrastructures, including those with devices behind firewalls and DMZs. It’s an excellent option for IT professionals looking for a robust, enterprise-class monitoring system that offers both flexibility and automated problem-solving capabilities.
Pros:
- No need for separate analysis as it identifies problem status in real-time
- Automatically fix issues as per your preference
- Flexible deployment options are available
- Provides ready-to-use templates to connect Zabbix installation with ticketing and ITSM systems
- Full-time technical support at the global level
Cons:
- Depends on the open-source community for guidance
- Larger networks and enterprises cannot benefit much from Zabbix
Zabbix is 100% free and can be downloaded from here.
Conclusion
To conclude, PRTG is a great tool for Monitoring networks and your Infrastructure, as well as keeping your critical systems monitored and online. If you are looking to move to a different platform for your IT Monitoring Solution, then we suggest one of the aforementioned software packages – they are all Great Replacements to PRTG and will more or less, complete the same tasks!
We hope these alternatives will help you make the right decision for your organization.


