
Zabbix is one of the top tools available today for network monitoring and management. However, it does come with its own shortcomings, and we’re going to go over some of the top alternatives to Zabbix below, but first lets see some areas we can improve on.
Here is our list of the top Zabbix alternatives:
- SolarWinds Network Performance Monitor – FREE TRIAL This network monitoring system is based on SNMP, which provides the service with a network discovery routine, an inventory compiler, and a topology mapper. This system continuously checks on network devices for status issues. Get a 30-day free trial.
- ManageEngine OpManager – FREE TRIAL A monitoring package for network devices, servers, and cloud platforms that is also a good choice for mapping LANs, wireless networks, and WANs. Runs on Windows Server, Linux, AWS, and Azure. Start a 30-day free trial.
- Site24x7 – FREE TRIAL A cloud platform of system monitoring tools that covers networks, endpoints, and applications and also provides log management. Start a 30-day free trial.
- Paessler PRTG Network Monitor by Paessler – FREE TRIAL This package monitors networks, servers, and applications. Available as a SaaS platform or for installation on Windows Server. Start a 30-day free trial.
- Nagios XI This system monitoring package provides network, endpoints, and software performance tracking and it can be extended by free plug-ins. Runs on Linux, VMs, and Docker.
- Icinga This package is a fork of the free Nagios Core but performs as well as the paid Nagios XI. Runs on Linux and AWS.
- OpenNMS This is a network monitoring system (NMS) and it is packaged in free and paid versions. Both run on Linux.
Some of the drawbacks of Zabbix are:
- Requires quite a bit if tuning to adapt to your environment. But once done, it can be a great tool.
- Reporting tool could have been better, especially the reporting export feature.
- Uses a lot more resources when compared to other similar monitoring tools.
- Database has to be tuned well, otherwise it could large and unwieldy quickly.
- SNMP monitoring is a drag on the resources, as a lot of connections are made and used for this task.
- Steep learning curve associated with it.
If you think any of these shortcomings could impact you in a big way, you can consider alternative tools that are equally good, if not better.
The Best Zabbix Alternatives
Methodology for selecting the best Zabbix alternatives for network monitoring
Most organizations rely on Zabbix for tracking the performance and availability of all servers, applications, and networks in real-time. Zabbix is not, however, a perfect fit for every organization and has its own challenges and imperfections. This is why some organizations look for alternatives in the market. Here we have listed a few methodologies that one must keep in mind when selecting the best Zabbix alternatives for network monitoring.
- Check if your selected tool can automatically discover networks
- Can it create inventory and network maps automatically?
- Does it support tracking device status?
- Does it offer automated patch management functionality?
- Does your selected tool send instant alerts on detecting issues or problems?
As mentioned before, Zabbix is a great and comprehensive tool for network monitoring, but it is good to know the alternatives too, so you can make informed choices.
1. SolarWinds Network Performance Monitor – FREE TRIAL
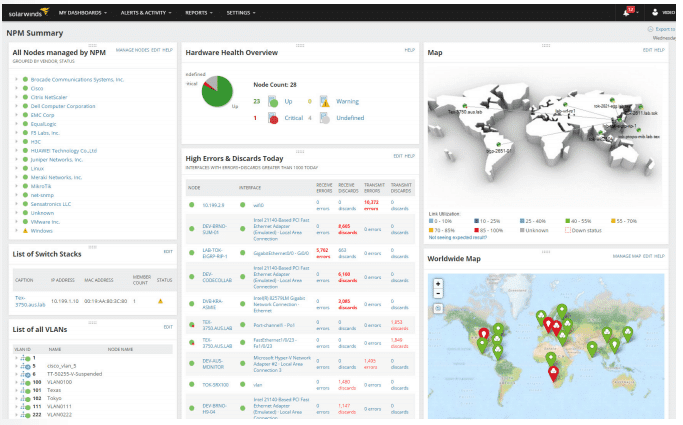
SolarWinds Network Performance Monitor (NPM) is a popular tool that comes from SolarWinds, a company known for its top-class monitoring tools.
Key Features:
- Quickly detects, diagnoses and resolve network issues.
- Integrated with NetPath to give you detailed analysis along critical paths.
- View performance, traffic and configuration details of all devices and applications located on-premises or in the cloud.
- Customizable and intelligent alerts make it possible to respond to conditions, events, topology and device dependencies.
- Drag and drop network performance metrics on a common timeline to quickly identify the root cause of a problem.
- Automatically discovers and maps devices, performance metrics and link utilization.
- Uses peak and average usage to automatically calculate exhaustion dates for different devices, helping with capacity planning.
- Easily identifies dead zones and improves the overall wireless coverage.
- Identifies if changes in end-user experience are caused by devices or network.
- Calculates baseline thresholds from historical network performance data.
- Monitors key metrics of hardware devices such as temperature and power supply, and sends alerts in case of any changes.
- Schedules and generates custom reports.
- Comes with more than 100 report templates to create reports that are ideal for any department or purpose.
- Creates interactive charts for your network and devices.
- User interface is simple and intuitive.
- Completely scalable to handle your growth
- Works well with Network Insight for Cisco Nexus, Cisco ASA and F5 BIG-IP to provide more visibility into network switches, firewalls and load balancers.
- Reduces unnecessary alerts, as you can determine what events should be alerted.
Why do we recommend it?
We recommend SolarWinds Network Performance Monitor for its comprehensive feature set that allows for quick detection and resolution of network issues. Its integration with NetPath and customizable intelligent alerts provide in-depth analysis and real-time responsiveness, making it a top-class monitoring tool.
System Requirements
You need the following system requirements to install and run SolarWinds NPM.
- CPU: Dual processor, 3.0 GHz
- Memory: 3 GB
- Hard drive: 20GB
- Operating System: Windows Server 2008 R2 SP1, Windows Server 2012 and Windows Server 2012 R2.
- Database: SQL Server 2008, 2008 SP1, 2008 SP2, 2008 SP3, 2008 SP4, SQL Server 2008 R2, 2008 R2 SP1, 2008 R2, SP3, SQL Server 2012, 2012 SP1, 2012 SP2, 2012 SP3, SQL Server 2012, 2014 SP1 and SQL Server 2016.
- .NET Framework: Version 4.5
Who is it recommended for?
SolarWinds NPM is best suited for IT professionals and network administrators who need exhaustive network monitoring capabilities. It’s particularly useful for large-scale enterprises with complex on-premises and cloud-based infrastructures, as well as for teams that rely on detailed reporting for network performance analysis.
Pros:
- Supports integration with NetPath that provides in-depth analysis along the crucial path
- Allows tracking performance and configuration details of all on-premises and cloud-based devices and applications
- Discovers and maps devices and applications automatically
- Uses historical network performance data to calculate baseline threshold
- Offers 100 report templates to create insightful reports
Cons:
- Does not support SaaS version
Download a 30-day Free Trial!
EDITOR'S CHOICE
SolarWinds Network Performance Monitor (NPM) stands out as our Editor’s Choice for its expansive and efficient network monitoring capabilities. Its quick issue detection, diagnosis, and resolution make it invaluable for IT professionals managing complex networks. The integration with NetPath offers detailed path analysis, enhancing visibility into network performance.
With features like customizable alerts, automatic device mapping, capacity planning tools, and over 100 report templates, SolarWinds NPM excels in delivering comprehensive network insights. Its user-friendly interface, scalability, and support for multiple network devices, including Cisco Nexus, Cisco ASA, and F5 BIG-IP, further enhance its appeal. Ideal for large enterprises and IT teams, it provides the tools needed for efficient network management and proactive issue resolution.
Download: Download a 30-Day Free Trial
Official Site: https://www.solarwinds.com/network-performance-monitor
OS: Windows Server 2008+, Linux, Cloud
2. ManageEngine OpManager – FREE TRIAL
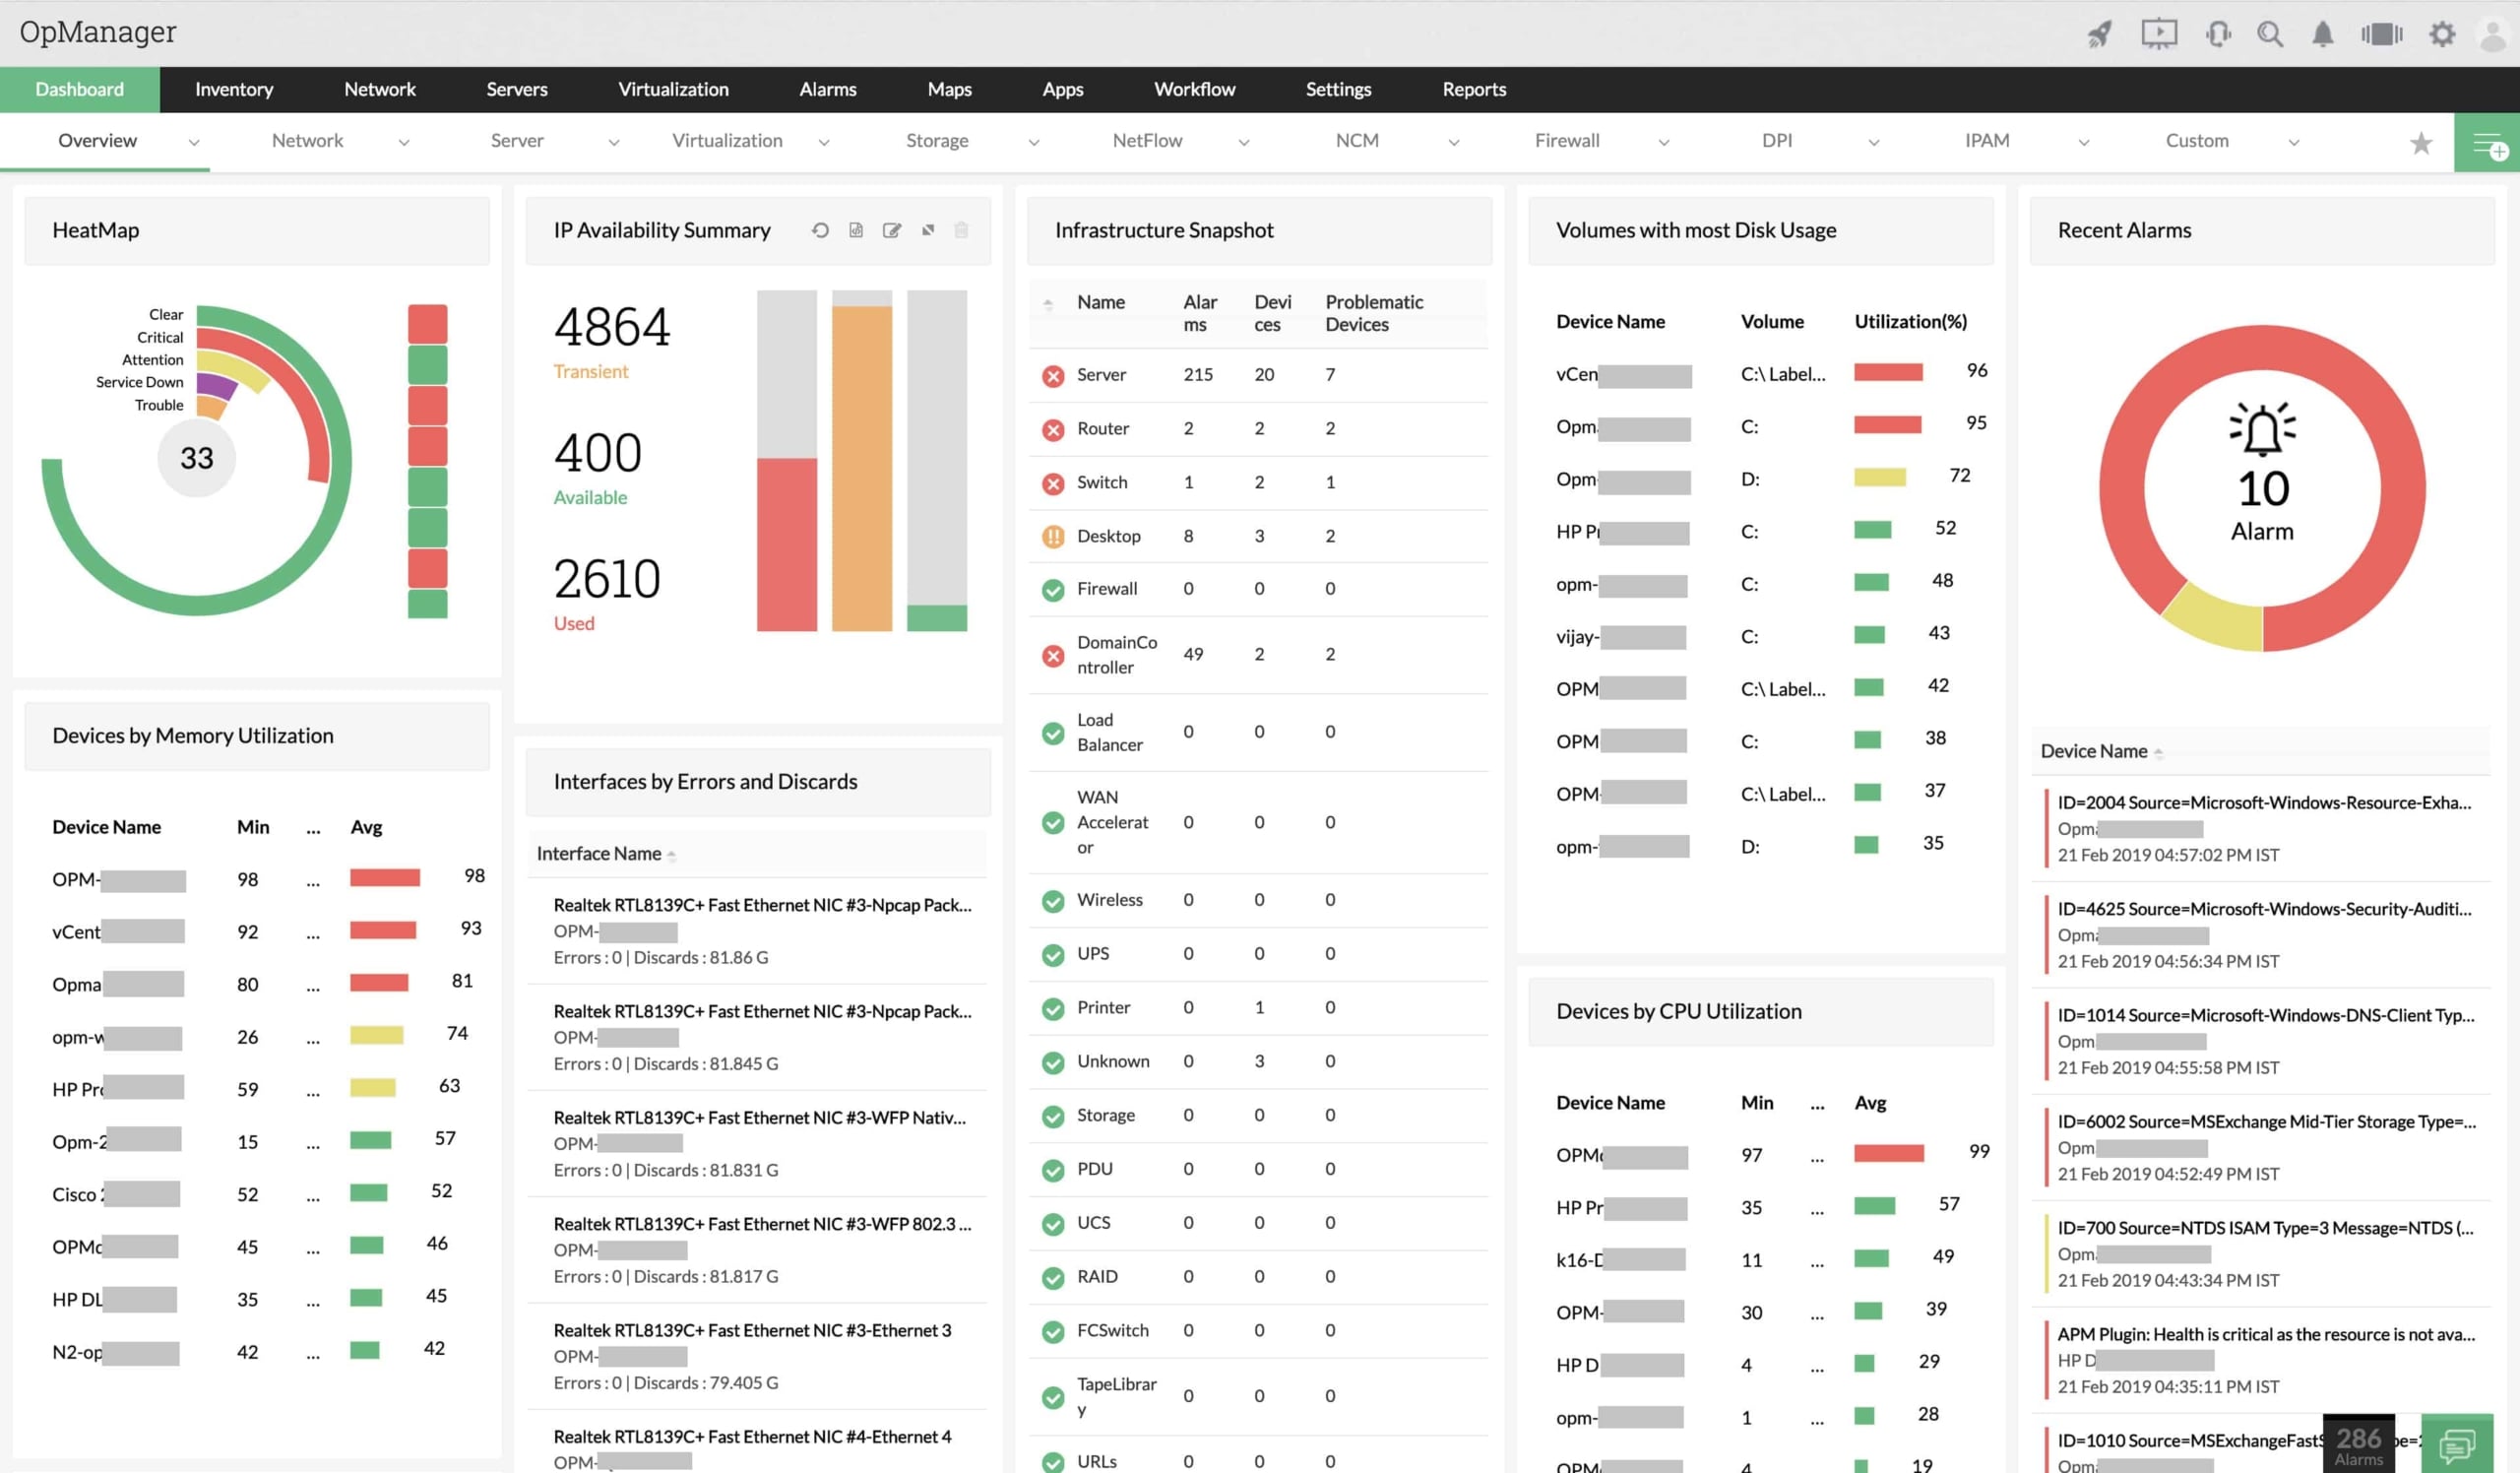
ManageEngine OpManager is a powerful and user-friendly network monitoring software that gives complete control over your network.
Key Features:
- Supports WAN, interfaces, bandwidth and router monitoring for performance and availability.
- Monitors VoIP call quality and troubleshoots poor VoIP calls across the entire WAN infrastructure.
- Automatically maps L1/L2 networks to identify network outages and any kind of performance degradation.
- Monitors WAN link availability, latency and performance across Cisco IP SLA technology.
- Monitors physical and virtual servers across different operating systems such as Windows, Linux, Unix, Solaris and more.
- Uses more than 70 VMware monitors for agentless monitoring of VMware virtualized servers.
- Uses WMI to monitor Microsoft Hyper -V hosts.
- Manages hosts, VMs and storage repositories of Citrix XenServer.
- Monitors and manages processes that run on discovered devices.
- Uses SNMP, WMI and CLI to monitor system resources and to gather data from the same.
- Performs first and second level troubleshooting tasks.
- Comes with a trap processing engine that is capable of handling more than 300 SNMP traps per second.
- Offers centralized eventlog monitoring to handle critical security logs across all Windows servers and workstations.
- Syslog monitor reads incoming syslogs and associates alerts to these syslogs.
- Comes with more than 100+ customizable reporting templates to analyze performance, usage, availability and more.
- Provides in-depth analysis on the capacity, performance and configuration of RAID devices.
- Monitors tape libraries to detect faults.
- Helps with capacity planning.
- Automatically discovers fabric switches in any SAN environment and generates alarms in case of any change in the status.
- Creates an exact replica of your 3D environment
- Offers many add-ons for network traffic analysis, network configuration manager, firewall log management and more.
- Scales up to 10,000 devices or 100.000 interfaces.
- Provides in-depth visibility into all your organization’s assets.
- Offers a unified network monitoring console for distributed infrastructure.
- Automatically discovers devices in your network.
- Installation is easy
Why do we recommend it?
We recommend ManageEngine OpManager for its comprehensive monitoring capabilities and user-friendly interface. The software covers a broad spectrum, from WAN and VoIP monitoring to server and asset management, making it a one-stop solution for network monitoring.
Who is it recommended for?
ManageEngine OpManager is ideal for medium to large enterprises that require detailed insights into their network and asset performance. It’s particularly useful for businesses that need real-time monitoring across various types of hardware and virtualized environments.
Pros:
- Easy to install and discover devices automatically in your network
- Provides comprehensive insight into all the assets in your company
- Performs live monitoring and shows all the data in the form of charts and graphs
- Monitors all activities on switches, routers, endpoints, etc., in real-time
- You can customize performance thresholds by changing their levels
Cons:
- No system management tools are available
- At times, the support team takes a little longer to respond
OpManager offers two editions, namely, Essential and Enterprise. Here is a look at the difference between them.
Feature | Essential | Enterprise |
|---|---|---|
| Devices | Ideal for 1000 devices | Ideal for 10,000 devices |
| Distributed network monitoring | No | Yes |
| Automatic L2 network map | Yes | Yes |
| Basic monitoring | Yes | Yes |
| Advanced monitoring | Yes | Yes |
| Plug-Ins | APM Plug-In | APM Plug-In |
| Cost | Starts at $715 for 25 devices | Starts at $19,975 for 500 devices |
Start a 30-day free trial.
3. Site24x7 – FREE TRIAL
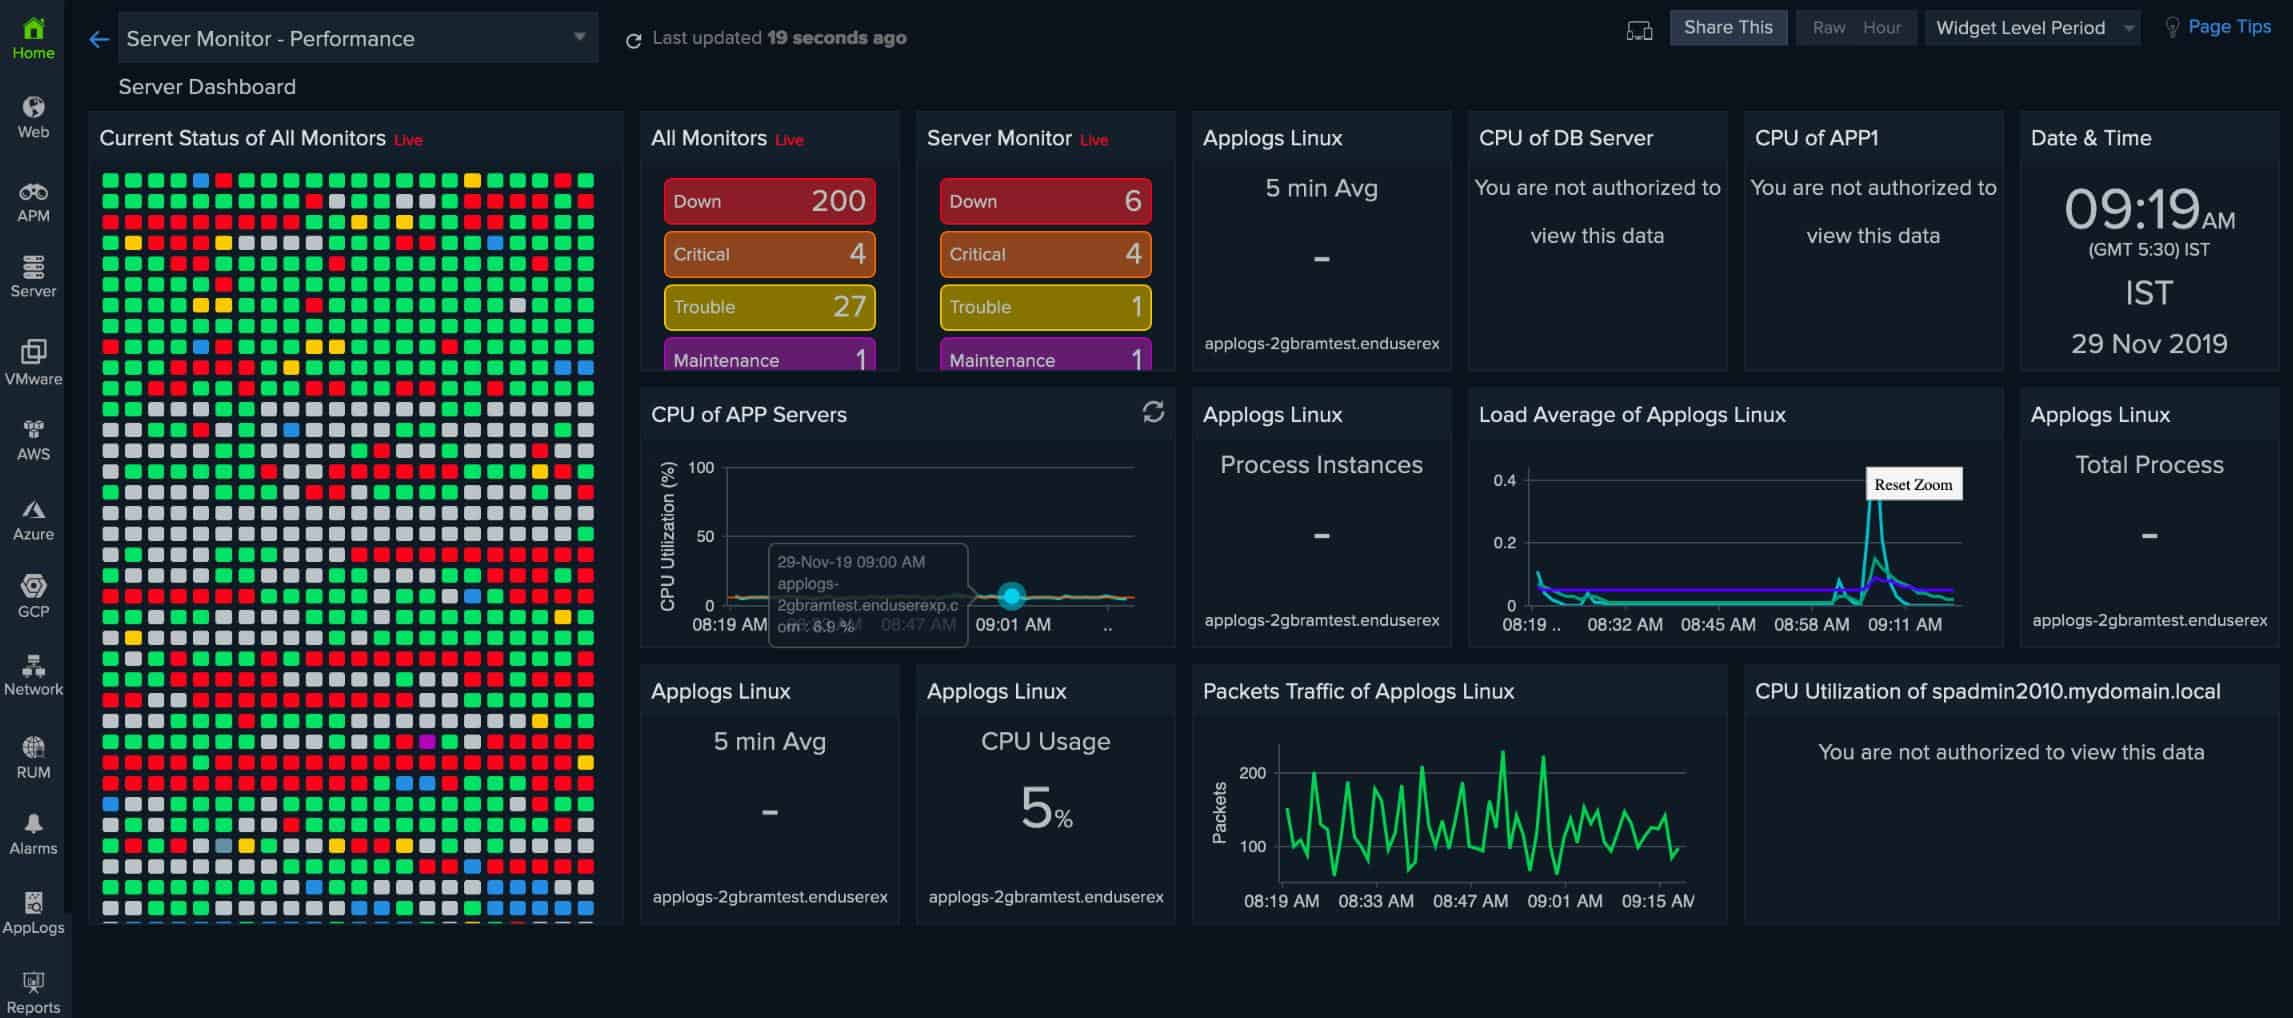
Site24x7 is a full-stack monitoring package that is a good alternative to Zabbix. The two big differences are that this system is not free and it is a SaaS package that is delivered from the cloud.
Key Features:
- Monitors network devices, network traffic, endpoints, cloud platforms, SaaS packages, websites, microservices, applications, services, server resources, and operating systems.
- Provides network discovery, hardware inventory management, and topology mapping
- Tracks wireless networks and WANs as well as LANs
- Uses the Simple Network Management Protocol (SNMP) for automated network device status monitoring
- Network traffic statistics are collected with NetFlow, J-Flow, sFlow, CFlow, IPFIX, NetStream, and AppFlow
- Quality of Service tracking and other metrics for VoIP connections
- Protocol analysis and top 10 talkers displayed
- Alerts for resource shortages and performance issues
- Assists with the planning of traffic shaping measures
- Network device configuration management
- Virtualization monitoring, including virtual infrastructure mapping
- Server resource monitoring
- Server processor activity tracking
- Storage array and cloud storage monitoring
- Monitoring for applications, services, and middleware, such as databases and Web servers
- Application performance monitoring
- Connection testing
- Web asset availability checks
- Distributed tracing for microservices
- Code profiling
- Automated response time testing for Web assets with synthetic monitoring
- Real user monitoring (RUM) for websites performance management
- Log management
- Multi-site monitoring within one account
- A multi-tenanted version for managed service providers
Why do we recommend it?
We recommend Site24x7 for its versatility in monitoring a wide range of elements, from network devices and traffic to applications and cloud platforms. As a cloud-based service, it is exceptionally easy to set up and provides comprehensive insights into network performance.
Who is it recommended for?
Site24x7 is ideal for businesses that require full-stack monitoring across various platforms, including network devices, servers, and cloud services. It’s especially suitable for managed service providers and organizations that rely heavily on multi-site and cloud-based operations.
Pros:
- A cloud-based service that is easy to set up
- Autodiscovery, network inventory, and topology mapping
- Provides both network device monitoring and traffic analysis
- Also monitors servers, services, cloud platforms, and software
- Website and Internet performance monitoring options
Cons:
- No self-hosting option
The Site24x7 system combines all of its monitoring modules in plans, so you don’t have to pay for each type of monitor separately. There are many plans and some of them have multiple editions, so the price list is very long. The Infrastructure plan, for example, has a starting price of $9 per month when paid annually. Site24x7 offers a 30-day free trial of all plans.
4. PRTG Network Monitor by Paessler – FREE TRIAL
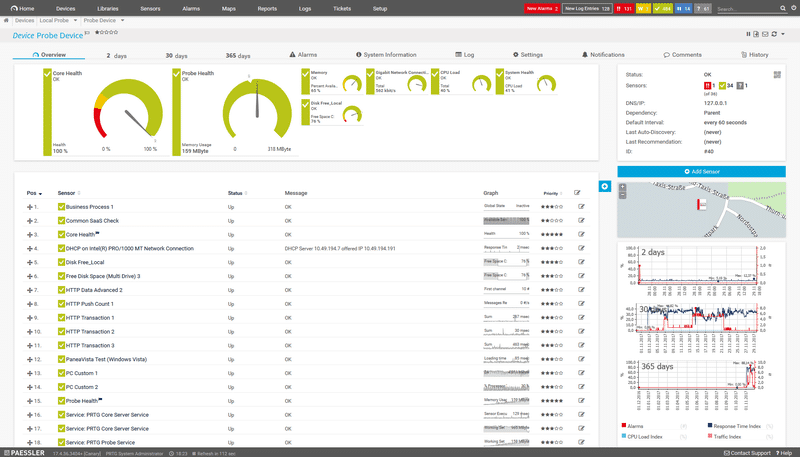
PRTG Network Monitor is a comprehensive tool that monitors all aspects of your IT infrastructure including your devices, systems, traffic and applications.
Key Features:
- Offers flexible alerting through ten different built-in technologies such as email, push, play alarm audio files, triggering HTTP requests and more.
- Schedules alerts and can even decide what events needed to be alerted to avoid alarm floods.
- Option to write your own custom notifications using PRTG API.
- Web interface is based on AJAX and comes with advanced features.
- Responsive design adjusts well to your device.
- Enterprise Console is a native Windows application for PRTG on-premises installations.
- Apps are available for both iOS and Android operating systems.
- All user interfaces are SSL secured and they can be used simultaneously.
- Comes with fail-over tolerant monitoring to avoid down-time. One failover is included in every PRTG license, ensuring that another node is connected when the primary system is down.
- You have the option to create your own dashboard with PRTG’s map designer. On this designer, you can integrate all the network devices and objects using the map designer’s 300+ map objects.
- Custom HTML can also be used to customize dashboards.
- Supports distributed monitoring, which means, you can monitor networks of the same organization that is spread across different locations.
- Provides in-depth reporting, so you can get information about pretty much anything in your network.
- Exports reports to HTML, CSV and XML formats for better processing.
- Reports can be scheduled based on your preferences.
- Languages suported include English, German, Spanish, French, Portuguese, Dutch, Japanese, and Simplified Chinese.
- Auto discovers devices and maps them to your network topology.
Why do we recommend it?
We recommend PRTG Network Monitor for its extensive monitoring capabilities and high level of customization. The tool not only covers all aspects of your IT infrastructure but also allows you to tailor dashboards and alerts to your specific needs.
Who is it recommended for?
PRTG Network Monitor is best suited for enterprises that require comprehensive and flexible monitoring solutions. The tool is particularly useful for organizations with complex IT infrastructures spread across multiple locations, as it supports distributed monitoring.
Pros:
- Enables you to use the PRTG API to create your own custom notifications
- Offers flexible alerting options and feature to play alarm audio files
- Users can customize the dashboard with custom HTML and map designer’s 300+ map objects
- Generates in-depth reports and allows exporting them in XML, CSV, and HTML formats
- Identifies devices automatically and maps them to your network topology
Cons:
- Patch manager is not available
PRTG offers tiered pricing, where the cost depends on the number of sensors you want to use.
- First 100 sensors – free
- 500 sensors – $1,600
- $1,000 sensors – $2,850
- 2500 sensors – $5,950
- 5000 sensors – $10,500
- Unlimited sensors on a single core installation – $14,500
- Unlimited sensors on five core installations – $60,000
- You can start with a 30-day free trial.
5. Nagios XI
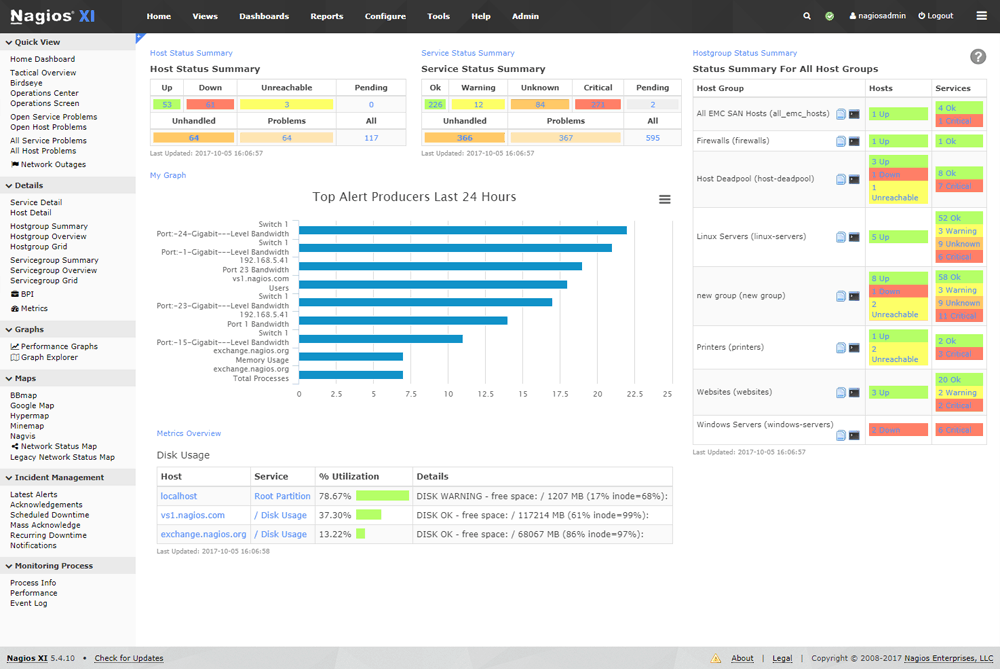
Nagios XI is a popular tool that’s ideal for monitoring mission-critical infrastructure and its components including applications, services, operating systems and more.
Key Features:
- Offers efficient and scalable monitoring.
- Web interface provides a highly customizable overview of network devices and hosts.
- Using advanced graphs, administrators can view network incidents and resolve them at the earliest.
- Detailed information on the usage levels of different devices help with capacity planning.
- Set up monitoring for any device with just a few clicks using the many configuration wizards.
- Auto discovers devices and adds them to the network map.
- Configurations can be saved or even archived, so you can reuse them at any time.
- Offers multiple APIs for easy integration with in-house and third-party applications.
- Community-developed add-ons also help to extend the functionality of Nagios XI
- Multi-user access to web interface makes it easy for different stakeholders to view the status.
- Easy to use and the interface is intuitive as well.
- Reporting templates to suit all departments and purposes.
Why do we recommend it?
We recommend Nagios XI for its scalability and efficiency in monitoring a wide range of infrastructure components, from applications and services to operating systems. The tool’s highly customizable web interface and advanced graphs make it easy for administrators to identify and resolve network incidents quickly.
System requirements
Nagios XI needs the following requirements to work.
- Hard drive – 20 GB
- Memory – 2 GB
- CPU – Dual core, 2.4 GHz
- Operating system – CentOS or Redhat Enterprise Linux versions 6 or 7
- Databases – MySQL, MariaDB and postgreSQL
Who is it recommended for?
Nagios XI is well-suited for organizations that have mission-critical infrastructure components needing constant monitoring. It is particularly beneficial for administrators and IT departments who want a customizable, multi-user interface for efficient troubleshooting and capacity planning.
Pros:
- Different stakeholders can easily view the status thanks to the web interface’s multi-user capability
- Users can store or achieve configurations for later use
- Nagios functionality can be extended with community-developed add-ons
- Performs capacity planning by running thorough knowledge of the consumption patterns of various devices
- Administrators can view network incidents and address them as soon as possible by using advanced graphs
Cons:
- The user interface of the free version is inadequate
- It would be nice to have more monitoring agents
There are two editions – standard and enterprise. While the standard edition costs $1,995, the enterprise edition costs $3,495.
Let’s briefly look at the features available in both the editions.
Standard edition
- Easy configuration wizards
- GUI configuration
- Advanced reporting
- Enhanced visualizations
- Custom user dashboards
- Custom user views
- Executive summary report
- Custom actions
- Dashboard deployment
- Notification escalations.
Enterprise edition
The Enterprise edition includes all the features in standard edition, plus the following.
- Scheduled reports
- Capacity planning reports
- Web-based server console access
- Bulk modification tools
- Audit logging
- Notification deployment
- SLA reports
- Scheduled pages
- Automated host decommissioning
You can download a free trial from here.
6. Icinga
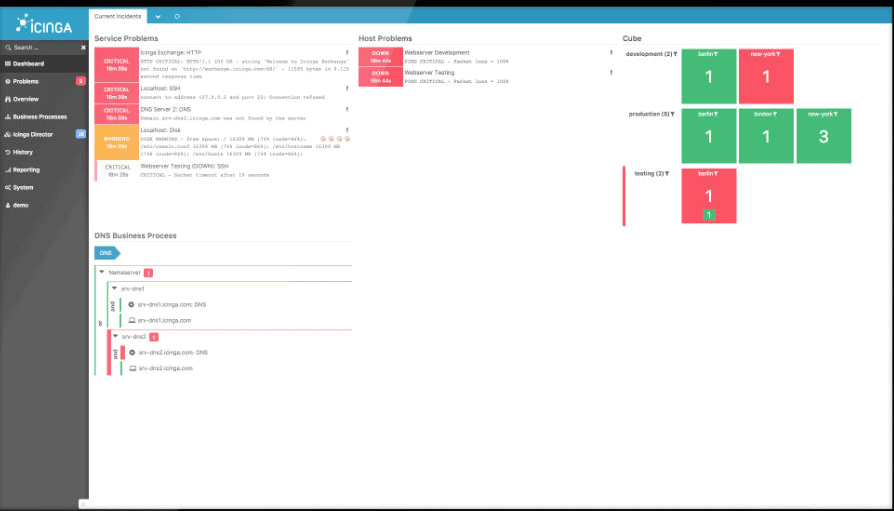
Icinga is an open-source network monitoring application that was originally created as a fork of the Nagios monitoring tool. It was meant to be an effort to correct the shortcomings in Nagios.
Key Features:
- Using its multithreaded design, Icinga can run thousands of checks each second.
- Fast and does not put much strain on the CPU.
- Ideal for large and complex environments, as it combines high-availability clusters with a distributed setup.
- Allows dynamic configurations
- You can apply different sets of rules to hosts and services to create a continuous monitoring environment.
- RESTful API helps to update your configurations on the fly.
- Supports Graphite and InfluxDB natively.
- Metadata information from Icinga provides better insight into the current and historical state.
- Alert notifications are sent through email, text message and mobile app.
- Web interface is fast and responds well to requests.
- Many modules and add-ons extend the capability of Icinga 2
- Authentication backends allow to identify users from multiple sources.
- Create custom views by grouping multiple panels into a single dashboard.
- History feature gives you access to all past data.
- Fine-grained permission control ensures that only authorized users can access
- Integrates well with Puppet, Ansible, Chef, Vagrant, elastic, InfluxDB. Graphite, Graylog, Grafana, Terraform, Foreman, OpsGenie and more.
Why do we recommend it?
We recommend Icinga for its ability to run thousands of checks each second without significant CPU strain, making it an ideal solution for large and complex environments. Its RESTful API, native support for Graphite and InfluxDB, and a plethora of integration options set it apart as a versatile and powerful tool.
Who is it recommended for?
Icinga is best suited for organizations that require high-availability clusters in complex and large-scale environments. It’s particularly useful for IT teams who value fine-grained permission control and the ability to integrate the tool seamlessly with other platforms like Ansible, OpsGenie, and Graphite.
Pros:
- Supports integration with Graphite, Ansible, OpsGenie, etc.
- Only users with permission are allowed access thanks to fine-grained permission management
- You can extend Icinga 2’s functionality using several modules and add-ons
- You can access all previous data using the history feature
- Users can get a better understanding of the current and past status with the metadata data from Icinga
Cons:
- No SaaS versions are available with Icinga
- The setup process can be challenging and confusing for some users
Icinga is 100% Free.
7. OpenNMS

OpenNMS is a highly integrated open-source platform designed to build network monitoring solutions.
Key Features:
- Identifies latency issues and reports them right away.
- Tracks availability of different devices, measures the response time, and detects node and interface outages, so you can stay on top of the performance of your devices.
- Uses an event-driven architecture to send alarms and notifications.
- Allows you to define critical paths to ensure that alarms are sent out only for the critical components.
- Comes with a flexible dashboard.
- Auto discovers devices and adds them to the topology map.
- Easy integration with many third-party tools
- In-depth analysis of root cause and impact
- Provisioning of resources and capacity planning.
Why do we recommend it?
We recommend OpenNMS for its event-driven architecture that enables immediate reporting of latency issues and outages. This feature, along with the ability to specify critical paths for alarms, makes it a highly responsive and tailored monitoring solution.
Who is it recommended for?
OpenNMS is ideal for businesses that require real-time monitoring with immediate alerting capabilities. It is especially useful for organizations looking for a customizable, open-source network monitoring solution that can integrate easily with third-party tools for a comprehensive overview.
Pros:
- Detects latency issues and immediately reports them
- Automatically detects devices and inserts them into the topology map
- Enables you to specify important pathways so that only the essential components receive alarms
- Sends alarms and notifications using an event-driven architecture
- Tracks device availability and identifies node and interface outages
Cons:
- More online configuration is required than via the command line
- OpenNMS does not offer a SaaS version
OpenNMS comes in two editions – Meridian and Horizon. Though both are built from the same source code, the release cycle and support options are different.
Let’s look at the differences between these two editions:
Feature | Meridian | Horizon |
|---|---|---|
| Environment | Enterprises and businesses looking for stable platforms with long term support | Monitoring of new technologies and IT ecosystems such as Docker, SDN/NFV, and virtual systems |
| License | AGPLv3 or proprietary license | AGPLv3 |
| Release cycle | 12 months | 3 to 4 months |
| Features | Features chosen for level of stability, usefulness and quality of integration with existing code | Exploration of new technologies to test value to drive rapid advances in management technology |
| Maintenance | Access to update server for latest bug fixes and performance enhancements | Driven by the community |
| Configuration | Preconfigured events, notices, data collection, workflows and reports | User and community configured and maintained |
| Cost | Yearly subscription | Free |
Download the free version.
Conclusion
In short, Zabbix is a great tool for monitoring your network, but it comes with its own shortcomings that makes it not-so-ideal in certain environments and situations. It is good to know some alternative choices, so you can plan better if you looking to migrate away from Zabbix to a new platform.
We hope the above information will help you to make the right decisions that would augur well for your organization – Finding a Zabbix Alternative can be a daunting task, but we hope that one of the choices above works out well for you –
Our Recommendation?
We recommend you download several of the software packages above and properly configure and deploy them in your network to get a feeling of their Pro’s and Con’s – As not all of these products support each individual’s infrastructure as they should.
SolarWinds NPM & PRTG Network Monitor are the favorites due to their Massive Feature Sets and Support communities that are built around. They both have 30-day trials that allow you to download, install, and configure them in your networks before making a commitment! Download below to get started with either one of them!
