

Nagios, one of the most popular tools for network monitoring, comes with its own share of problems as well. One of the most prominent problems is that it is difficult to setup and maintain as all configurations should be done only through config files. This can be cumbersome and time-consuming. We take a look at the best Nagios alternatives.
Here is our list of the best Nagios Alternatives:
- Zabbix – Best for enterprise custom scripting and predictive alerts
- Icinga – Best for Nagios users wanting improved scalability and UI
- SolarWinds NPM – Best for hybrid networks needing fast root-cause diagnosis
- OpenNMS – Best for large distributed networks with event-driven architecture
Also, many IT administrators prefer to work with a Windows-style GUI instead of Linux and Unix commands, and this is a spot of bother in Nagios. Other problems include its auto-discovery of applications and services, complicated management, and more. Due to these aspects, it is good to know your alternative options, especially if your IT admin team prefers it.
Our methodology for selecting the best network monitoring tool
We reviewed the market for Nagios alternatives and analyzed tools based on the following criteria:
- Efficiency in problem detection and resolution
- Support for diverse network environments, including cloud, on-premises, and hybrid setups
- User-friendliness in installation, setup, and daily operation
- Ability to provide detailed, actionable intelligence through alerts and reports
- Compatibility with a wide range of systems and devices for comprehensive monitoring
The Top Alternatives to Nagios
Though Nagios is one network monitoring tool, there are many other tools that could give Nagios a run for its money. In this guide, we will look at some of the alternatives for Nagios but if you’re using Linux you might want to skip straight to the best Linux Monitoring Software.
1. Paessler PRTG Network Monitor by Paessler – FREE TRIAL
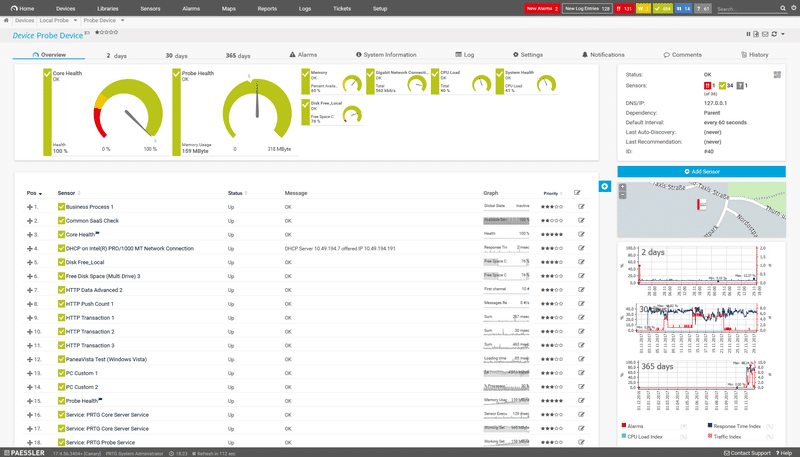
Paessler PRTG Network Monitor by Paessler is a powerful solution that analyzes your entire infrastructure to give you a comprehensive idea of the weak points and the performance of devices in your network.
Key Features:
- Aggregated Statistics of Many Parameters: Including status, availability, CPU load, and bandwidth to get a quick overview of the status of your network
- Packet Sniffing: Examines every single packet of data passing through your network to understand the possible problems that are increasing your bandwidth
- Supports NetFlow, sFlow and jFlow
- Monitoring by Sensors: Arranged in a tree-like hierarchy to make navigation easy
- Sends Alarms and Unusual Alerts: Based on the threshold values you have set; red signifies alarms, yellow markings are warnings, and orange is used to depict when there is an unusual reading from any device
- Auto Discovers Sensors and Devices: Scans your network and even maps all of it for you
- Report Templates: A unique template is the “Top 10 Lists”, which it lists devices that fall into different categories such as best and worst performance, fastest and slowest performance, highest and lowest bandwidth use, highest and lowest CPU load, and more
- Comprehensive Reports: Can be used to analyze historic results over a specific day, month, or year, either on demand or scheduled
- Remote Probes: Allows you to do a long-term comparison of the performance of your applications
- “Maps” Feature: Allows you to create web pages with monitoring information, in a customizable layout. This feature opens up countless possibilities to stay on top of your network
- Scaled for Networks of Any Size: Whether you want to use 100 or 10,000 sensors, this tool will work for you
- 10 Built-in Technologies for Sending Alerts: Includes email, push, play alarm audio files, trigger HTTP requests, and more
- Full-Featured AJAX-based Web Interface
- Support for Multiple OS: Apps for both Android and iOS
- User Interfaces are SSL-Based: Local and remote access can be done simultaneously
- Failover Tolerant Monitoring: One single failover is included in every PRTG license, and failover handling happens automatically and doesn’t require your intervention
- Monitors Many Networks: Spread across different locations, provided they are all a part of your organization
- Remote Probes: Used to distribute monitoring loads
- Extensive File Format Support: Export your data in many file formats such as PDF, XML, HTML, and CSV
- Language Support: English, German, Spanish, French, Dutch, Russian, Japanese and Simplified Chinese
Why do we recommend it?
We recommend Paessler PRTG Network Monitor for its holistic approach to network monitoring, with features that provide aggregated statistics, packet sniffing, and customizable alerts. Its scalability ensures it can handle networks of any size, and detailed reporting offers historic data analysis.
System Requirements
The system requirements depend on the number of sensors installed.
Number of sensors | CPU | Memory | Disk space | User accounts |
|---|---|---|---|---|
| Up to 1,000 sensors | 2 CPU cores | 3 GB RAM | 250 GB | Less than 30 |
| 1,000 to 2,500 sensors | 3 CPU Cores | 5 GB RAM | 500 GB | Less than 30 |
| 2500 to 5000 sensors | 5 CPU Cores | 8 GB RAM | 1 TB | Less than 20 |
| 5000 to 10,000 sensors | 8 CPU Cores | 16 GB RAM | 2 TB | Less than 10 |
Price: The cost depends on the number of sensors you want to use. Here is a breakup of the cost, based on sensors.
- 100 sensors – free
- 500 sensors – $1,600
- 1000 sensors – $2,850
- 2500 sensors – $5,950
- 5000 sensors – $10,500
Who is it recommended for?
This tool is recommended for IT managers, network administrators, and businesses seeking granular control over their network monitoring. It is well-suited for organizations that require both real-time and historic data for performance analysis, and who operate networks with a variety of scales and complexities.
Besides these plans, PRTG also offers two plans called XL1 Unlimited and XL5 Unlimited. In XL1 Unlimited, you can install any number of sensors on one core installation while in XL5 Unlimited, you can install any number of sensors on five core installations.
Pros:
- Advanced Fault Monitoring
- Supports on-premises, cloud, hybrid environments
- Quick installation and intuitive use
- Intelligence-based alerts and customizable thresholds
Cons:
- Requires Windows Server environment
You can start with a 30-day free trial.
2. ManageEngine OpManager – FREE TRIAL
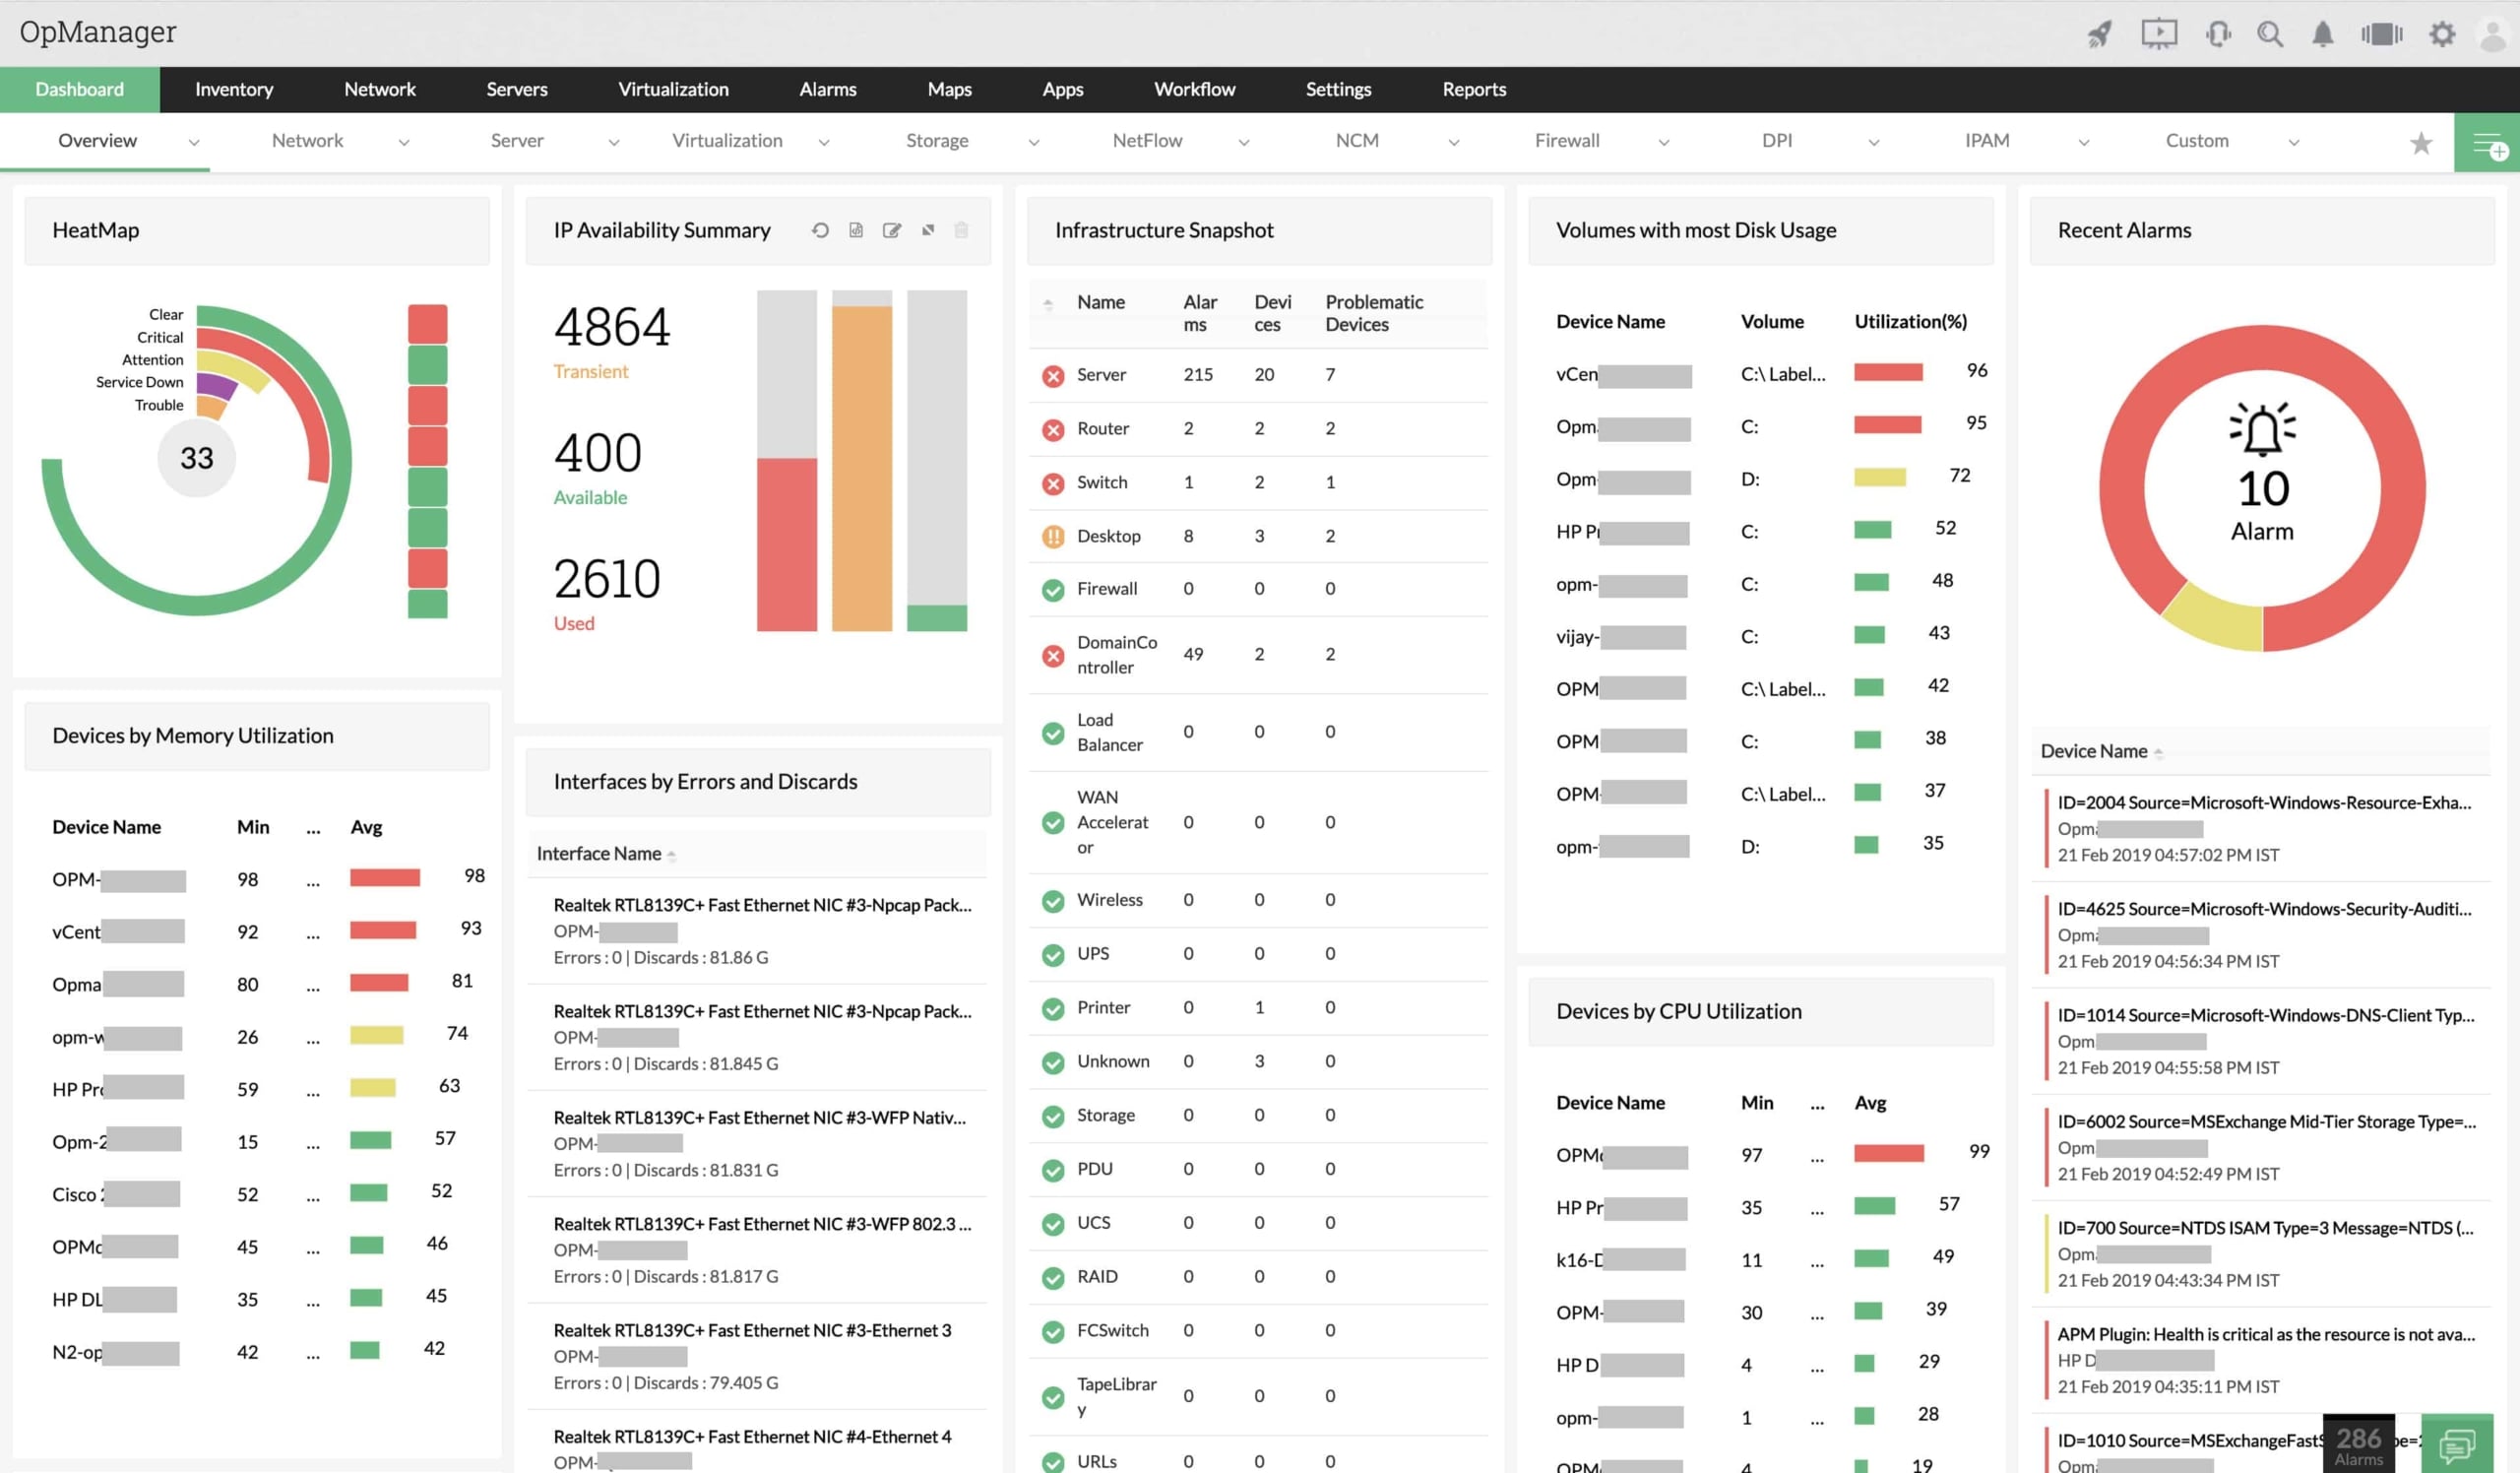
ManageEngine OpManager is a powerful and user-friendly network monitoring software that efficiently monitors even the most complex of networks.
Key Features:
- Monitors routers, WAN links, interfaces, bandwidth, and more.
- Monitors VoIP call quality throughout the WAN infrastructure. It can even troubleshoot low-quality VoIP problems.
- Visualizes and resolves WAN or router problems.
- Maps the entire network to identify outages and performance issues.
- Always monitors WAN availability, latency, and performance using Cisco IP SLA technology
- Monitors both physical and virtual servers running different operating systems like Windows, Linux, Unix, Solaris, VMware, and more.
- Uses 70 different VMware monitors to monitor VMware devices.
- Uses WMI credentials to monitor Microsoft Hyper-V hosts.
- Monitors and manages the storage repositories of Citrix XenServer.
- Monitors processes that run on SNMP/WMI and CLI.
- Uses different protocols such as SNMP, WMI, and CLI to monitor resources and gather performance data.
- Helps to automate first-level troubleshooting steps.
- Comes with a rule-based trap processing engine that can handle more than 300 SNMP traps per second.
- Centralizes event log monitoring to monitor all critical security logs.
- Makes it easy for you to analyze systems trends and performance with its customized reports and templates.
- Gives deep insights into the performance and configuration of RAID devices.
- Monitors tap libraries to detect fault conditions and generate alarms.
- Analyzes historic as well as current usage trends.
- Automatically discovers fabric switches in your SAN environment.
- Scales to accommodate up to 10,000 devices and ensure high availability of the same.
- There is robust communication between the central and probe servers deployed in remote sites.
- You can get the log data generated by firewalls to get crucial information related to the security of your network.
- You can schedule configuration backups whenever required.
- Helps with switch port and IP address management.
Why do we recommend it?
We recommend ManageEngine OpManager for its extensive feature set that includes monitoring of routers, WAN links, VoIP call quality, and both physical and virtual servers across multiple operating systems. Its capacity to automate first-level troubleshooting adds an extra layer of efficiency.
Who is it recommended for?
ManageEngine OpManager is ideal for organizations with complex network infrastructures that include a mix of physical and virtual servers, various operating systems, and VoIP services. Its strengths in WAN monitoring and troubleshooting make it a strong candidate for businesses reliant on wide-area networks.
Pros:
- Monitors routers, WAN links, interfaces
- Automates first-level troubleshooting
- In-depth VoIP quality monitoring
- Supports various operating systems
Cons:
- May be complex for small-scale networks
You can start by downloading a 30-day free trial.
3. Site24x7 – FREE TRIAL
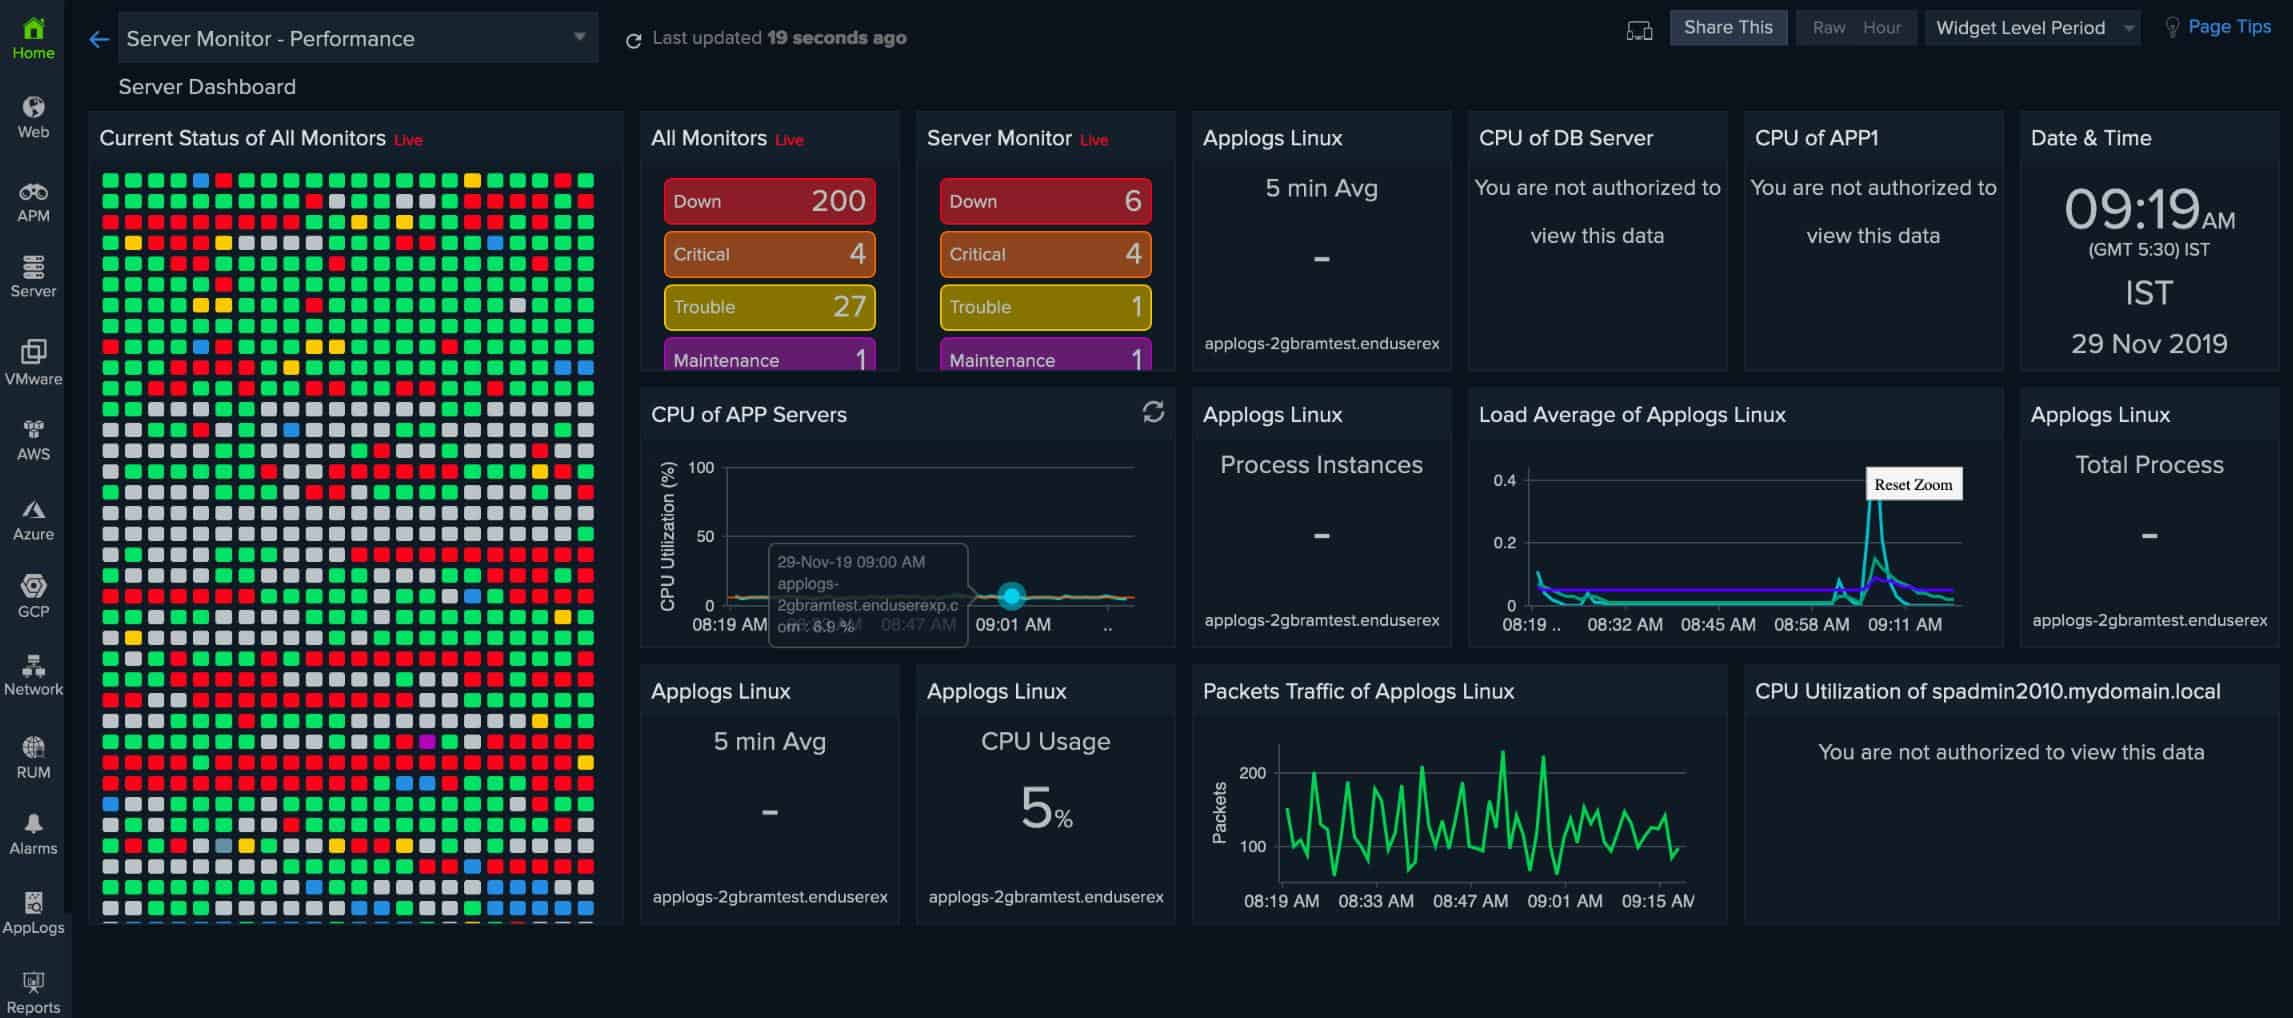
If you like the full-stack monitoring capabilities of Nagios but you want to use a SaaS bundle instead of an on-premises software package, you should consider the cloud-based Site24x7.
Key Features:
- Modules for network device monitoring and traffic analysis that provide network discovery, inventory creation, and topology mapping
- Constant network performance monitoring with the Simple Network Management Protocol (SNMP)
- Network traffic statistics gathering with NetFlow, J-Flow, sFlow, CFlow, IPFIX, NetStream, and AppFlow
- Quality of Service tracking for VoIP connections
- Protocol analysis
- Alerts for system performance drops or resource exhaustion
- Support for traffic shaping measures, such as queueing
- Network device configuration management
- Monitoring for cloud platforms, SaaS packages, and virtualizations
- Server resource monitoring
- Server processor activity monitoring
- Monitoring for storage arrays and cloud storage
- Internet connection testing between sites and to cloud systems
- Monitoring for applications, such as databases and Web servers
- Application performance monitoring that includes distributed tracing for microservices and code profiling
- Website availability testing
- Synthetic monitoring to check on the response times of various elements in a Web page
- Real user monitoring (RUM) to track the performance of websites
- Log management
- The ability to track assets on multiple sites in one account
- A multi-tenanted version for managed service providers
Why do we recommend it?
We recommend Site24x7 for its comprehensive full-stack monitoring capabilities that extend from network devices to cloud platforms and applications. Its versatility in gathering network traffic statistics and implementing traffic shaping measures sets it apart.
Who is it recommended for?
Site24x7 is an excellent choice for businesses that rely heavily on multi-layered IT infrastructures, including cloud platforms and SaaS packages. It’s also particularly beneficial for managed service providers due to its multi-tenant capabilities.
Pros:
- Comprehensive full-stack monitoring
- Detailed network traffic statistics
- Supports traffic shaping, protocol analysis
- Effective for cloud, SaaS monitoring
Cons:
- Can be overwhelming for basic monitoring needs
The Site24x7 system is offered in many plans. The starting price to get all of the modules on the platform is $9 per month when paid annually. You can get access to all of the modules on the platform with a 30-day free trial.
4. Zabbix
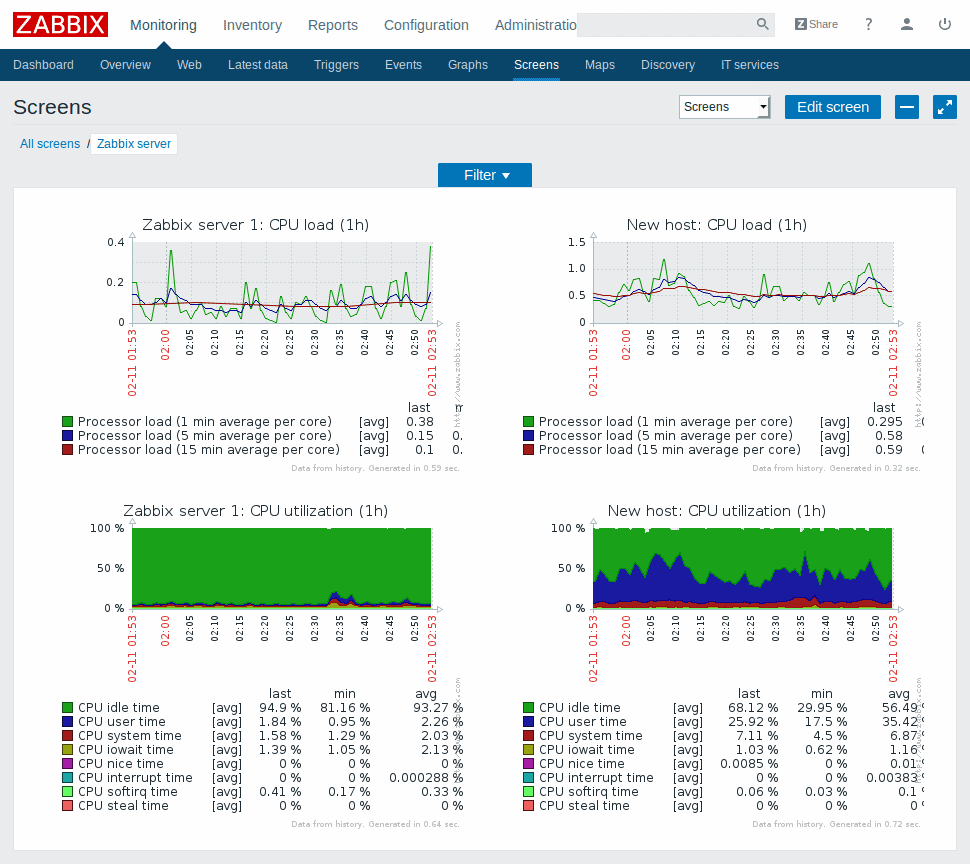
Zabbix is an enterprise-class monitoring system that is designed for monitoring different devices on a network.
Key Features:
- Collects metrics from any device, system, or applications.
- Native Zabbix agent, created using C language, runs on Unix, Linux and Windows to collect information such as CPU, memory, and CPU interface.
- Collects data from devices with SNMP agent versions v1, v2, or v3 as well as printers, NAS and UPS.
- Supports IPMI agents to get important information from hardware.
- Create custom agent checks.
- Custom scripts written in any language such as Perl, Python, and Ruby help to extend the functionality of this tool.
- Offers predictive functions that analyze incoming data to predict problems, so you can get to them proactively.
- Retrieve and manage historical and configuration data.
- Provides flexible and intelligent threshold definition options to minimize false positives and focus on the main issues.
- Trigger expression can be created with data obtained from different devices.
- Offers historical data analysis
- Takes into account the dependencies before sending out an alert.
- Integrate Zabbix with third-party software.
- Sends notifications through many channels. You can even configure the channel for each kind of notification. For example, you can program the system to send you alerts through SMS if the criticality level is severe and through email, if it’s moderate.
- Comes with a native web interface that makes it easy to access information from anywhere.
- Create any report with this tool.
- Web interface is the single point for configuration and for viewing all reports.
- Supports Unicode/UTF-8 for a local flavor.
- Works well on most modern browsers like Chrome, Firefox, Safari, Internet Explorer, Konqueror, and Opera.
- Conduct a global search at any time.
- Interface comes with a host of themes, so you can customize it to match your preferences.
- Strong encryption between all Zabbix components.
- Uses multiple authentication methods such as LDAP and Active Directory.
- Code is open for security audits.
- Installation is easy and can be done within minutes.
- Configuration templates help to monitor thousands of devices on your network.
- Zabbix community has built hundreds of templates, allowing you to also build custom templates.
- Scans your network periodically to discover new devices and updates the topology map accordingly.
- Automatically starts monitoring new equipment, once they are discovered.
- Monitors behind firewall DMZ.
- Run scripts remotely on monitored hosts.
- Collects data even when there are network issues.
- Zabbix management can be done through APIs.
- Create new applications to work in Zabbix.
Why do we recommend it?
We recommend Zabbix for its robustness in monitoring a wide array of devices and systems, including SNMP and IPMI agents. The tool’s predictive functions for proactive issue identification and flexible threshold options make it a comprehensive solution for network monitoring.
Supported platforms
Zabbix works well on the following platforms.
Platform | Zabbix Server | Zabbix Proxy | Zabbix Agent |
|---|---|---|---|
| Linux | Yes | Yes | Yes |
| IBM AIX | Yes | Yes | Yes |
| IBM Power8 | Yes | Yes | Yes |
| FreeBSD | Yes | Yes | Yes |
| NetBSD | Yes | Yes | Yes |
| OpenBSD | Yes | Yes | Yes |
| HP-UX | Yes | Yes | Yes |
| Mac OS X | Yes | Yes | Yes |
| Solaris | Yes | Yes | Yes |
| Windows | No | No | Yes |
Who is it recommended for?
Zabbix is highly recommended for enterprise-level organizations that require extensive monitoring across various device types and systems. Its support for custom agent checks and third-party software integrations make it a versatile option for businesses with complex and diverse network environments.
Pros:
- Robust monitoring for diverse devices
- Predictive functions for proactive issue identification
- Supports custom agent checks
- Flexible threshold options for alerts
Cons:
- May require technical expertise for setup
It is open-source and free to use. We’ve also written a post about the best Zabbix Alternatives.
5. Icinga
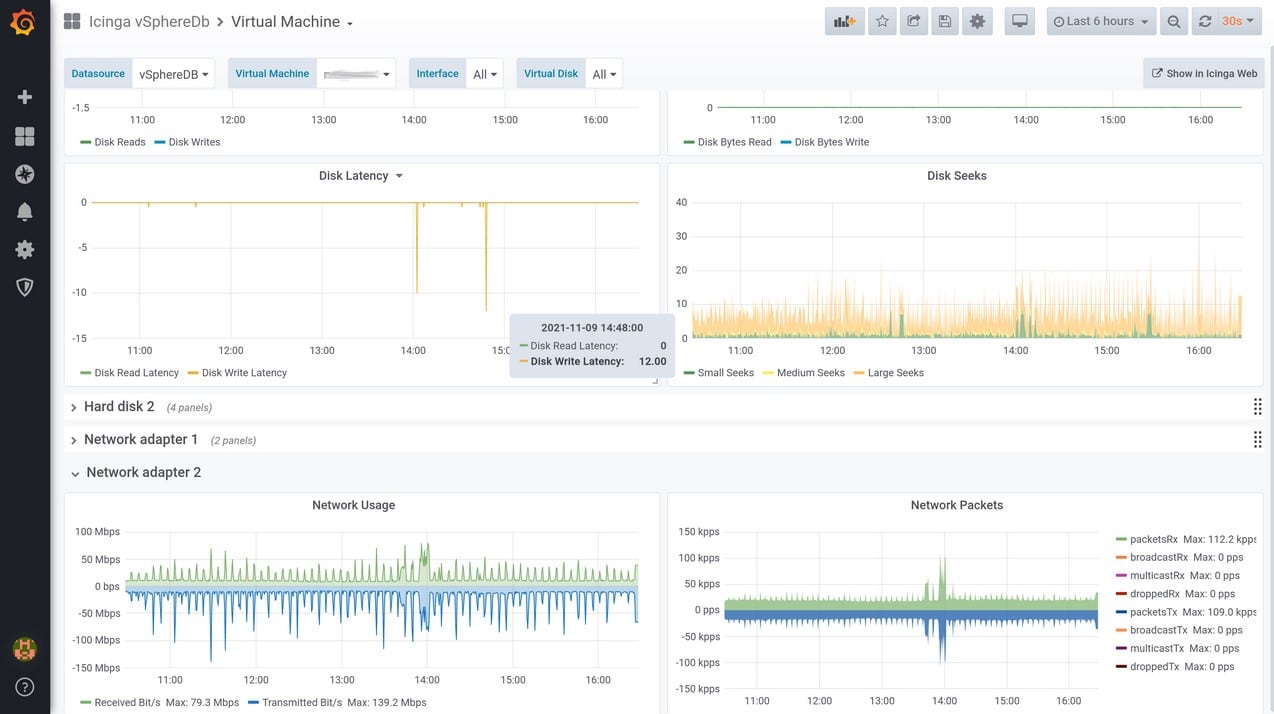
Icinga is an open-source network monitoring application that was originally created as a fork of the Nagios monitoring system. It was started to correct the shortcomings of the Nagios monitor and to add new features. It takes its name from a Zulu word that means examines, browses or looks for.
Key Features:
- Scales up to thousands of nodes in a quick and reliable way.
- Reporting module comes with an improved SLA, database connectors for PostgreSQL, and distributed systems to ensure redundant monitoring.
- Monitors network services, host services, and server components.
- Parallel service checks
- Simple plug-in design, so you can easily develop your own service checks.
- Define network host hierarchy, so there is a distinction between hosts that are way down and unreachable.
- Run defined handlers for proactive resolution of problems.
- Alerts can be escalated to other users or to other communication channels.
- Many channels through which notifications can be sent.
- Two optional web interfaces; Icinga Classic UI and Icinga Web.
- Reporting module is based on the open-source Jasper Reports.
- Many reporting templates including those for capacity planning.
- Multithreaded design, so thousands of checks can be run simultaneously.
- Distributed setup makes Icinga ideal for large and complex environments.
- Rules can be applied to hosts and services to create a continuous monitoring environment.
- RESTful API makes it easy to update your configurations or show the details you want, the on-the-fly.
- Supports Graphite and InfluxDB natively.
- Better insights into the performance of your devices with Icinga’s metadata.
Why do we recommend it?
We recommend Icinga for its scalability, offering reliable performance even for networks with thousands of nodes. Its distributed setup and RESTful API support make it adaptable and easy to configure, providing robust and continuous monitoring.
Who is it recommended for?
Icinga is best suited for larger organizations with complex, distributed environments. The system’s multithreading and rules-based monitoring make it highly customizable, an ideal fit for businesses that require a tailored, comprehensive monitoring solution.
Pros:
- Scalable for large networks
- Distributed setup for complex environments
- RESTful API for easy configuration
- Supports Graphite and InfluxDB natively
Cons:
- Interface might not be user-friendly for beginners
It is open-source and free to use.
6. SolarWinds Network Performance Monitor
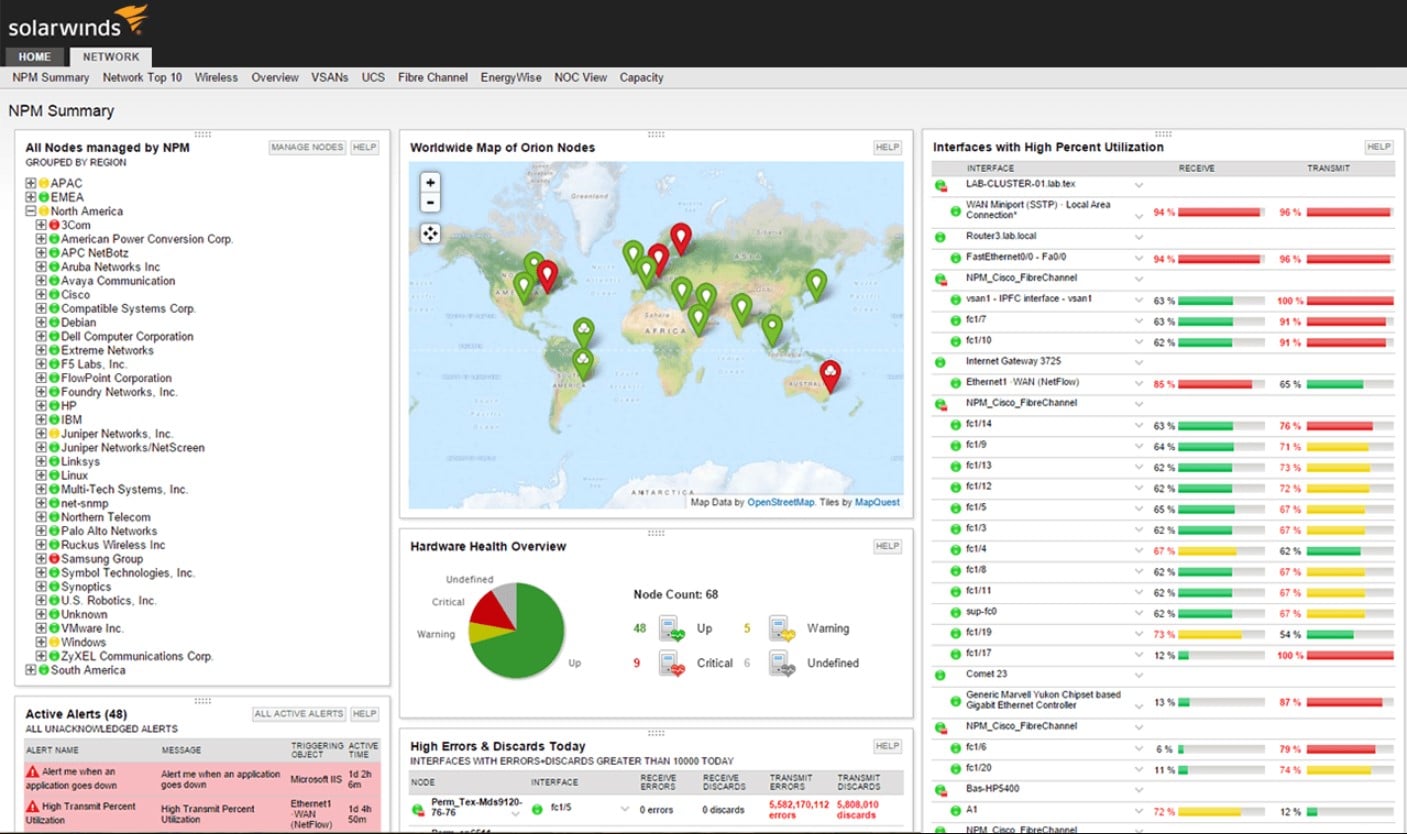
SolarWinds Network Performance Monitor is a powerful tool for network monitoring, as it helps to quickly detect, diagnose, and fix any network-related problems and outages.
Key Features:
- Advanced Fault Monitoring: Quickly identify problems, understand their root cause, and fix them at the earliest
- Monitor Performance and Availability of Devices: Including on-premises, in the cloud, or in a hybrid environment
- Identifues Root Cause Problems: Drag and drop different performance metrics on a timeline to identify at earliest opportunity
- Provides Intelligence-Based Alerts: Takes into account several parameters such as topology, dependencies, and performance
- Auto-Discovery: Automatically discovers and maps devices in the network topology
- Customize Thresholds: According to peak and bandwidth usage
- Monitors Performance: As well as availability of the F5 BIG-IP family of products
- Installed and Deployed Rapidly: Setup and use are well-documented and are fairly intuitive as well
- Automates Capacity Planning
- Web-Based Performance Charts: Stay on top of your network’s performance from anywhere
- Helps Identify Changes: Either in end-user experience or caused by the network or application
- Calculates Baseline Thresholds: Pools from historical performance data
- Monitors Key Metrics of Hardware Components: Including temperature, fan speed, and power supply
- Reporting Templates: Comes with more than 100 templates for reporting
- Interactive Charts and Graphs: Get a better understanding of your devices’ performance
Why do we recommend it?
We recommend SolarWinds Network Performance Monitor for its robust and comprehensive set of features, ranging from advanced fault monitoring to customizable thresholds and web-based dashboards. The tool excels in real-time problem diagnosis and offers a quick setup, making it a highly effective solution for network monitoring.
System Requirements
You need the following system requirements to install SolarWinds Network Performance Manager.
- Database:
- .NET Framework: Version 4.5
- Operating system: Windows Server 2008 R2 SP1, Windows Server 2012 and Windows Server 2012 R2.
- Hard drive: 20GB free disk space
- Memory: 3GB
- CPU: Dual processor, 3.0 GHz
- Databases Supported:
- SQL Server 2008, 2008 SP1, 2008 SP2, 2008 SP3 and 2008 SP4
- SQL Server 2008, R2 SP1 and R2 SP2
- SQL Server 2012, 2012 SP1, 2012 SP2 and 2012 SP3
- SQL Server 2012, 2014 SP1
- SQL Server 2016
Who is it recommended for?
SolarWinds Network Performance Monitor is ideal for network administrators, IT professionals, and businesses of all sizes that need in-depth network monitoring and quick problem resolution. It’s especially useful for those who manage complex, hybrid environments that include on-premises, cloud, and mixed infrastructures.
Pros:
- Advanced Fault Monitoring
- Supports on-premises, cloud, and hybrid environments
- Quick installation and intuitive use
- Intelligence-based alerts and customizable thresholds
Cons:
- Requires Windows Server environment
Start a 30-day free trial download!
7. OpenNMS
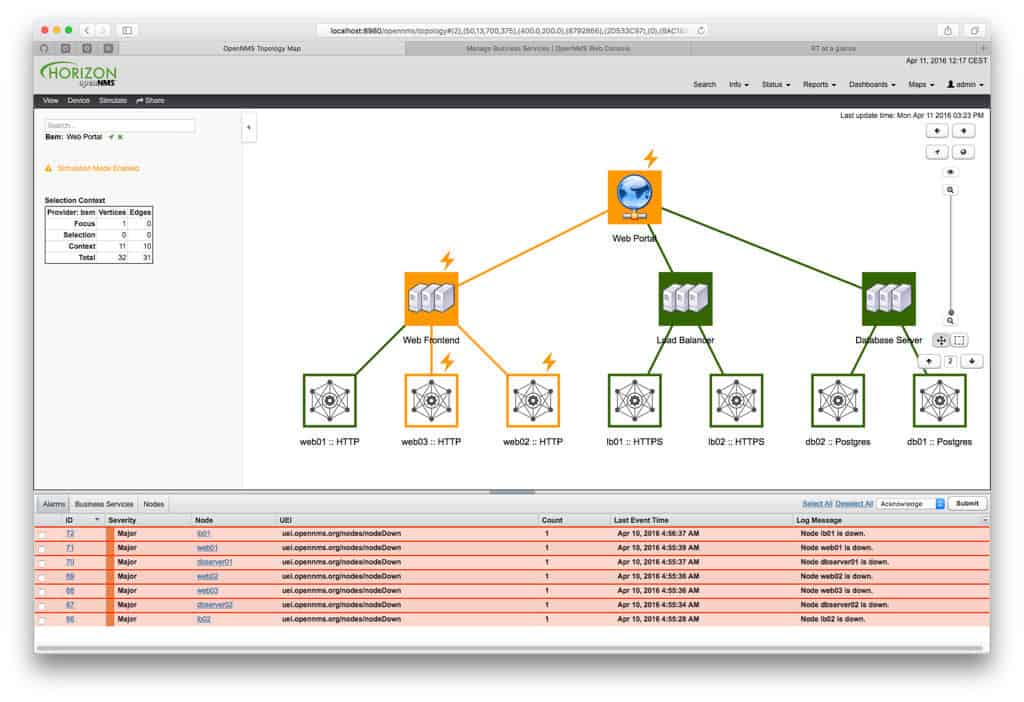
OpenNMS is an open-source enterprise-grade network monitoring tool developed by the users and community of OpenNMS.
Key Features:
- Based on an event-driven architecture that allows flexible workflow integration.
- Normalizes device and vendor-specific messages and protocol-specific performance metrics, so everyone can understand.
- Data can be accessed through RESTful API.
- Sends notifications through multiple channels such as emails, Slack, MatterMost, and Jabber and even sends microblog notifications like Twitter.
- Run external scripts to customize the notifications.
- Integrates with existing ticketing tools or with your own ticketing system.
- Alarms can be forwarded to applications too, so they can be integrated into your management workflow.
- Synthetic polling framework to test anything from IP stack to applications.
- Tests generic TCP connection, status and resources from management agents, measurements from open protocol and management agents, SNMP traps, and syslog messages.
- Database schema is controlled with Liquibase, so updates and maintenance are a breeze.
Why do we recommend it?
We recommend OpenNMS for its event-driven architecture, which allows for highly flexible workflow integration. Its ability to normalize device-specific messages and metrics makes it a universally comprehensible tool for any network team.
OpenNMS comes in two editions – Meridian and Horizon. Horizon is FREE, but Meridian comes with a yearly subscription.
Here are the differences between the two editions.
| Feature | Meridian | Horizon |
|---|---|---|
| Environment: | Ideal for businesses looking for stable environment with good support | Ideal for monitoring new technologies and IT ecosystems like virtual machines and Docker. |
| Development model: | Open source | Open source |
| License: | AGPLv3 or proprietary license | AGPLv3 |
| Release cycle: | Once every 12 months | 3 to 4 months |
| Support: | Multiple options available | Community supported mailing lists and wiki |
| Maintenance: | Access to update server for latest releases or bug fixes | Community driven |
| Configuration: | Supports preconfigured events, workflows, reports, data collection and notices. | Configured and maintained by users and community. |
| Cost: | Yearly subscription for every management server | Free |
| Features: | Comes with features that support stability, usefulness and quality of integration with existing code. | Mainly explores new technologies to drive advances in management technologies. |
Who is it recommended for?
OpenNMS is ideal for businesses looking for an open-source, highly customizable network monitoring solution. Its RESTful API and multiple notification channels make it a strong choice for teams that require seamless integration with existing systems and workflows.
Pros:
- Event-driven architecture for flexible integration
- Normalizes device and vendor-specific messages
- Comprehensive notification options
- Accessible data through RESTful API
Cons:
- Open-source nature may require more hands-on management
Contact the support team for the cost of Meridian.
Conclusion
To conclude, there are many good Nagios alternatives, and we hope the above options help you to make the right choices. We suggest you download one of the aforementioned software suites from above and give it a test in your environment.
Each of the software packages above have different strengths, weaknesses, and price points as well. Check out their features above and give several of them a try, and you’ll quickly know which one will serve you best. From our Experience, SolarWinds has a great Nagios Script Import feature that allows you to import scripts and eventually migrate them over. Give them a try if you want a fast solution.


