
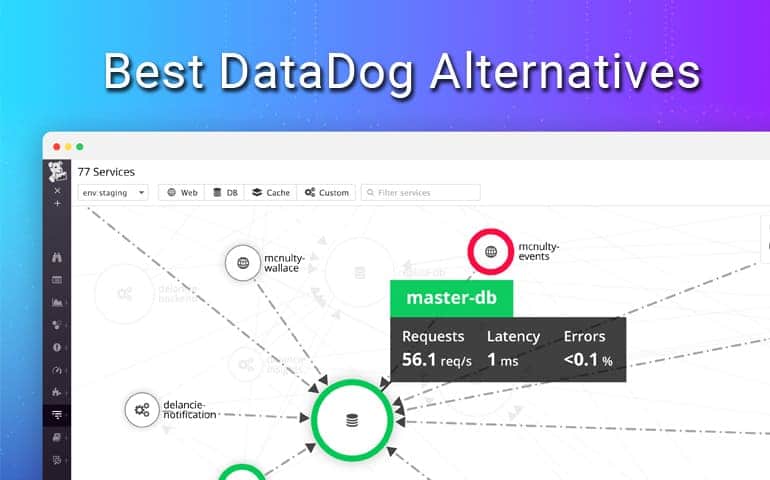
Datadog is a popular monitoring tool for cloud-based applications. It monitors servers, tools, services and applications through a SaaS-based platform.
Some of its important features are:
- Seamlessly integrates metrics and events across the full DevOps stack.
- Monitors, troubleshoots and optimizes the performance of different applications.
- Searches, filters and analyzes your logs
- Helps to build real-time interactive dashboards that can be customized to meet your specifications
- Enhances communication and collaboration
- Sends alerts on critical issues
Here’s our list of the top Datadog alternatives:



Though Datadog is comprehensive, it does come with some shortcomings such as:
- Steep learning curve
- Not ideal for beginners
- Can be expensive
If you’re not comfortable using Datadog or if it works too expensive for you, here are some alternatives to consider when looking for a replacement tool!
The Best Datadog Alternatives
1. Site24x7 All-in-one – FREE TRIAL
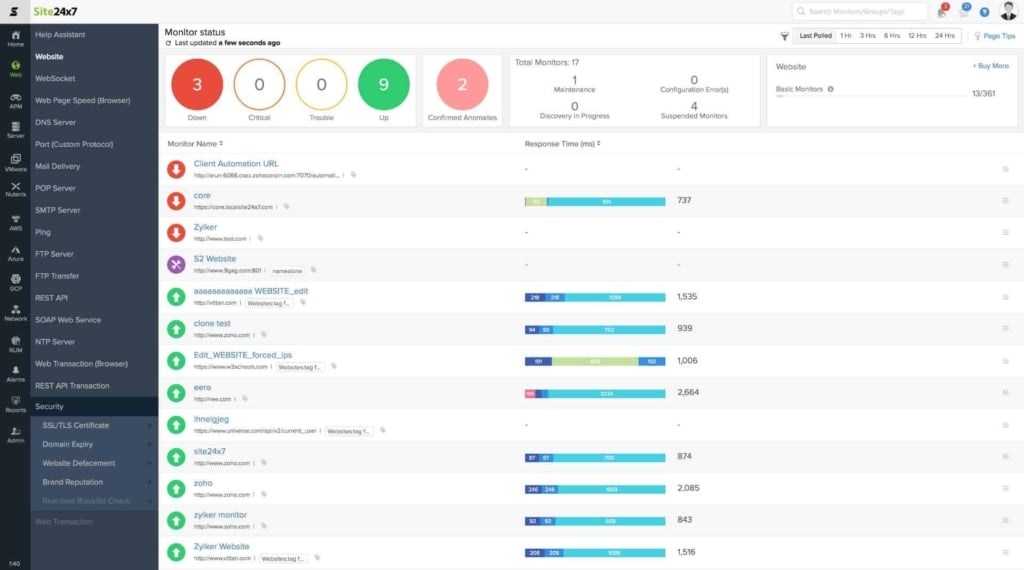
Site27 All-in-one plan offers all of the monitoring and system management tools of the Site24x7 cloud-based platform. There are a great many Similarities between Site24x7 and Datadog. For application performance monitoring and log management, you would find it difficult to choose between the two services.
Features
The application performance monitoring and log management features of Site24x7 include:
- A cloud-based service with processing power and storage space included in the price of a subscription
- No setup fees or upfront cost.
- No contract requirement or minimum service periods lock-in.
- Website monitoring and testing tools
- An application stack identification system that highlights application dependencies
- Drill-down performance tracing that travels through multiple applications, services, and resources.
- Server resource monitoring included.
- Network device monitoring included.
- Network traffic monitoring included.
- Performance alerts that aid unattended automated monitoring.
- Problem notifications sent by SMS, email, voice call, and instant messaging post.
Pricing
The Site24x7 All-in-one plan is available in four editions:
Pro at $35 per month, Classic at $89 per month, Elite at $225 per month, and Enterprise at $449 per month
Download
For more information on the Site24x7 All-in-one plan and its editions and to access a 30-day free trial.
2. ManageEngine Applications Manager – FREE TRIAL
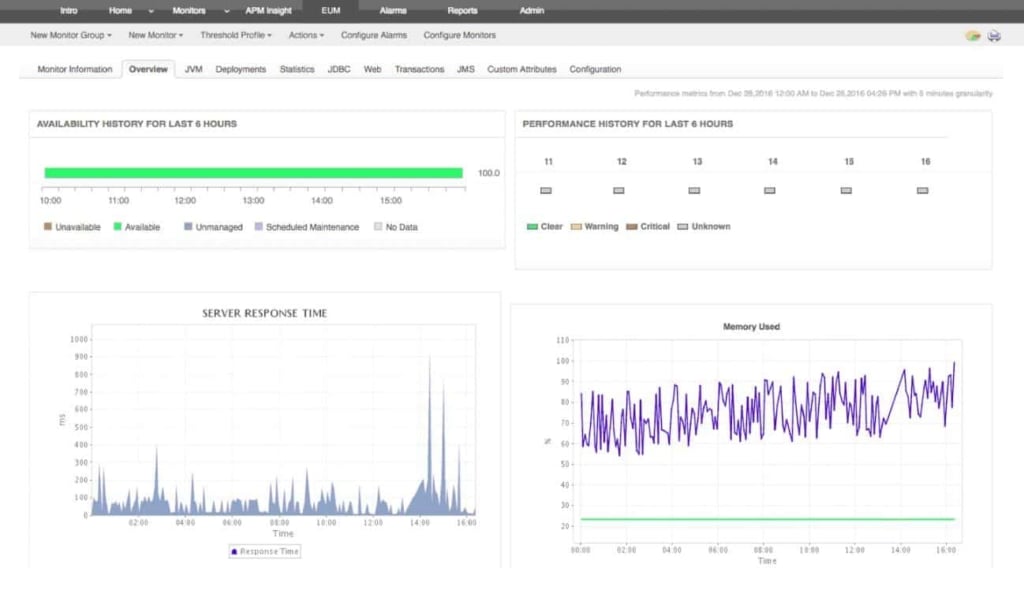
ManageEngine Applications Manager is able to monitor websites, check on their availability and performance, and trace the execution of code and services that create them. This is on-premises software that installs on Windows Server and Linux.
Features
The features of Applications Manager include:
- Monitoring of applications, including databases and web servers.
- Automatic application and service discovery that assembles a map of interdependencies.
- The ability to monitor applications hosted on-premises or in the cloud.
- Analytical tools that include root cause tracing and capacity planning systems.
- Performance thresholds and alerts.
- Machine learning methods for threshold baselining.
- The ability to track code execution in web pages, through to SQL queries in supporting databases.
- Tracing of API execution through to microservices.
- Centralizes the monitoring of groups of applications and includes drill-down paths to individual instances.
- Performance reports.
Pricing
Applications Manager is available in a Free edition that is limited to monitoring five application statuses. The Professional edition can monitor up to 500 Applications for $945 per year. The Enterprise edition can monitor up to 10,000 application statuses at a price of $9,595.
Download
Download a 30-day free trial here.
3. ManageEngine Log360 – FREE TRIAL
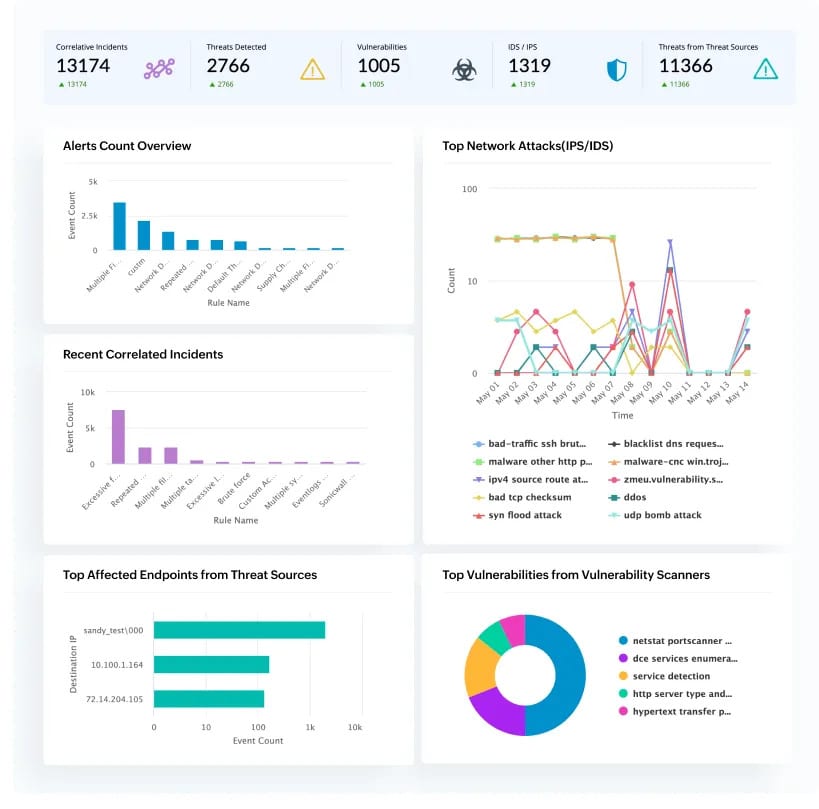
Log360 from ManageEngine is a unified SIEM and SOAR solution that also comes with DLP and CASB capabilities, making it a good choice for application and log monitoring.
Features
The key features of Log360 are:
- Its automated threat detection, investigation, and response module, called Vigil IQ, helps to proactively identify and mitigate threats.
- Comes with 2000+ MITRE-mapped detections that include correlation rules, threat intel matches, and anomaly detection patterns to identify threats.
- Consolidates data from multiple sources and analyzes them for new patterns.
- Supports complex workflows for automated threat detection.
- Uses machine learning to analyze historical trends and adapt thresholds accordingly.
- Comes with dark web monitoring to identify any credentials that may be present on the dark web.
- Uses behavioral analysis to prevent insider threats.
- Leverages GenAI to provide contextual insights.
Pricing
Custom pricing.
Download
Start a 30-day free trial.
4. Dynatrace
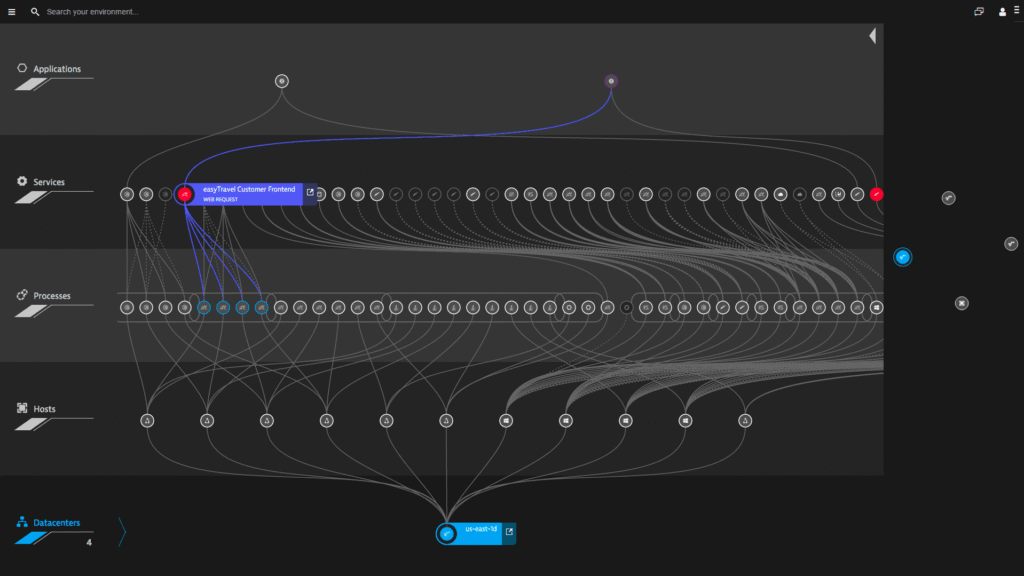
Dynatrace uses real-time intelligence to enhance application performance management, cloud infrastructure monitoring and digital experience management.
Features
The features of Dynatrace are:
- Automated zero-touch configuration, and continuous discovery and mapping.
- Helps to identify the problem and its root cause
- Understands all the inter-dependencies for your enterprise cloud ecosystem.
- Uses AI to provide insights and actionable answers in real-time.
- Works well on both cloud native and hybrid environments.
- Eliminates the need for multiple monitoring tools.
- Detects vMotion events
- Supports more than 100,000 hosts per cluster.
Pricing
Contact the sales team for a custom quote.
Download
Download a 15-day free trial here.
5. Loggly
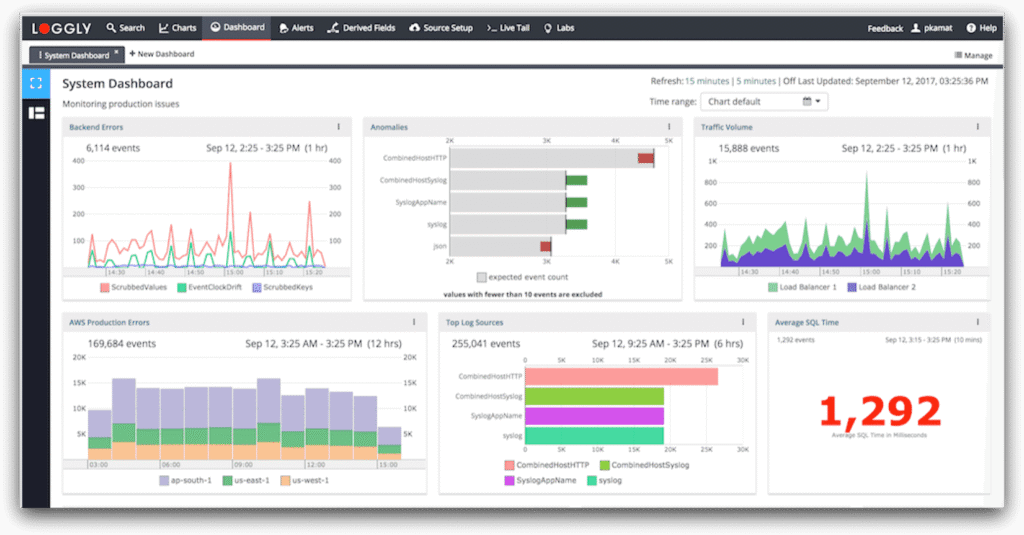
Loggly from SolarWinds is a great choice for cloud-based log monitoring and analysis, as it is comprehensive and give you all the necessary information in a single window.
Features
Some of the salient features of Loggly are:
- Proactively monitors app performance, system behavior and any other unusual activity across the entire stack. Also stays on top of key resources and metrics.
- Traces issues to their root cause.
- Comes with DevOps integration.
- Analyzes and visualizes data to answer key questions
- Its multi-tenancy provides scalability and flexibility.
- Displays visually appealing charts.
- Integrates well with the DevOps toolchain.
Pricing
There are four editions of Loggly.
- Free edition: It is just a basic log search for beginners.
- Standard edition: Starts at $79 /month. Ideal for small businesses.
- Pro edition: Starts at $199 /month and is ideal for companies with growing applications.
- Enterprise edition: Starts at $349 a month, and is the an all-inclusive log monitoring and reporting tool for enterprises.
Download
Download the free trial here.
6. AppOptics
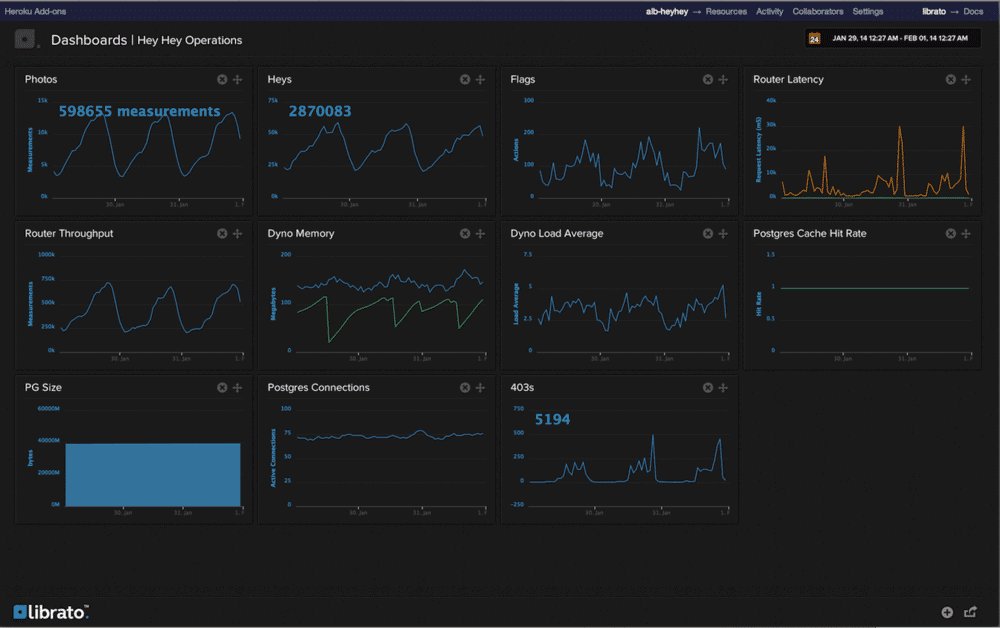
AppOptics (formerly Librato) is a complete solution for monitoring and understanding the different metrics that impact your organization’s productivity and performance.
Features
The features of AppOptics are:
- Gathers metrics from Heroku, AWS and other sources.
- Aggregates and transforms your metrics using advanced DSL functions
- Compares different metrics and presents the results in a visually appealing way.
- Documents arbitrary incidents
- Sends alerts when data is missing and even notifies third-party services as needed.
- Allows you to set up alerts based on complex calculations.
Pricing
AppOptics has a pay-as-you-use model starting at $9.99/host/month when paid for annually.
Download
Start a 14-day free trial.
7. New Relic
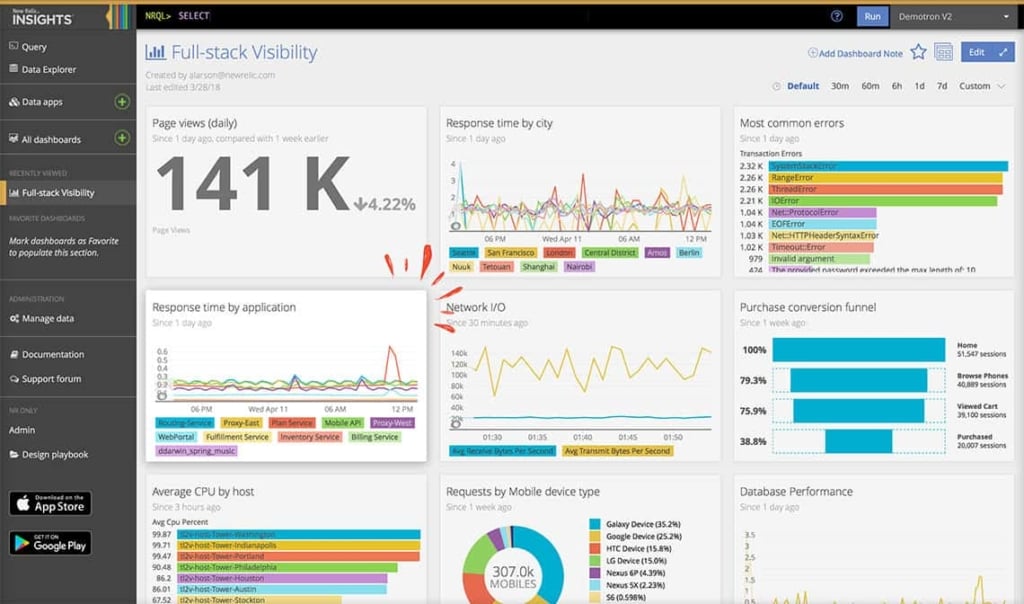
New Relic provides real-time insights, right from your front end system to your backed infrastructure, so you can stay on top of the performance of different apps.
Features
The features of New Relic are:
- Gives different metrics of your application such as response time, throughput and error, in one place.
- Tracks key business transactions.
- Gives a detailed overview of database monitoring.
- Sends alerts about availability and errors. You can even set your own warning and critical thresholds.
- Creates custom reports that are easy to read.
- Makes it easy for DevOps teams to collaborate, share and work together.
Pricing
Price depends on the size of your instance, number of instances and total running time. You can calculate the cost here, depending on your requirements.
Download
Download a trial version here.
8. AppDynamics
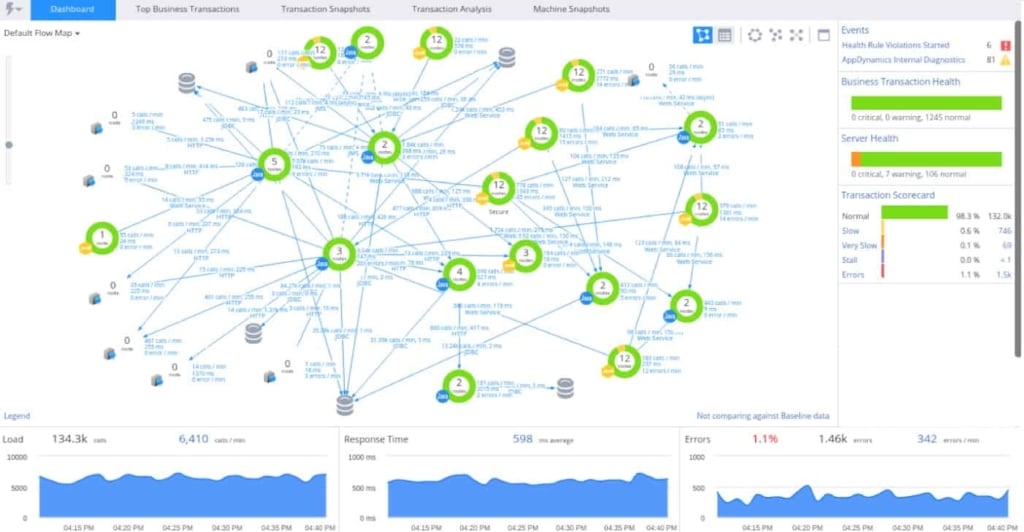
AppDynamics is n application performance and monitoring tool that helps to stay on the health and performance of applications at all times.
Features
The features of AppDynamics are:
- Provides code-level visibility
- Comes with a powerful alerting system
- Offers synthetic monitoring, mobile real-user monitoring and more.
- Monitors multiple platforms continuously, even in high-volume environments.
- Troubleshoots performance issues in production
- Gives the performance trends over time.
Pricing
Contact the sales team for custom pricing.
Download
Download a free trial here.
Conclusion
To conclude, there are many alternatives for Datadog and each of these tools help you to stay on top of the end-to-end performance of all your applications. Out of these, we recommend Site24x7 All-in-one for its application and network monitoring with alerting. It is sure to make a good value addition to your software arsenal.