
WMI is a popular monitoring protocol in Windows environments and today we’re going to take a deep dive into some of the Best WMI Monitoring tools and software!
Windows Management Instrumentation, or WMI in short, is an information standard based on which users can manage data and operations on a Windows operating system.
Here is our list of the best WMI Monitoring Tools:
- ManageEngine OpManager – EDITOR’S CHOICE Provides robust WMI monitoring with extensive customization options, making it ideal for businesses of all sizes. Download a 30-day free trial.
- Paessler PRTG WMI Monitor – FREE TRIAL A collection of monitoring tools for networks, servers, and applications that includes sensors that extract WMI data. Runs on Windows Server. Download a 30-day free trial.
- Site24x7 – FREE TRIAL Offers a WMI feature to collect various performance metrics from Windows machines, such as CPU usage, memory usage, disk space, network statistics, and more. Start a 30-day free trial.
- SolarWinds WMI Monitor An interpreter for WMI data, this tool includes templates that act as filters on the large pool of WMI data extracting information that relates to a specific application or service.
- WhatsUp Gold A network performance monitor that exploits WMI data as well as SNMP processes to gather information about devices connected to a network. Installs on Windows Server.
- Sapien CIM Explorer A data viewer with analytical tools such as filtering, sorting, and grouping. This works on any data source based on the Common Information Model, including WMI. Runs on Windows and Windows Server.
WMI comes with an operating system interface through which components send notifications. In other words, it’s a standard that allows information to be shared among management-based applications, so the user knows the status of different components at any point in time.
Due to the popularity of Windows operating system, most software in the world are WMI-enabled, and receive or process WMI information. However, you need a separate software to interpret this WMI information, and this is why we have WMI monitoring tools.
The Best WMI Monitoring Tools
Methodology for Selecting the Best WMI Monitoring Tools
Most network administrators and system analysts use WMI monitoring tools to manage and monitor their system resources. With the help of these tools, experts are able to get a quick insight into system behavior, performance, and health. If you are willing to invest in one of these tools, here are a few methodologies that you must not miss when selecting the best tool from the market.
- Check if it notifies for high WMI output
- Does it support collecting WMI messages?
- Can you generate WMI activity statistics using the selected tool?
- Does it offer filters for WMI message severity?
- Can you classify the collected WMI messages based on the source?
Here’s a detailed look into each of these WMI Monitoring Tools along with some Features and their Capabilities.
1. ManageEngine OpManager – FREE TRIAL
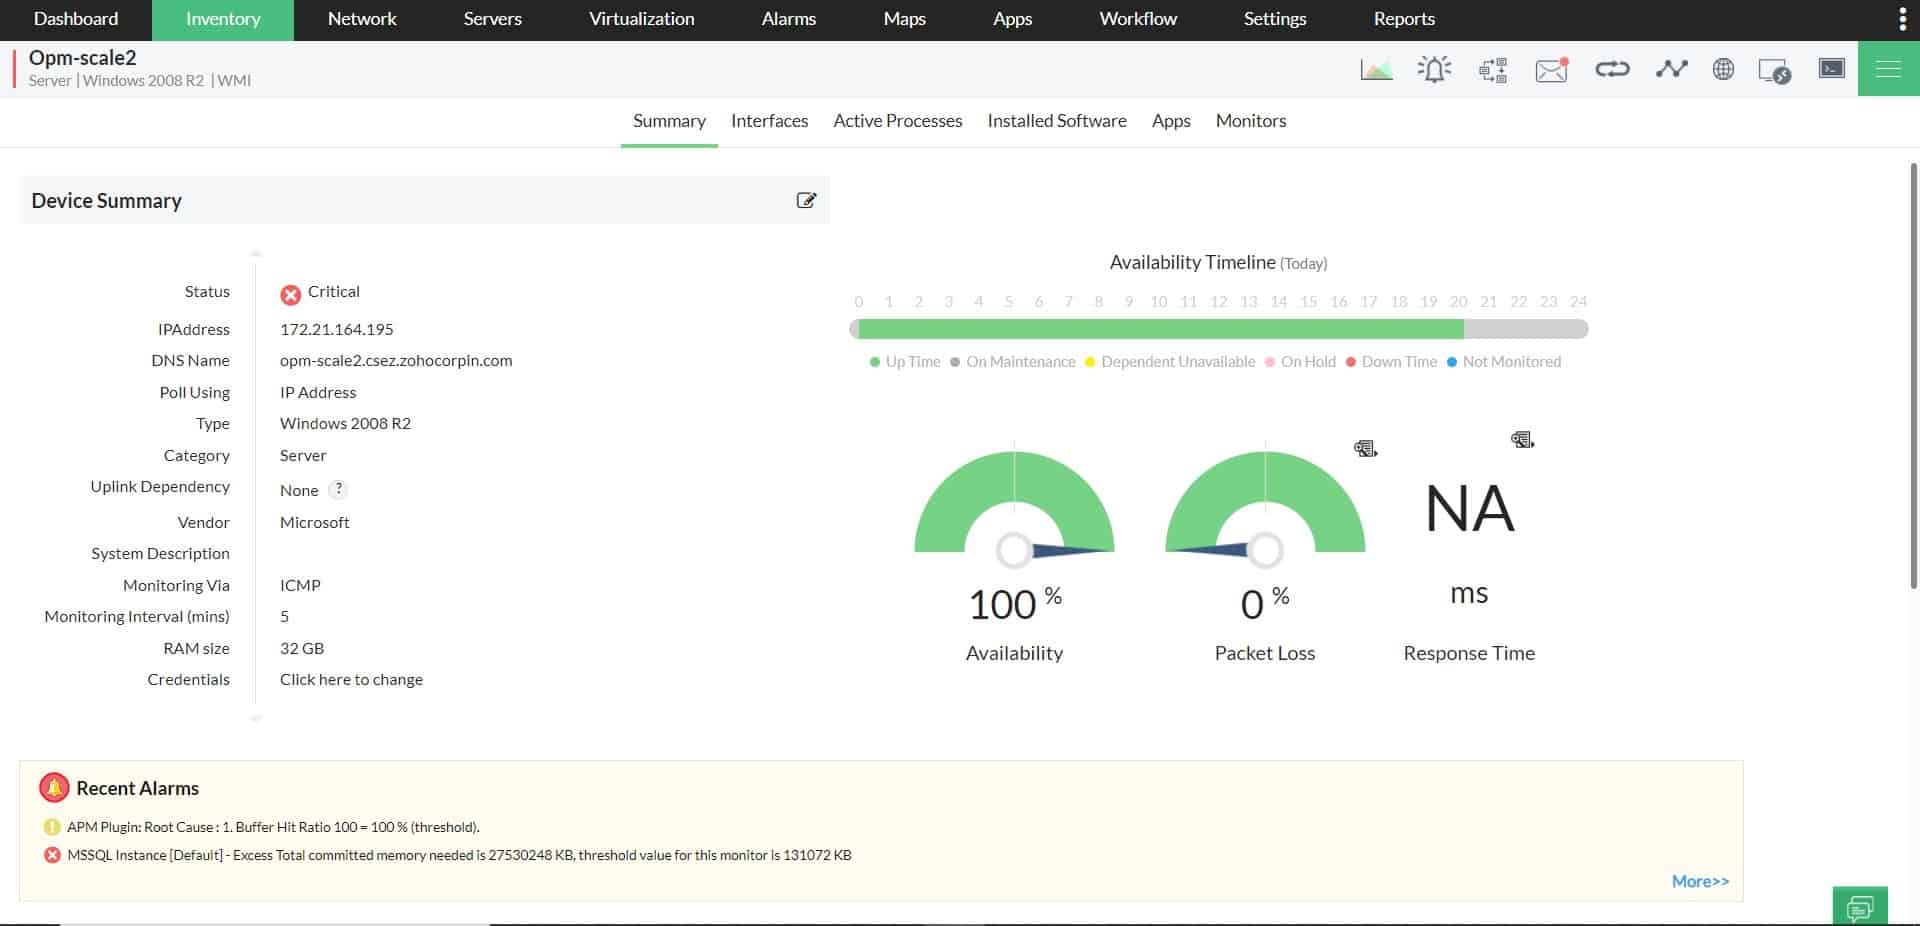
ManageEngine OpManager (OpM) stands out as one of the best WMI monitoring platforms due to its comprehensive and real-time monitoring capabilities tailored specifically for Windows systems. It effectively leverages WMI to provide detailed insights into system performance, ensuring that administrators have up-to-date information at their fingertips.
Key Features:
- WMI Monitoring: Offers comprehensive monitoring of Windows systems using WMI for real-time data collection.
- Customizable Dashboards: Allows you to create tailored dashboards for better visualization of critical metrics.
- Application Performance Monitoring: Tracks the performance of various applications to ensure optimal functionality.
- Automated Alerts: Sends notifications based on predefined thresholds to address issues promptly.
- Integration with Other Tools: Easily integrates with a variety of other IT management and monitoring tools.
- Scalability: Adapts to the needs of both small businesses and large enterprises, making it versatile.
- User-Friendly Interface: The interface is intuitive and easy to navigate, even for beginners.
Why do we recommend it?
ManageEngine OpManager is recommended for its robust WMI monitoring capabilities, which provide real-time insights into Windows systems. Its highly customizable dashboards and comprehensive application performance monitoring ensure optimal functionality and quick issue resolution.
The platform’s ability to customize dashboards and alerts makes it highly adaptable to various IT environments, enhancing its utility. Furthermore, its seamless integration with other IT management tools and scalable architecture makes it an ideal choice for businesses of all sizes.

Who is it recommended for?
This tool is ideal for IT administrators and managers who need detailed monitoring and management of Windows environments. It’s also suitable for businesses of all sizes, from small startups to large enterprises, due to its scalability and extensive feature set.
Pros:
- Robust WMI Monitoring: Provides detailed insights and real-time monitoring of Windows systems.
- Highly Customizable: Offers extensive customization options for dashboards and reports, suiting diverse user needs.
- Comprehensive Application Monitoring: Ensures that all your critical applications are running smoothly with minimal downtime.
- Proactive Alerting System: Automatically triggers alerts based on set parameters, helping in quick issue resolution.
- Seamless Integration: Integrates well with other tools, enhancing overall IT management efficiency.
- Scalable Solution: Suitable for organizations of all sizes, allowing easy scaling as your business grows.
Cons:
- Learning Curve: The vast array of features can be overwhelming for new users.
You can register for access to a 30-day free trial.
EDITOR'S CHOICE
ManageEngine OpManager is our top choice for network and application performance monitoring due to its powerful WMI monitoring features. It offers extensive customization options, allowing you to tailor dashboards and reports to your specific needs. The tool’s comprehensive application performance monitoring ensures that your critical applications are always running optimally. Additionally, the proactive alerting system helps in quickly addressing potential issues. Despite a slight learning curve, its robust capabilities and seamless integration with other IT management tools make it an excellent choice for businesses of all sizes.
Download: Access a 30-day FREE Trial
Official Site: https://www.manageengine.com/network-monitoring/wmi-monitoring.html
OS: Windows, Linux
2. PRTG WMI Monitor – FREE TRIAL
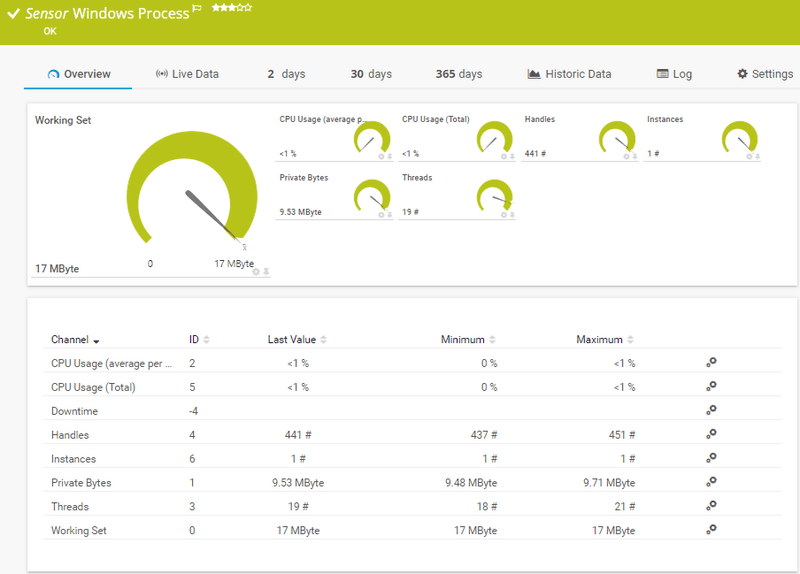
PRTG WMI Monitoring tool monitors different aspects of Windows servers to give users a clear picture of the device state and its health.
- PRTG monitors CPU, memory, traffic uptime, disk space and more.
- Comes with user-defined sensors to meet specific needs
- Useful for monitoring databases, emails, web and virtual servers as well.
- Besides WMI, it also uses SNMP and Windows performance counters to monitor Windows devices.
- Packet sniffing and NetFlow sensors are also available for monitoring individual data packets.
- Users can customize the monitoring process by deciding which parameters should be monitored. This gives them better control over the system and the monitoring process itself.
- PRTG also comes with custom sensors that can be configured to meet specific needs
- This tool retrieves data from the Windows Security Center and analyzes the Windows Event Log files, and integrates them into monitoring data.
- It’s easy to setup and use.
- Compatible with most devices available in the market today.

Pros:
- Offers visibility into device state and its health
- You can track all Microsoft servers and workstations
- Use IP or MAC address to filter bandwidth usage
- Users can even monitor SQL database, SharePoint, and Active Directory
- Easy to monitor individual data packets with Packet sniffing and NetFlow sensors
Cons:
- Exploring different features can be a time-consuming process
WMI monitoring comes as a part of the PRTG network monitor. The pricing is based on the number of sensors used.
- 100 sensors – free
- 500 sensors – $1,600
- 1000 sensors – $2,850
- 2500 sensors – $5,950
- 5000 sensors – $10,500
Paessler also offers two packages – XL1 Unlimited and XL5 Unlimited. XLI license is valid for one single core installation without any upper limit on sensors while XL5 is valid for up to core installations without a limit on the number of sensors.
All these prices are a one-time payment excluding tax, and comes with one-year free maintenance. The maintenance can be renewed after the end of first year, and the price will be 25% of the value of the original license.
A trial version is available for 30 days.
3. Site24x7 – FREE TRIAL
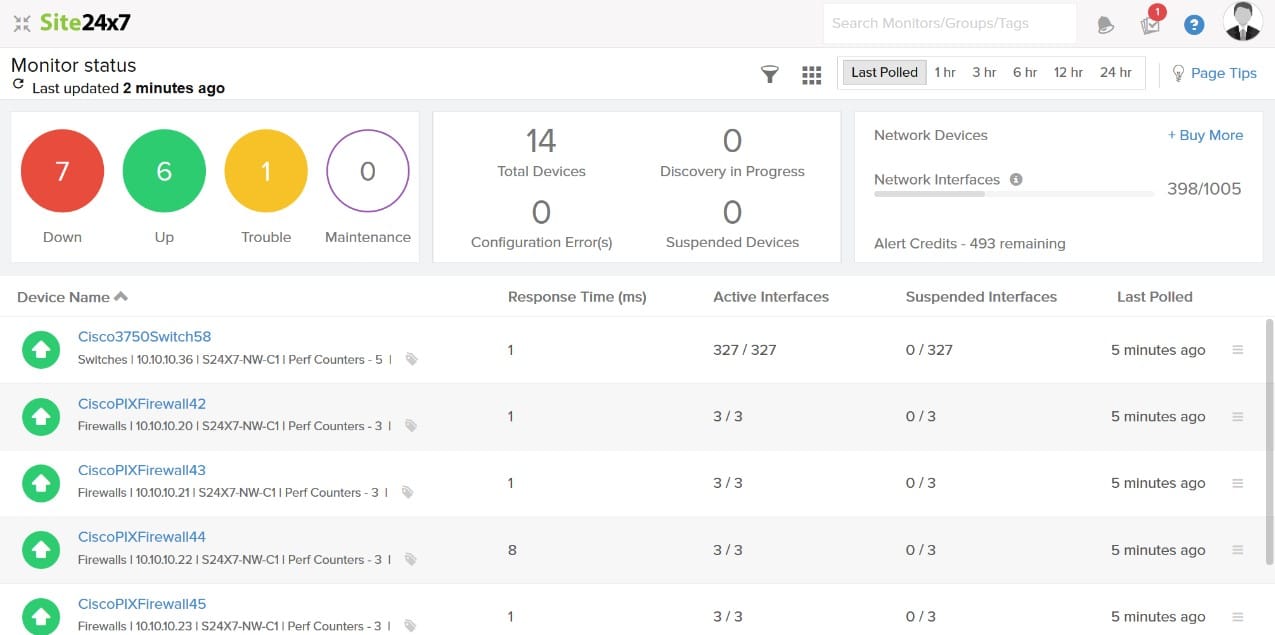
With the help of the Site24x7 Windows Monitoring package, organizations can track the Windows servers and ensure smooth operational flow. Using this tool, businesses can even watch over the issues and fix the setbacks that can impact the overall performance of your server ecosystem.inventory and maps.
Key Features
- Offers access to IT Automation capabilities
- Troubleshoot issues with in-depth root cause analysis
- Watches over Windows server health, performance, and availability
- Instantly alerts on exceeding threshold limit or failure
- Monitors all Windows event logs in real-time
Why do we recommend it?
The Windows monitoring tool comes with a user-friendly interface and monitoring capabilities that help maintain a smooth flow of operations and business continuity. The tool even sends real-time updates on excessive disk usage, subsystem problems, and other issues related to Windows server resources to system administrators before they impact the performance.
It even comes with features like IT automation, root cause analysis, and more that make the whole process of monitoring and troubleshooting Windows server issues easier. Further, the tool uses AI-based predictions to keep a watch on the Windows server’s availability and performance.

Who is it recommended for?
System administrators and DevOps teams can make the best out of the Site24x7 Windows monitoring tool thanks to its exclusive features and IT automation capabilities. Even small businesses can afford and subscribe to the Windows infrastructure monitoring package.
Pros:
- Provides in-depth insights into CPU usage, disk usage, server uptime, and other network statistics
- Uses IT Automation tools to automate fault resolution in addition to monitoring servers
- Helps discover the services and related processes automatically and monitors them in real-time
- Allows setting thresholds and receiving timely alerts in the event of a failure or breakdown
Cons:
- A few users may find the advanced features a bit difficult to learn and understand.
Access the 30-day free trial.
4. SolarWinds WMI Monitor
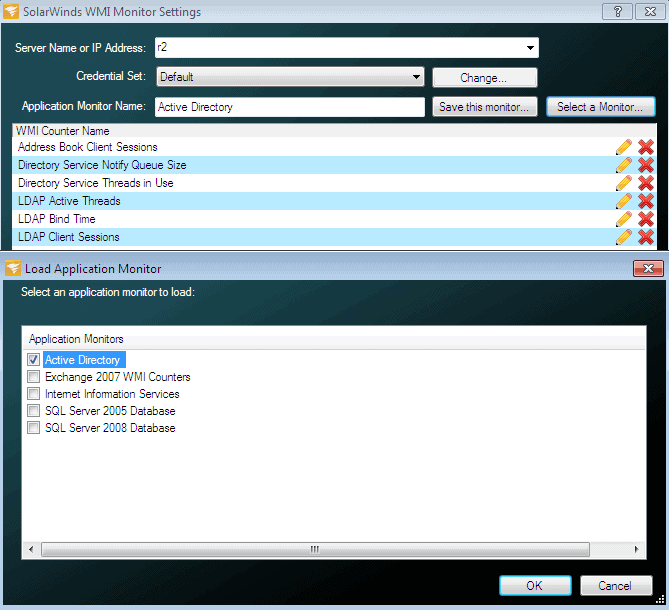
The SolarWinds WMI Monitor in the Server and Administration Manager (SAM) tool monitors the metrics on your Windows servers and applications and gives a better insight into their performance.
Key Features
- Supports pre-built templates available on @THWACK
- Allows users to design custom scripts using the WMI browser.
- Simple to install and easy to use.
- The desktop dashboard gives a bird’s eye view of the performance of different metrics.
- Monitors both the hardware and the application
- It is mainly used with Active Directory and SharePoint

Pros:
- Tracks all metrics and generates quick insights into Windows servers and application performance
- SolarWinds WMI Monitor hardly takes any time to get started
- Users can watch over PaaS, Azure, SaaS as well as AWS IaaS
- Users gain access to 1,200+ monitoring and 1,000 community templates
- Allows you to set proper thresholds and alerts
Cons:
- Since it heavily depends on WMI, any issues with WMI may result in inaccurate data from monitored devices.
Register with SolarWinds to access a 30-day free trial.
5. WhatsUp Gold
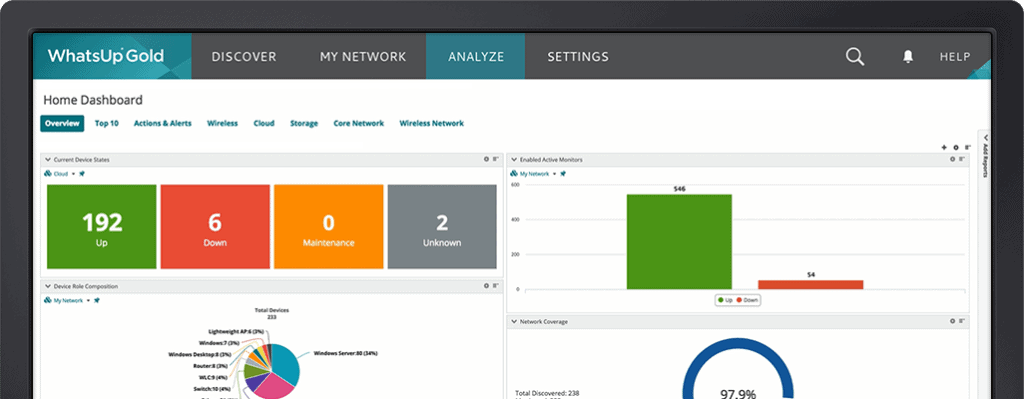
WhatsUp Gold is a network monitoring software that comes with powerful monitors and alerting features.
Here’s a look into some of the important features in the WMI monitoring part of WhatsUp Gold.
Key Features
- Offers complete monitoring capability for WMI-enabled desktop and server operating systems.
- Helps to analyze information pro-actively, so the issues can be fixed before they become big problems.
- Comes with active monitors that poll devices for an up/down or yes/no response, so the health of the device can be known right away.
- Provides alerts through email, SMS and Slack.
- Customizable reports help users understand the health of devices, their performance and availability at any point in time.
- An overview dashboard displays the status with green/red bars.
- Gives the option to extend functionality with add-on modules such as network traffic analysis, application monitoring and configuration management.
Pros:
- Helps in proactive information analysis
- Use an interactive topology map that displays dependencies and connectivity to troubleshoot more quickly
- Get alerts via SMS, email, the web, or Slack so you are aware of emerging problems before users report them
- Automate your workload by integrating your other systems with a robust REST API
- Generates customizable reports that cover device health, availability as well as performance
Cons:
- Bulk editing is a time-consuming task
- With more network elements, the user interface becomes more difficult
Contact the sales team to get a Quote. Download a free trial from here.
6. Sapien CIM Explorer
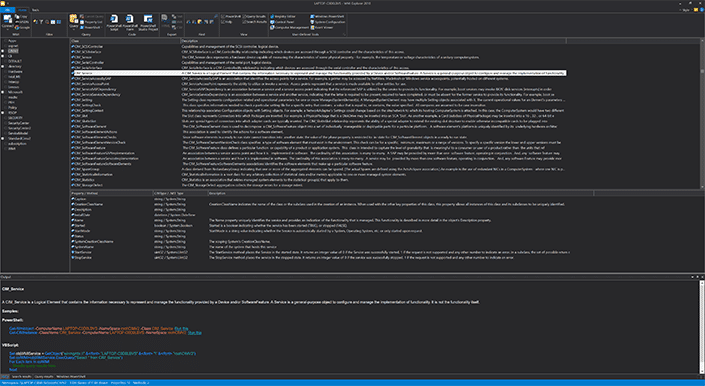
Sapien CIM Explorer is the next-generation tool for monitoring Windows hardware and applications with the WMI standard. It helps users to make the most of the vast repository of WMI data to understand the working and performance of Windows devices.
Key Features
- Uses cached data and multi-threaded code to give quick results
- Explores local as well as remote machines
- Its many search options help users to get the precise information they want.
- Its filters help to remove irrelevant information
- Generates sample code for VBScript and PowerShell
- The local cache allows users to access remote systems, even when they are not connected.
- Custom queries and built-in templates give more flexibility to the monitoring process.
- Data can be exported in four formats, namely, HTML, XML, CSV and plain text.
- Online documentation is available for every element
- Users have the option to send queries directly to Microsoft PowerShell

Pros:
- Generates fast results by using cached information and multi-threaded codes
- Eases the process of removing irrelevant data using filters
- Users can create sample PowerShell and VBScript code
- Offers more flexibility via built-in templates and custom queries
- You can export data in XML, CSV, HTML, or text format
Cons:
- Mostly text-based interface
- Less user-friendly compared to other tools
The cost is $49, which includes a one-year subscription. In this period, users get all maintenance and major releases free of cost. At the end of the subscription period, users can choose to continue without renewing the subscription, but they will not get the latest updates. A free trial is available for 45 days.
Conclusion
To conclude, WMI Monitoring Tools and software are vital to knowing about the health and performance of your Windows devices. We hope these devices help you to tap into the powerful WMI database to make the most of the available information.