

The last few years have seen increased pressure on the existing network infrastructure and this has exacerbated during the COVID-19 pandemic, as millions of people work and study from home. This brings up the need for networks to use robust strategies such as load balancing, the ability to scale resources dynamically, and to implement superior routing mechanisms.
As a service provider, implementing all these strategies may not be easy, and this is where the Amazon Web Services’ Elastic Load Balancing (ELB) comes in handy. This is an out-of-the-box load balancer used by enterprises worldwide to route applications.
This solution automatically distributes application traffic across many Amazon EC2 instances and in the process, improves the routing efficiency and fault tolerance.
This explanation brings up an important question – what happens when an EC2 instance is down? A real possibility that could throw your load balancing into chaos, right?
Well, not really because AWS has an automatic health check in place called the ELB Health Check.
What is the ELB Health Check?
An ELB Health Check is the process by which AWS determines if a particular EC2 instance is available and ready to receive traffic. If this check shows that the EC2 instance is not available, then the routing table is updated automatically to prevent any traffic from reaching that instance.
This health check uses protocols and port numbers to ping the EC2 instances and all those that are available and ready send a 200 response code. On the other hand, if an instance returns a different code or if there is no response at all for a certain time, that instance is deemed to be unavailable. Accordingly, traffic is routed to the other available instances. These health checks happen regularly to ensure that there is no impact on load balancing. Also, they are designed in such a way to allow unhealthy devices to recover or get fixed, as the case may be.
Configurations to Know
As you have guessed by now, you can control the frequency, port numbers, and protocols of the health checks through configurations, and ELB health checks happen accordingly. Some of the configurations that you can change are as follows.
- Port number You can choose any port from 1 to 65535, though the default for a web application is port 80. You can change the port numbers to suit your preferences.
- Protocols Like the port number, you can also configure the protocol for the ping target. The supported protocols are HTTPS, TCP, HTTP, and SSL.
- Response timeout In this configuration option, you get to decide how long the ping request must wait before determining that an EC2 instance is unavailable. Typically, you must provide a number between two and 60 seconds, and if the instance doesn’t respond within the stipulated time, it is deemed unavailable. The default value is five seconds.
- Health check interval The next parameter is the interval. How often do you want AWS to check the availability of an instance? The minimum is five seconds and the maximum is 300 seconds or five minutes. The default is 30 seconds.
- Threshold Counts Threshold counts are the number of checks that an EC2 instance must pass before it can be marked as healthy or unhealthy. There are two thresholds – one to determine when an instance is unhealthy and the other to determine when an unhealthy instance is healthy again. By default, two successive failures will make an EC2 instance unhealthy. Later, ten consecutive passes are necessary to make an unhealthy instance a healthy one. You can change this value from two to 10.
How to Configure?
Now that you know what the configuration values are, it’s time to see how you can configure them.
Broadly speaking, there are two ways to do it.
AWS Console
You can configure ELB when you create it the first time. Configuring it through the AWS console is the easiest way. Simply navigate to the Load Balancer section of the EC2 home page.
The default values given by AWS are based on the needs of your application, and you can also change them now or anytime later to optimize its performance.
For existing ELBs, select the ELB you want to change, and click on the Health Check tab right below. Click the Edit Health Check button to change the configuration settings.
AWS CLI
The other option is to use the AWS CLI. But for this, you must be familiar with the commands.
Some of the commonly-used commands are:
- create-load-balancer
- delete-load-balancer
- describe-account-limits
- detach-load-balancer-from-subnets
- register-instances-with-load-balancer
- remove-tags
You can also check the AWS documentation for these commands and how to use them.
So far we have seen what are ELB health checks, why you need them, and how you can customize them. Next, we’ll talk about some tips and tricks to get accurate results.
Tips and Tricks
Here are some tips and tricks to get the most out of your ELB Health Checks.
- Adding health checkpoints to applications alone won’t help because even if the application is in good health, the underlying database or service that’s vital to its functionality may be unavailable. So, you never get the complete picture by testing the application’s health alone, and hence, your testing must also include the components associated with an application.
- Combine ELB health checks with auto-scaling groups to cycle them out, with no downtime.
- Use the clustering technique for non-server apps
- Consider third-party tools because they tend to be comprehensive and can help you perform health checks through an intuitive interface.
This last point takes us to the next section where we look at some popular tools for doing ELB health checks.
ELB Health Check Tools
Besides the AWS Console and CLI, you can also use many third-party tools to do this ELB health check. Some of the popular choices are:
- Paessler PRTG Network Monitor – FREE TRIAL A comprehensive solution that monitors the EC2 instances and stays on top of ELB health checks. Start a 30-day free trial.
- Datadog A comprehensive cloud monitoring tool that not just gathers data, but also analyzes them to provide meaningful insights that are highly relevant for your business. It monitors and analyzes a wide range of resources to maximize performance and improve the overall user experience. Its intuitive dashboards are a great advantage as well.
- Amazon CloudWatch A metric repository that gathers all the information about your EC2 instances and their availability. You can use this data directly or run it through intelligent platforms to identity pertinent trends and patterns.
- Dynatrace An intelligent platform that monitors the performance of applications and analyzes the anomalies to get to the root cause.
- Splunk Captures, analyzes, and correlates data in real-time to provide the most relevant insights for your business.
- Sumo Logic A cloud-based analytics tool that takes inputs from CloudWatch and gives you much-needed insights into the performance of your applications.
Let’s take a detailed look at each of these tools.
Our methodology for selecting the best ELB Health Check tool
We’ve broken down our analysis for you based on these key criteria:
- Extent of integration with AWS services.
- Comprehensive monitoring capabilities.
- Ability to provide actionable insights.
- User-friendly interface and ease of setup.
- Mobile device compatibility for on-the-go monitoring.
1. Paessler PRTG Network Monitor – FREE TRIAL
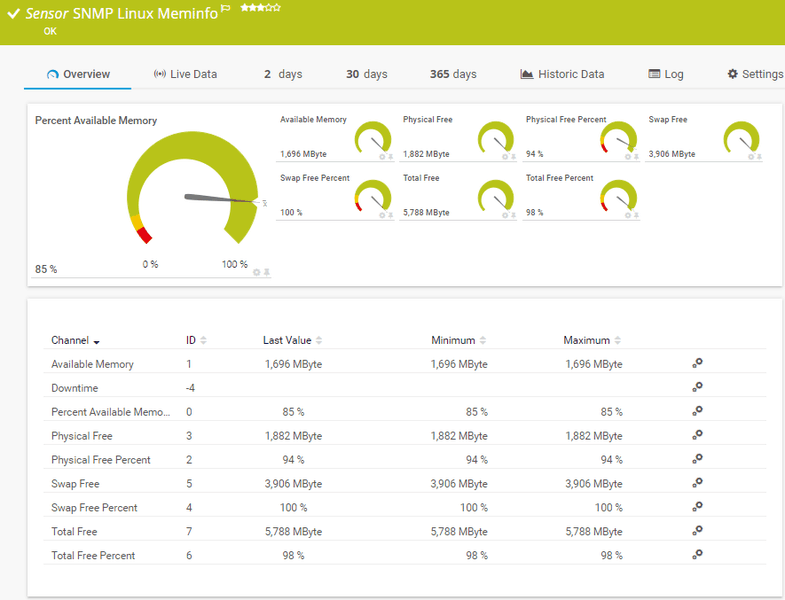
Paessler PRTG is a comprehensive AWS monitoring tool that deals with hardware malfunctions and ensures that resources are available when you need them. It uses the Amazon Web service CloudWatch data to stay on top of ELB health checks.
Key Features:
- Built-in CloudWatch sensors
- Integrates data from CloudWatch into your monitoring solution to give you comprehensive insights
- Provides an overview of the rate of utilization of your resources
- Stays on top of the performance of different applications
- Configures local networks to adapt to cloud integration
- Constantly checks if your EC2 instances are running
- Compatible with mobile devices
- Requires only a few minutes to get started
- Set custom alerts for many metrics
- Easy to handle the fluctuating loads with a few quick configuration changes
Why do we recommend it?
Paessler PRTG Network Monitor excels in offering extensive AWS monitoring capabilities, including hardware malfunction alerts and resource availability tracking. Its seamless integration with Amazon CloudWatch provides a comprehensive overview, making it a robust choice for AWS environment monitoring.
Who is it recommended for?
This tool is recommended for businesses and IT teams who are heavily invested in Amazon Web Services and need real-time monitoring and insights. It’s especially useful for those who require rapid configuration changes to handle fluctuating loads and want the convenience of mobile compatibility.
Pros:
- Seamless integration with AWS CloudWatch.
- Comprehensive insights into resource utilization.
- Mobile device compatibility enhances monitoring flexibility.
- Quick setup process for immediate use.
- Customizable alerts for diverse metrics.
Cons:
- The pricing structure based on sensors may increase costs for larger setups.
The cost depends on the number of sensors you use. The pricing tiers are:
- PRTG 500 ($1,750) – 500 sensors + 1 server installation
- PRTG 1000 ($3,200) – 1000 sensors + 1 server installation
- PRTG 2500 ($6,500) – 2500 sensors + 1 server installation
- PRTG 5000 ($11,500) – 5000 sensors + 1 server installation
- PRTG XL1 ($15,500) – Unlimited sensors + 1 server installation
- PRTG Enterprise (Custom pricing) – 20,000 sensors + Multiple server installations
Click here for a 30-day free trial.
EDITOR'S CHOICE
Paessler PRTG Network Monitor is our top ELB Health Check tool because it offers a holistic AWS monitoring solution. It stands out for its seamless integration with Amazon Web Services, particularly Amazon CloudWatch, enabling efficient and comprehensive monitoring of ELB health.
This tool is highly recommended for its built-in CloudWatch sensors and its capability to integrate this data into your monitoring solution, providing invaluable insights. Its user-friendly interface and mobile device compatibility make it accessible and convenient. Moreover, its customization options, such as setting alerts for specific metrics, are beneficial for businesses needing to adapt quickly to fluctuating loads.
Download: Download a 30-Day Free Trial
Official Site: https://www.paessler.com/prtg
OS: Windows, Cloud-Based
2. Datadog
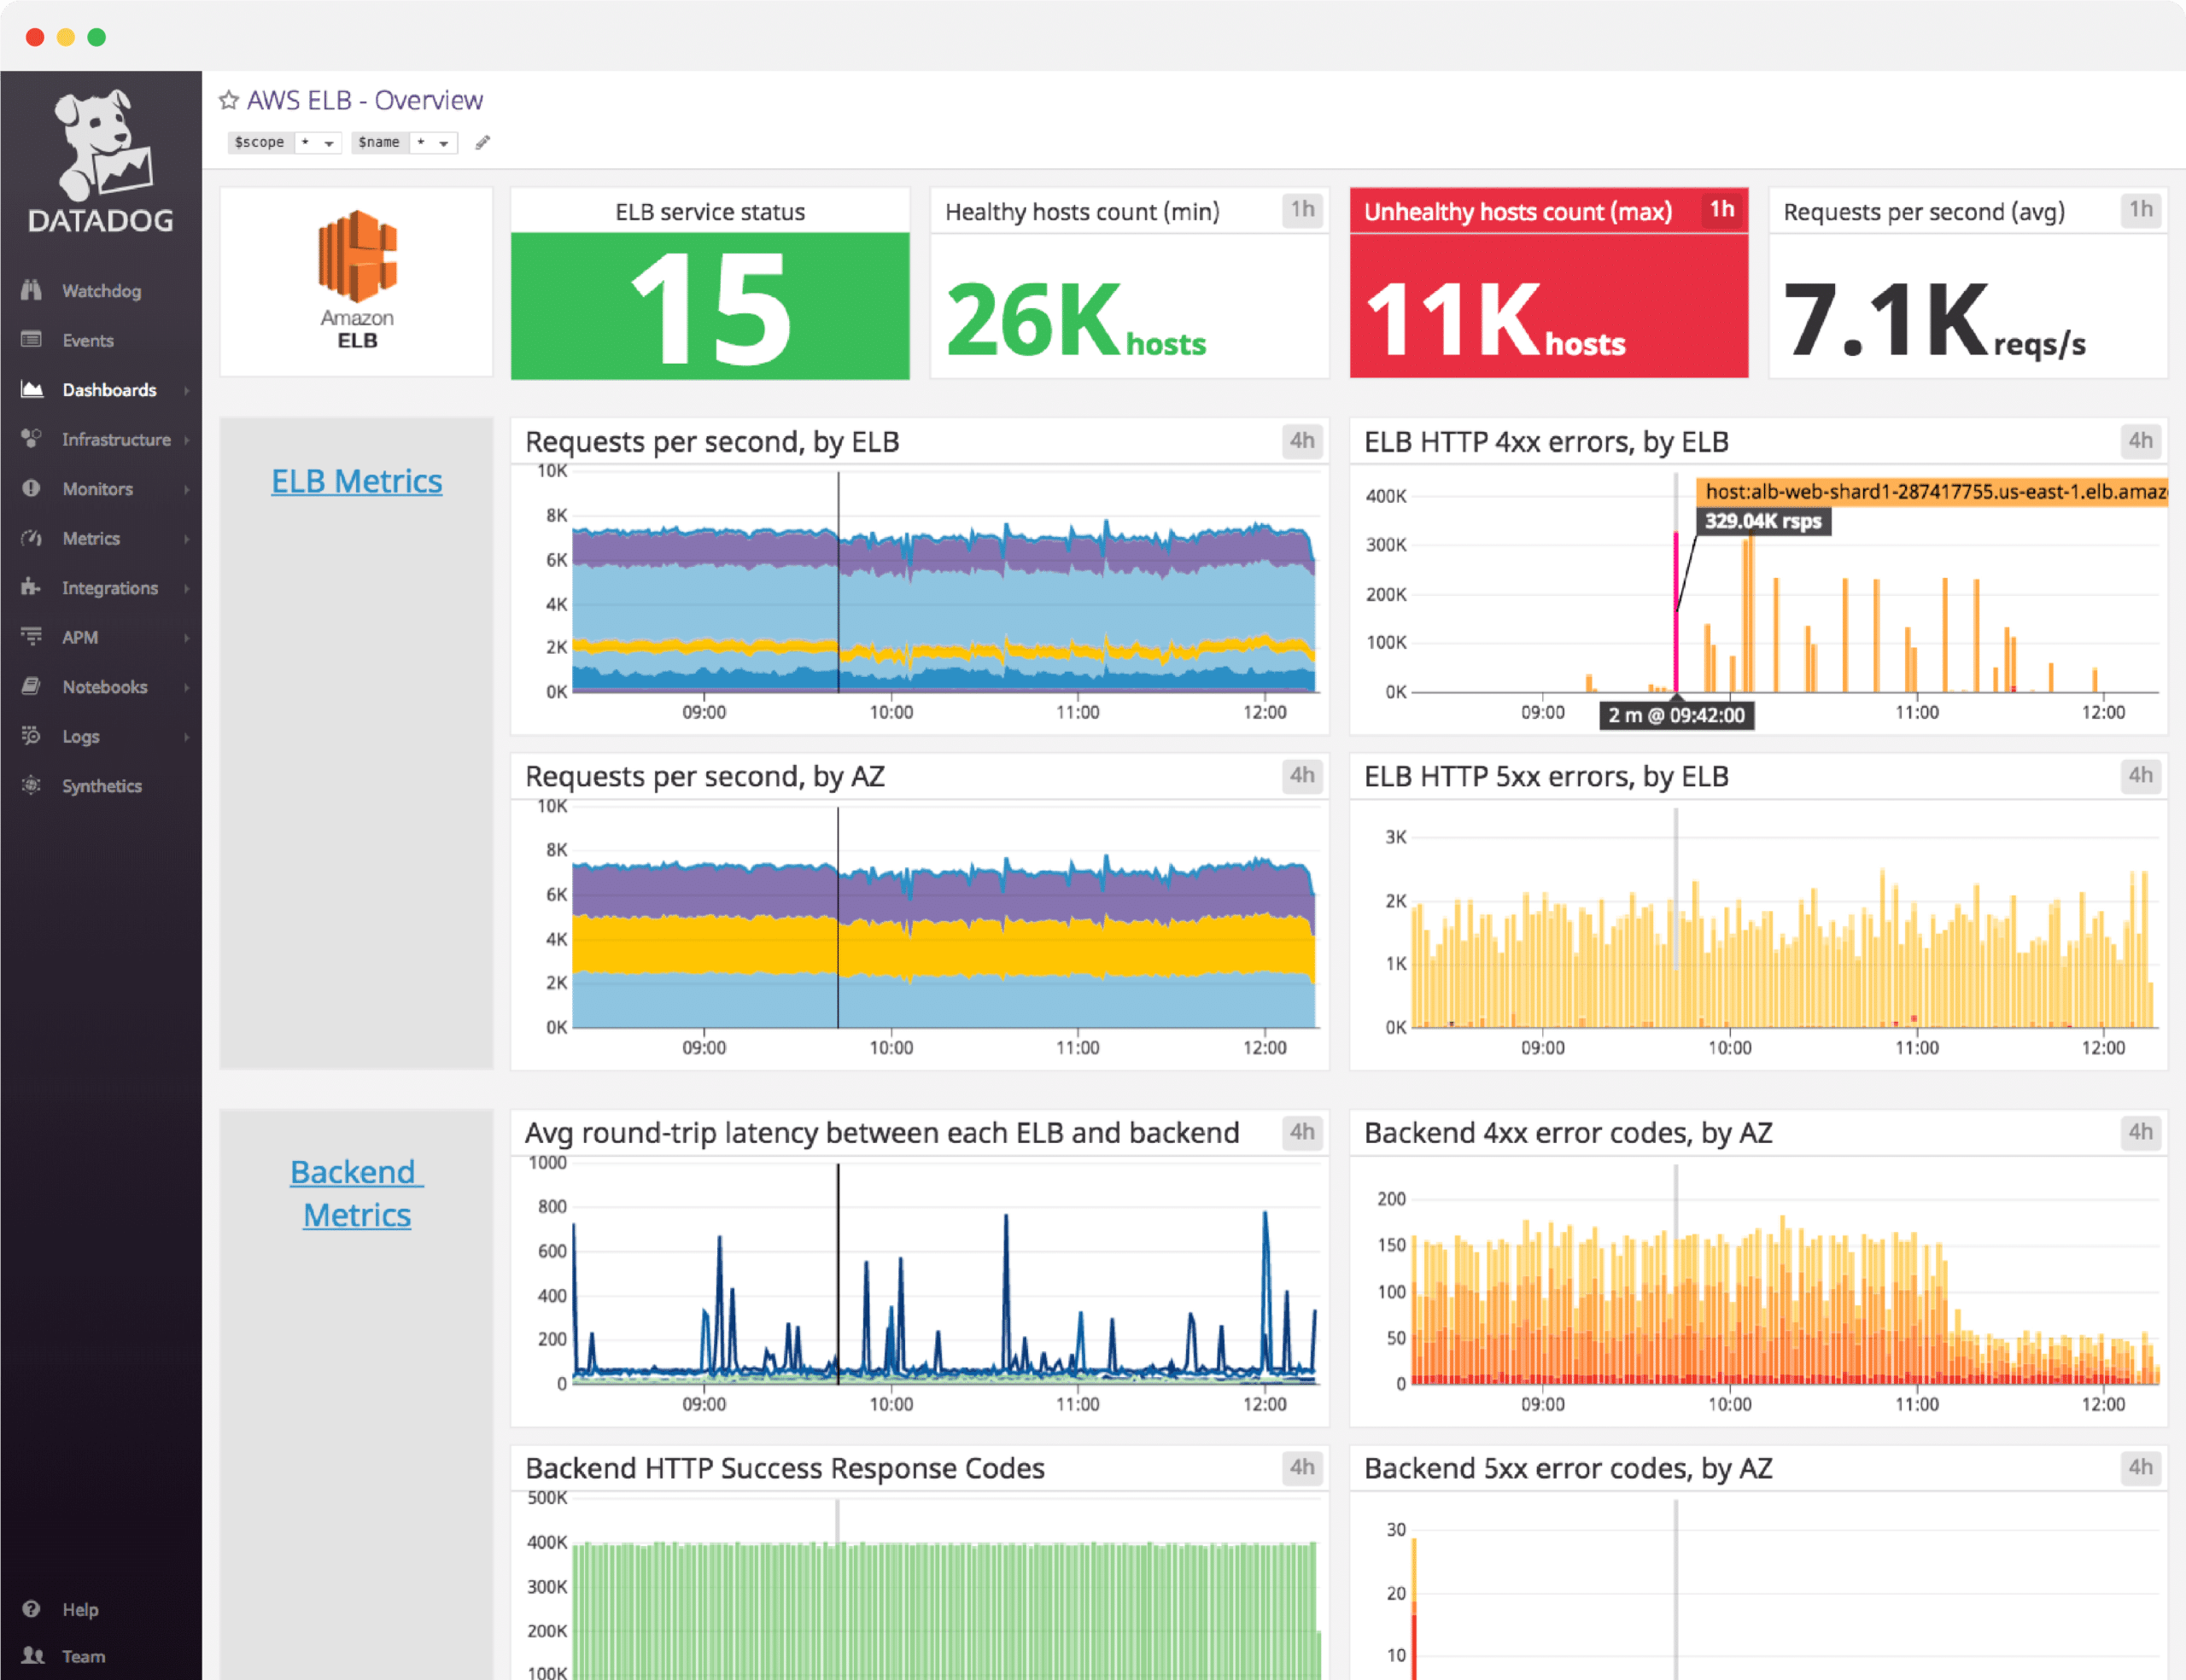
Datadog is a cloud monitoring tool that uses a SaaS-based analytics platform for monitoring servers, databases, services, tools, and more. In fact, it is so comprehensive that its manufacturers claim that you can see everything inside every stack or app at any scale and from anywhere.
Key Features:
- Collects metrics from ELB and analyzes them to give meaningful insights
- Monitors a wide range of things from hosts to workloads and includes many performance metrics as well
- Intuitive dashboard is highly customizable, allowing a birds-eye view of the application’s performance
- Mobile app to help stay on top of metrics, regardless of your location
- Detects anomalies and notifies you right away
- Configure alerts for custom notifications
- Sends notifications via email, Slack, or PagerDuty
- Seamless integrates metrics across the full DevOps stack
- Provides more than 450 integrations
- Quickly searches, filters, and analyzes logs for fast troubleshooting
- Gives automated tagging and correlation to get meaningful insights that fit into the context
- Comes with AI-powered self-maintaining tests to save on costs
- Visualizes values for every session
- Use custom metrics to analyze existing data
- Enables you to filter traffic using tags
- Builds graphs in real-time
- Uses Restful HTTP API for full data access when needed
Why do we recommend it?
Datadog provides an exceptionally comprehensive SaaS-based analytics platform capable of monitoring a broad spectrum of metrics across servers, databases, and services. Its seamless integration with over 450 tools and customizable, intuitive dashboard makes it an industry standout.
Who is it recommended for?
Datadog is ideal for DevOps teams, IT professionals, and businesses that require a high level of customization and extensive integrations. It’s particularly beneficial for organizations looking for real-time metrics, alerts, and in-depth analytics to monitor and improve their application’s performance.
Pros:
- Over 450 integrations for extensive coverage
- Anomaly detection with instant notifications
- Real-time log analysis for quick troubleshooting
Cons:
- Possibly overwhelming for smaller teams
Datadog comes in three plans.
- Free ($0) – Retains metric for one day and supports up to five hosts
- Pro ($15 per host per month) – 450+ integrations, out-of-the-box dashboards, and retains metrics for 15 months.
- Enterprise ($23 per host per month) – Machine-learning based alerts, live processes, and premium support
Click here for a 14-day free trial.
3. Amazon CloudWatch
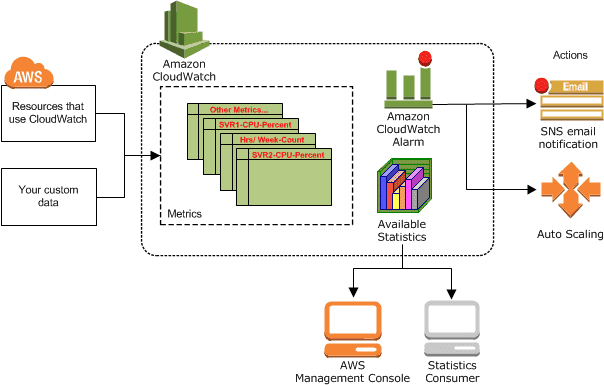
Amazon’s CloudWatch collects the logs, metrics, and events, analyzes them, and presents them through automated dashboards, so you can see all the right patterns. Such a unified view of your EC2 instances and their performance can give you a better idea of the state of your ELB, so you can plan accordingly. This service is built specifically for DevOps engineers, IT admins, and developers to get a 360-degree view of ELB health checks.
Key Features:
- Correlates data from across different AWS resources
- Natively integrates with more than 70 services
- Sends alarms based on pre-set thresholds
- Can also be used to trigger workflows
- Gives the rate of performance utilization and optimization
- Allows you to quickly troubleshoot operational problems
- Comes with built-in and custom metrics
- Helps to monitor application endpoints easily
Why do we recommend it?
Amazon CloudWatch provides a unified, 360-degree view of ELB health checks and EC2 instances, offering native integration with over 70 AWS services. Its capability to set alarms and trigger workflows based on preset thresholds makes it a powerful tool for monitoring and optimization.
Who is it recommended for?
Amazon CloudWatch is best suited for DevOps engineers, IT administrators, and developers who are deeply integrated with AWS services. It’s especially useful for those looking to automate alerts and actions based on specific performance thresholds in a multi-service AWS environment.
Pros:
- Native integration with over 70 AWS services
- Real-time alarms and workflow triggers
- Streamlines troubleshooting of operational issues
Cons:
- Limited features in the free plan
- Can be complex for new AWS users
The free plan restricts you to ten detailed monitoring metrics at a one-minute interval, one million API requests, 10 alarm metrics, 5GB log data, and one contributor insights rule per month. The paid plan, on the other hand, offers no limits and you pay as you go. The pricing tier:
- First 10,000 metrics – $0.30
- Next 240,000 metrics – $0.10
- Next 750,000 metrics – $0.05
- Over 1,000,000 metrics – $0.02
Click here to get started.
4. Dynatrace
Dynatrace is a new-age platform that leverages advancements in artificial intelligence to monitor your applications, gathers data, analyze, and give you the right insights for boosting performance.
Key Features:
- Provides out-of-the-box insights into AWS elastic load balancers
- Discovers your AWS infrastructure before collecting performance metrics from its components
- Provides actionable data about your ELB instance’s latency, requests, backend connection errors, and EC2 failure rates
- No code changes required
- Its intuitive dashboards provide comprehensive insights
- Detects anomalies and provides the root cause
- Scales well with your business
- Offers open APIs for seamless integration
Why do we recommend it?
Dynatrace stands out for its use of artificial intelligence in performance monitoring, providing actionable insights without requiring code changes. The platform scales easily with your business, ensuring long-term viability.
Who is it recommended for?
This tool is ideal for organizations that are seeking an intelligent, scalable solution for monitoring AWS infrastructure, including ELB and EC2 components. It’s particularly useful for businesses that require no-code solutions and prioritize automated, AI-driven analytics.
Pros:
- AI-driven insights without code changes
- Out-of-the-box insights into AWS ELB
- Comprehensive dashboards for easy monitoring
Cons:
- Pricing packages can be complex
Dynatrace offers six pricing packages and they are:
- Full-stack monitoring: Monitors apps, microservices, and infrastructure – starts at $69/month for an 8GB host
- Infrastructure monitoring: Observes cloud platforms, containers, and data center technologies – starts at $21/month for an 8GB host
- Digital experience monitoring: Optimizes user experience across mobile, web, hybrid, and IoT applications – starts at $11/month for 10k digital monitoring units
- Application security: Checks runtime application vulnerabilities and optimizes for cloud and Kubernetes – starts at $10/month for an 8GB host
- Open ingestion: Provides log monitoring, custom metrics, and events, and FaaS – starts at $25/month for 10k Davis Data Units
- Cloud automation: Observes the entire life-cycle and provides intelligent insights – custom pricing.
Click here for a 15-day free trial.
5. Splunk
Splunk has come up with a new class of apps called the Hunk App for AWS ELB to provide critical insights into the performance of your EC2 instances and ELB health checks.
Key Features:
- Comes with a pre-built knowledge base of dashboards, reports, and alerts
- Gives real-time visibility into your AWS environment
- Makes it easy to configure the inputs
- Has CIM-compliant fields and tags for easy integration of ELB data into your existing monitoring solution
- Highlights problems and anomalies in your AWS environment
- Gives suggestions and recommendations based on your existing configurations to optimize your resources
- Ensures adherence to compliance standards with a full audit trail
- Leverages the power of machine learning to provide rich insights
- Helps to manage AWS costs by giving you a comprehensive idea of the used and unused resources
Why do we recommend it?
Splunk’s Hunk App offers a comprehensive, pre-built knowledge base that provides real-time visibility into your AWS environment. Its use of machine learning for insights and suggestions makes it a powerful tool for optimization and problem-solving.
Who is it recommended for?
Splunk is recommended for organizations that are looking for a robust AWS monitoring tool with the added benefit of machine learning capabilities. It’s particularly useful for businesses that need real-time insights, cost management, and a high level of customization and integration.
Pros:
- Machine learning for enhanced insights
- Compliance adherence with full audit trails
- Effective AWS cost management tools
Cons:
- Steep learning curve for new users
Hunk App for AWS ELB is FREE with a Splunk account. Click here to get started.
6. Sumo Logic
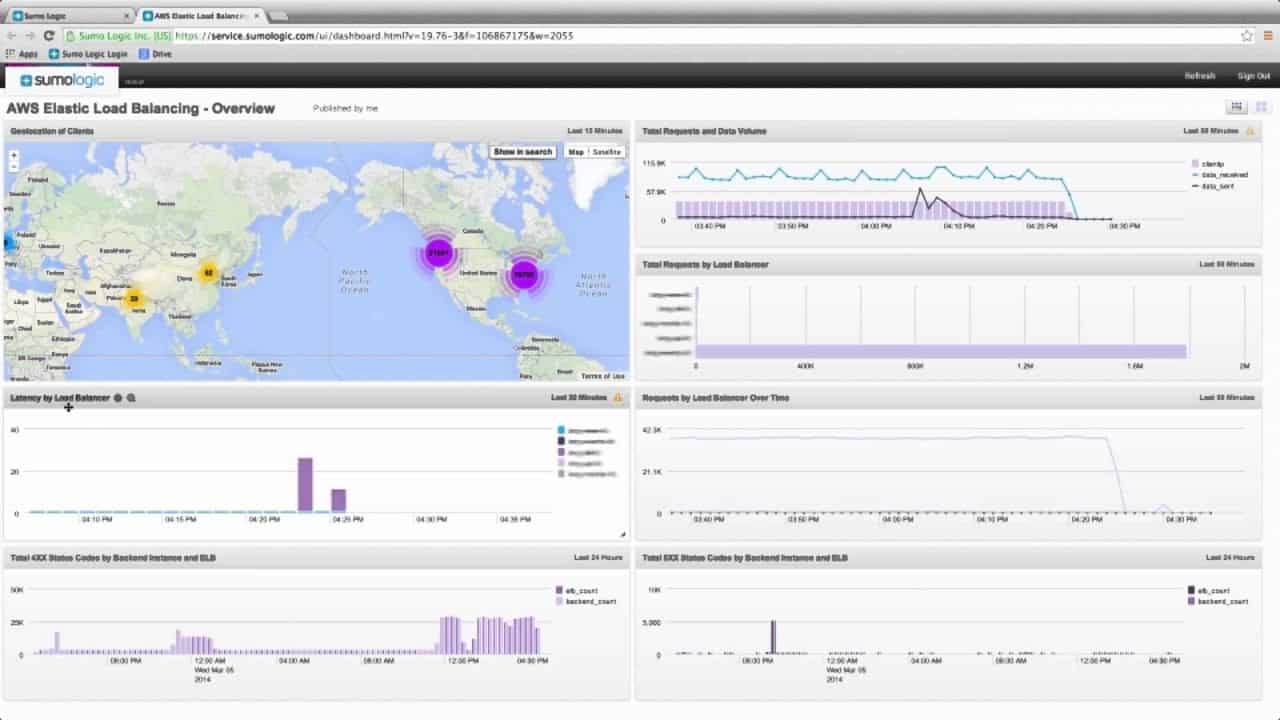
Sumo Logic offers an AWS ELB app that monitors the performance of your ELB configuration in real-time. It optimizes your configuration and makes it more applicable for your infrastructure.
Key Features:
- Provides intuitive and troubleshooting
- Converts raw data into easy-to-understand visuals that add meaning to your business
- Discovers the root cause of latency
- Offers real-time monitoring
- Drills down to the smallest of events to give you the most detailed information
- Comes with customizable dashboards
- You can automate the events that trigger established thresholds.
- Gives actionable forensics
Why do we recommend it?
Sumo Logic stands out for its real-time monitoring and in-depth event analysis, allowing you to pinpoint the root causes of latency. The tool offers intuitive troubleshooting along with customizable dashboards, making it highly versatile and insightful.
Who is it recommended for?
Sumo Logic is recommended for businesses that require real-time, detailed monitoring of their AWS ELB configurations. Its capabilities make it suitable for organizations that are looking to optimize their cloud infrastructure actively and react quickly to performance-related issues.
Pros:
- Real-time, in-depth ELB performance monitoring
- Customizable dashboards for tailored insights
- Easy integration with existing Sumo Logic apps
Cons:
- May require additional setup for full functionality
It is free to add on to the existing Sumo Logic app. Click here for a 30-day free trial
Conclusion
To conclude, ELB is a tool from AWS that balances your network load and ensures that your applications perform at optimal levels. Though you can monitor ELB through the AWS console or CLI, it is not so intuitive and the data collected may not give you a comprehensive picture by itself. Instead, when you use third-party tools to connect this data with your overall infrastructure, you can get more meaningful insights.
Further, these tools come with a host of features such as customizable dashboards, root-cause analysis, relevant insights, and more.
We hope these aspects help you to choose a tool that’s most appropriate for your business.
