
Python is a popular programming language used to create desktop GUI applications, web apps, and interactive websites. This programming language comes with simple syntax, so it helps to create a readable codebase. Also, it supports multiple platforms and programming paradigms, which is probably why many well-known applications are built on Python.
As with any software or hardware, these Python applications also have to be monitored to ensure they are working the way they should. So now, you might wonder what metrics you should look for and how you can watch the health and performance of these applications.
Here is our list of the best Python monitoring tools:
- ManageEngine Applications Manager – EDITOR’S CHOICE This software package tracks applications, which refers to software, services, middleware, cloud platforms, and Web applications. It includes code profiling and performance tracking for a range of programming languages, including Python. Available for Windows Server, Linux, AWS, and Azure. Get a 30-day free trial.
- Site24x7 APM – FREE TRIAL Insight Python agent monitors and optimizes the performance of your Python applications and provides information on a wide range of metrics. Start a 30-day free trial.
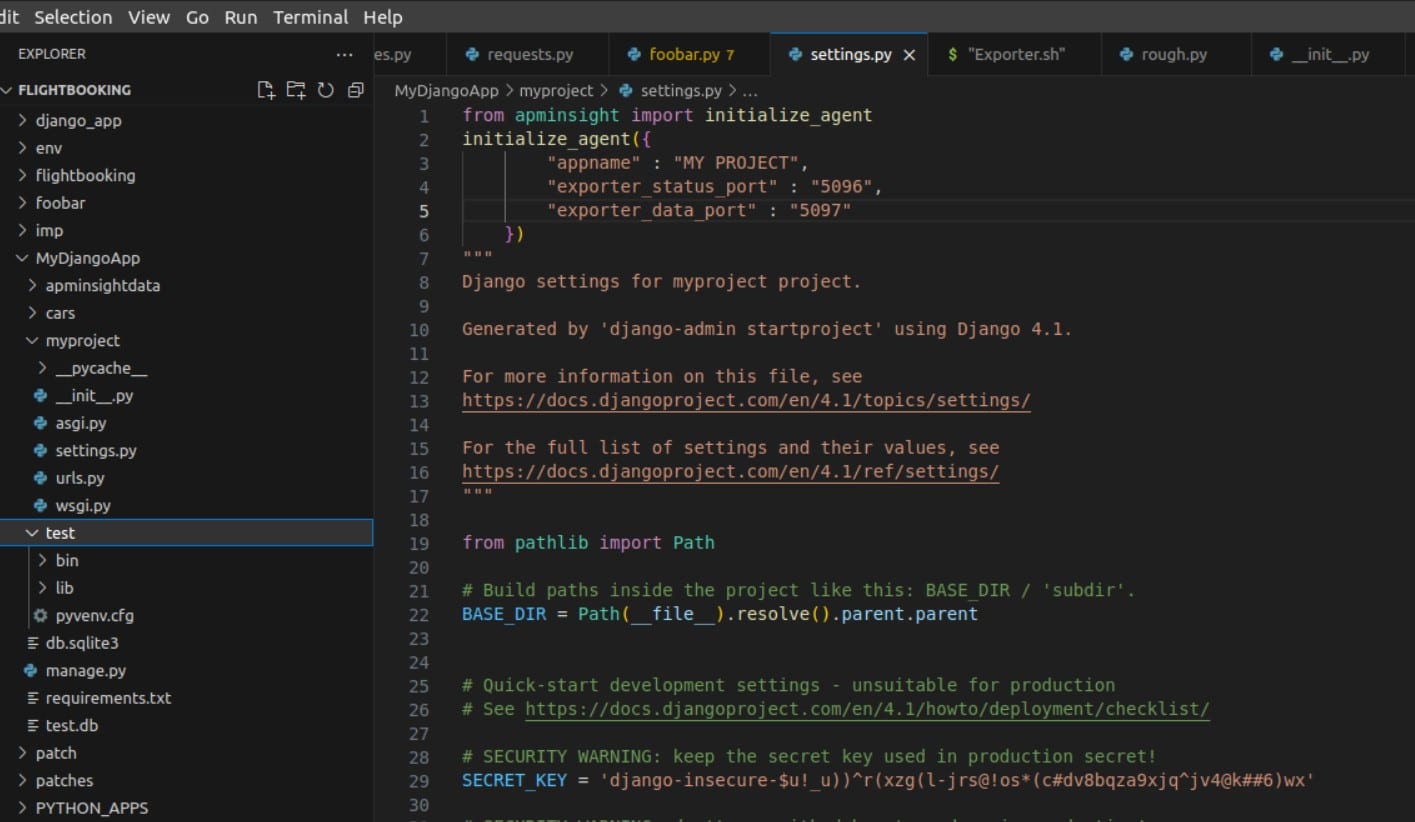
- Paessler PRTG – FREE TRIAL This is a sensor-based tool where different sensors analyze different aspects of your Python applications. These metrics are combined to give you a comprehensive view of the performance of your Python applications. Access a 30-day free trial.
- Datadog APM Monitors Python application data and analyzes stack traces to give detailed insights into the health and performance of Python applications.
- Solarwinds Observability This tool handles all aspects of Python application monitoring. Its advanced features streamline tracing, code profiling, exception tracking, performance monitoring, and more.
- Dynatrace Discovers and resolves performance issues in your Python code and applications for improved performance and traceability.
- AppDynamics This tool monitors the end-to-end performance of Python applications and provides the necessary metrics for tracking important aspects of their performance.
- NewRelic Monitors your Python applications, identifies performance issues, and helps you to resolve the same at the earliest.
- Stackify Proactively improves application performance by retracing users and observing applications in production environments.
- Atatus Provides complete visibility into the performance of your Python applications.
Let’s now jump into a detailed review of each of these tools.
The Best Python Monitoring Tools
1. ManageEngine Applications Manager – FREE TRIAL
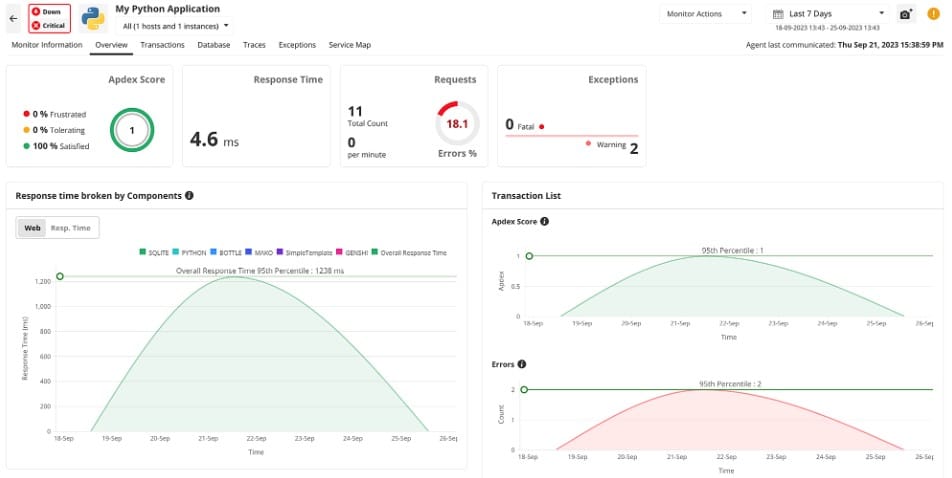
ManageEngine Applications Manager includes Python Performance Monitoring through availability and response time monitoring and code profiling. If the Python system is cloaked by methods such as containerization, the Applications Manager can collect performance data through distributed tracing.
Key Features
Here are some of the most important features of the Applications Manager package:
- Monitors all software systems and the servers and cloud platforms that host them
- Discovers all systems by examining process execution in each registered host
- Tracks the passing of control to other packages, leading to the creation of an application dependency map
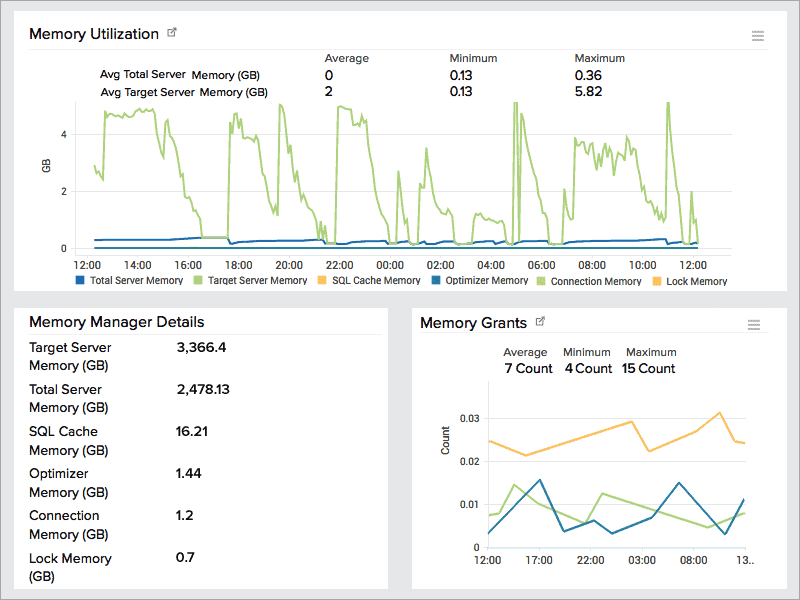
- Identifies the resources of each host and the total capacity of each
- Calculates the resource requirements of each software package and notes how that changes during the process of execution
- Maintains a list of all running processes, referencing their current and upcoming resource needs
- Software composition analysis by identifying all the components in a Web application
- Forecasts short-term resource requirements and generates alerts if shortages will occur
- Tracks Web applications written in plain text scripting languages, including Python
- Examines the resource requirements of each function in a program written in Python and other Web application languages
- Displays the code of a Python program as it runs, offering the option to pause and step through line by line – the same service is available for other plain text scripting languages
- Distributed tracing for Web application code that is cloaked and can’t be read
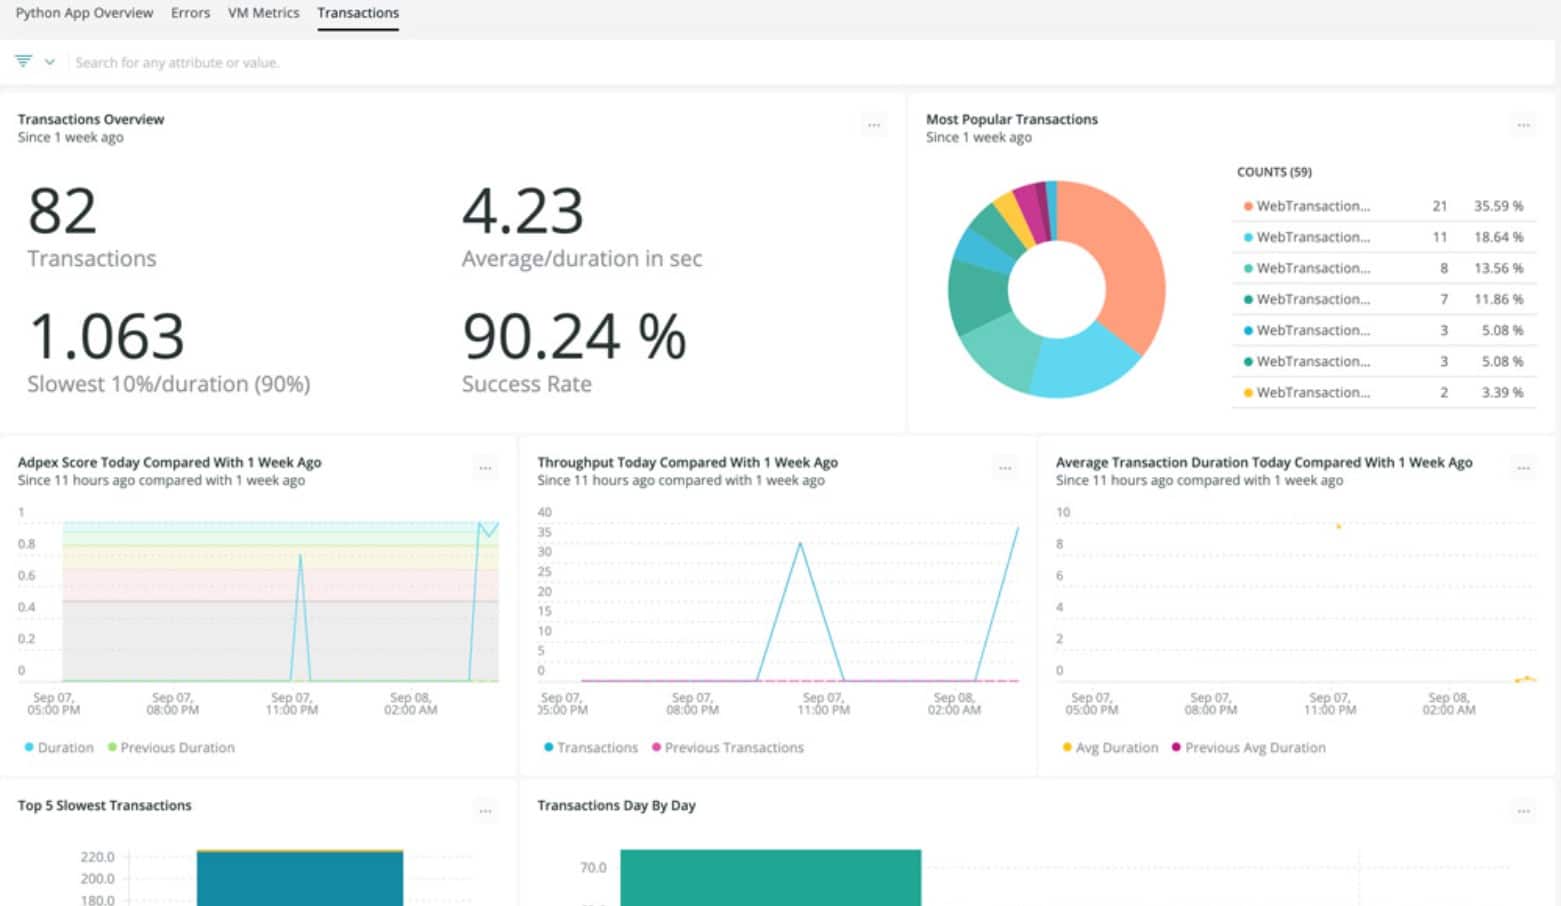
- Provides an Apdex score that explains the user satisfaction of Web page features written in Python
- Response time reports
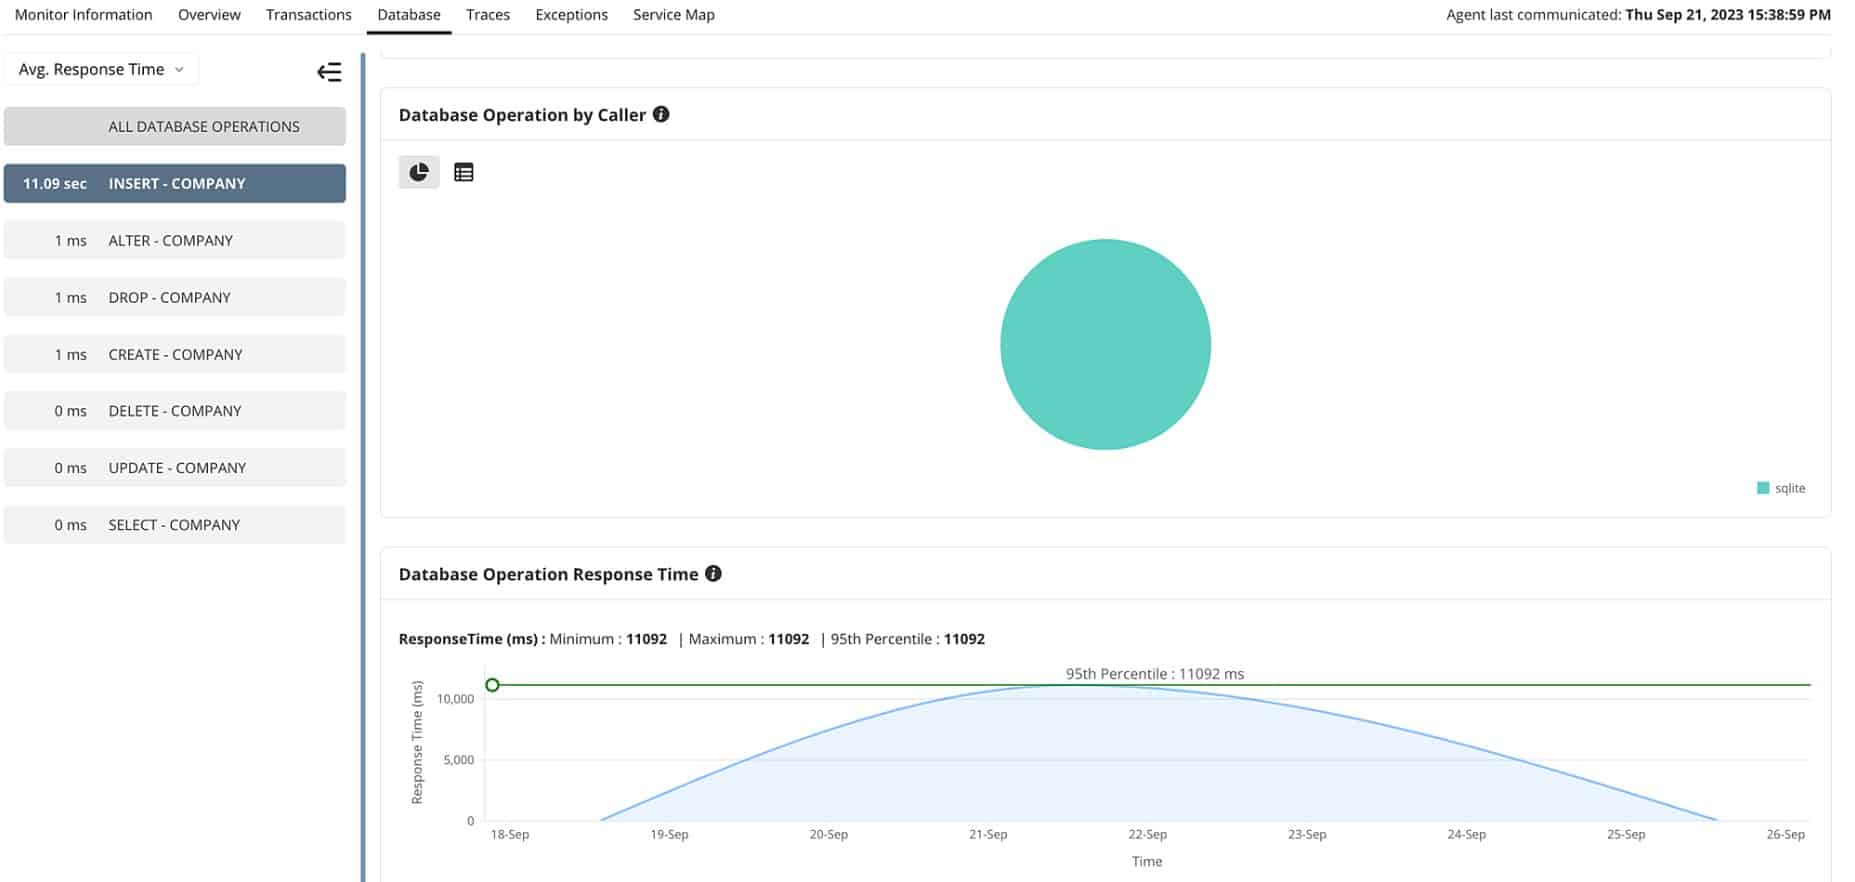
- Shows database activity simultaneously with Web application code
- Request rate and error rate statistics
Why do we recommend it?
ManageEngine Applications Manager is a very large package of services that includes Python performance monitoring and many other services that relate to the tracking of delivery for servers, cloud platforms, and all of the systems that run on them. This tool lets you see each line of Python code as it executes if the code is accessible. If it isn’t the monitor uses distributed tracing and synthetic monitoring.
Who is it recommended for?
This is a useful package for any business but its Web application monitoring features mean that companies that produce or use Web systems will get more from it. The package is available in a Free edition but that is limited to monitoring five assets and it doesn’t include distributed tracing or code profiling. Those services aren’t included in the paid plans, either, though – they are add-ons.
There are three plans for ManageEngine Applications Manager:
- Free – five monitors
- Professional – Monitors up to 500 applications: Starts at $395 per year
- Enterprise – Monitors more than 500 applications up to 10,000: Starts at $9,595
Applications Manager is a software package that can be installed on Windows Server or Linux. It is also available as a service on the marketplaces of AWS and Azure. ManageEngine offers this package on a 30-day free trial.
EDITOR'S CHOICE
Download: Start a 30-day FREE Trial
Official Site: https://www.manageengine.com/products/applications_manager/download.html
OS: Windows Server, Linux, AWS, and Azure
ManageEngine Applications Manager is our top pick for a Python monitoring tool because it offers many ways to monitor the performance of a Python program. The tool includes a discovery service that scans through the activity on enrolled servers and cloud platforms. This spots the programs that each platform is running and that will include your Python programs. The service watches each program and watches as control passes to external functions and then passes back to the main program. It also records the ways that programs act upon each other – which applications called other services, such as databases. The whole environment gets mapped, right down to server resource access. The Applications Manager package includes a code profiler that shows the code of your application as it runs. If you are examining a compiled program or a function that is hidden behind an API, the monitor won’t have access to the code. In these instances, the service uses distributed tracing to follow the activity of the module and record its statuses and performance. The system also looks at function cohesion, examining parameters and data passing between them.
2. Site24x7 APM – FREE TRIAL
Site24x7’s APM Insight Python Agent monitors Python applications and provides many metrics around them, such as the response time, throughput, database operations, and more. You can track these metrics and optimize them for enhanced performance.
Key Features
Below are the salient features of the APM Insight Python Agent.
- Supports Django and Flask frameworks, and jinja2, SQLite, pymysql, psycopg2, and pymemcache databases
- Requires Python version 3.5.0 and above to work
- Provides the option to mark key transactions, traces, and deployments for detailed analysis
- Comes with many configuration options to suit your preferences
- Provides accurate insights into end-user experience
- Gives visibility into the hidden aspects of application performance and monitoring
- Visualizes interaction patterns
- Offers an in-depth understanding of real-world problems impacting users
- Analyzes performance across browsers, platforms, ISPs, geographies, and more
- Supports single-user application monitoring through AJAX calls
- Monitors web pages built using the MVC frameworks.
- Enables you to isolate performance issues and resolve them at the earliest
Why do we recommend it?
Site24x7 APM Insight Python Agent offers robust and granular monitoring features, including support for multiple databases and frameworks. With capabilities such as key transaction marking and end-user experience insights, it provides a holistic view of your Python application’s performance.
Who is it recommended for?
This tool is ideal for development and operations teams using Django or Flask frameworks, particularly those that require compatibility with multiple databases such as SQLite, pymysql, psycopg2, and pymemcache. It’s also well-suited for organizations that want to deeply understand end-user experiences across various browsers and geographies.
Site24X7 offers four pricing plans, namely
- Starter – $9 per month. Supports ten websites/servers and one synthetic web transaction
- PRO – $35 per month. Supports 40 websites/servers and three synthetic web transaction
- Classic – $89 per month. Supports 100 websites/servers and five synthetic web transaction
- Enterprise – $225 per month. Custom
Start a 30-day free trial.
3. Paessler PRTG – FREE TRIAL
Paessler PRTG is an advanced sensor that can monitor different aspects of your Python applications and give you a comprehensive view of the health and performance of these applications.
Key Features
Here’s a look at the PRTG features related to Python monitoring.
- Supports many languages such as Dutch, French, German, Spanish, Russian, Japanese, Portuguese, and Chinese
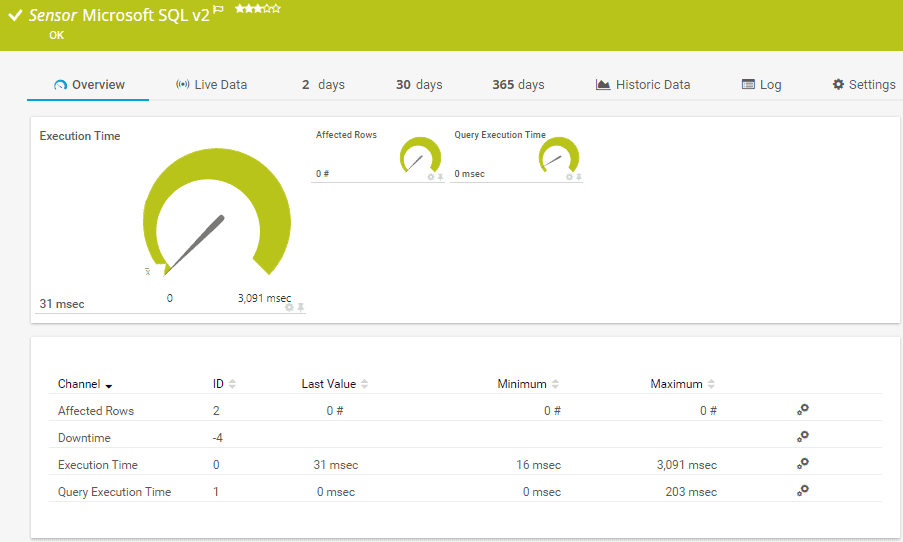
- This sensor returns a JSON value that can use in further processing
- The values are displayed in a visually appealing graph
- Paessler recommends Windows 2012 R2 or higher versions for best compatibility
- Easy to install and use
- Allows you to extend its functionality through custom scripts
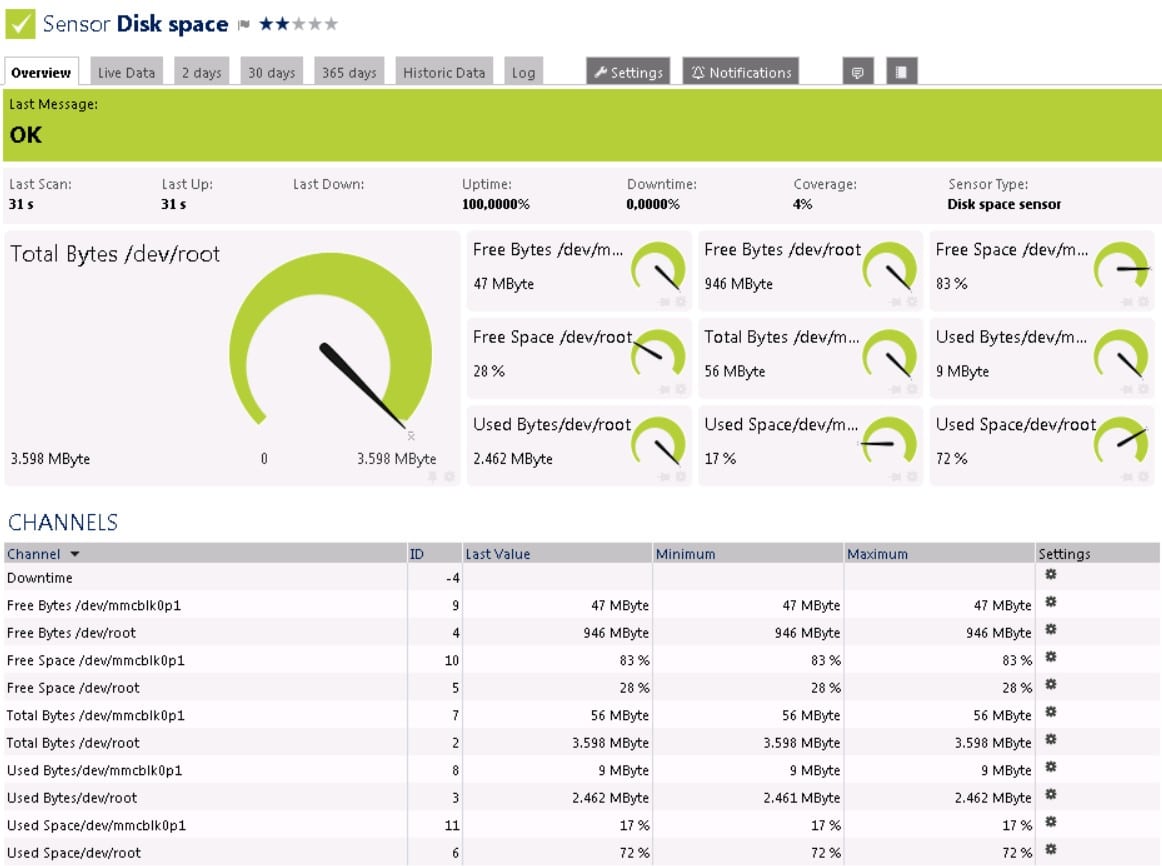
- Supports the following channel types: bandwidth, memory, disk, custom, and file
- Offers extensive configuration options
- Allows many scanning interval choices
- Provides granular control through user access
Why do we recommend it?
Paessler PRTG excels in offering a comprehensive view of Python application health and performance through its advanced sensor capabilities. It provides granular control, supports multiple languages, and allows extensive customization, making it a highly flexible solution for monitoring Python applications.
Who is it recommended for?
This tool is recommended for businesses with a global presence, given its multi-language support. It’s also ideal for organizations using Windows Server 2012 R2 or higher and those who seek the ability to extend monitoring functionality through custom scripts. Paessler PRTG is suitable for anyone needing detailed control over monitoring parameters, including scanning intervals and user access.
With PRTG, you pay for what you use. Typically, it is one sensor per metric per device, and you pay to depend on the number of metrics and devices you use. The pricing slab is as follows
- First 100 – FREE
- Up to 500 – $1,750
- Up to 1000 – $3,200
- Up to 2500 – $6,500
- Up to 5000 – $11,500
- Unlimited – $15,500
- 20,000+ sensors – custom quote
You can work out what your network requirements are with a 30-day free trial.
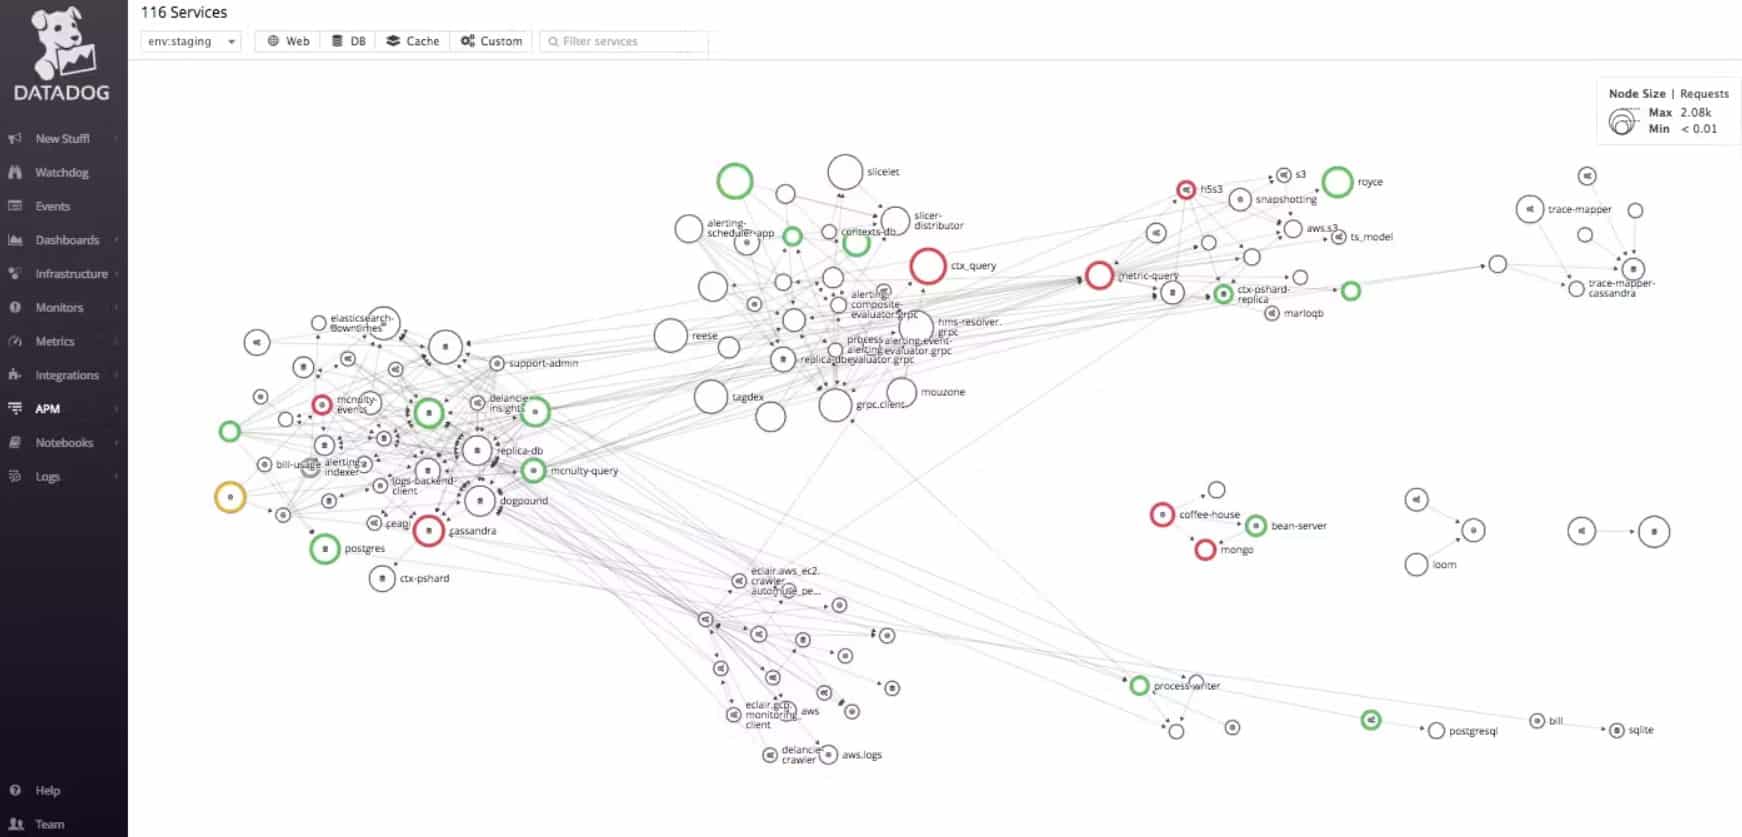
4. Datadog APM
Datadog APM is a full-stack Python monitoring tool that analyzes stack traces and gives detailed information on the performance of your Python applications, so you can make the necessary changes to optimize their performance.
Key Features
The features of Datadog APM related to Python monitoring are:
- Monitors Python performance to meet SLA requirements
- Identifies application dependencies
- Automatically generates service maps
- Analyzes stack traces to give insights
- Troubleshoots Python issues at the application and end-point levels
- Highlights error requests in the trace view
- Correlates Python data from traces and logs to pinpoint the root cause
- Analyzes log patterns for repetitive errors
- Provides built-in support for Python platforms such as Django and Flask
- Troubleshoots Python queries that impact performance
- Correlates information from 600+ integrations to provide a comprehensive view
- Automatically tracks Python data from auto-scaling infrastructure
- Auto-detects Python performance problems without the need for additional configurations
- Searches, filters, and analyzes Python stack traces
- Maps Python applications and their supporting architecture in real-time.
- Traces asynchronous Python code
Why do we recommend it?
Datadog APM offers robust, full-stack monitoring capabilities specifically for Python applications. From automatically generating service maps to providing in-depth insights via stack trace analysis, the tool helps you optimize performance comprehensively.
Who is it recommended for?
This tool is ideal for development teams who use Python frameworks like Django or Flask and require detailed performance analytics. It’s also beneficial for organizations that operate in auto-scaling environments and need to correlate data from multiple integrations. If you’re focused on meeting SLA requirements and seeking an APM solution with diverse pricing options, Datadog APM is a strong choice.
Datadog offers many plans, so you can pick the one that’s right for you. For example, the Infrastructure management plan comes in three flavors – Free, Pro ($15/host/month), and Enterprise ($23/host/month). Similarly, log management has two flavors – Ingest that starts at $0.10.ingested or scanned GB/month, and Retain or Rehydrate starts at $1.70/million logs/month. Click here to get started for free.
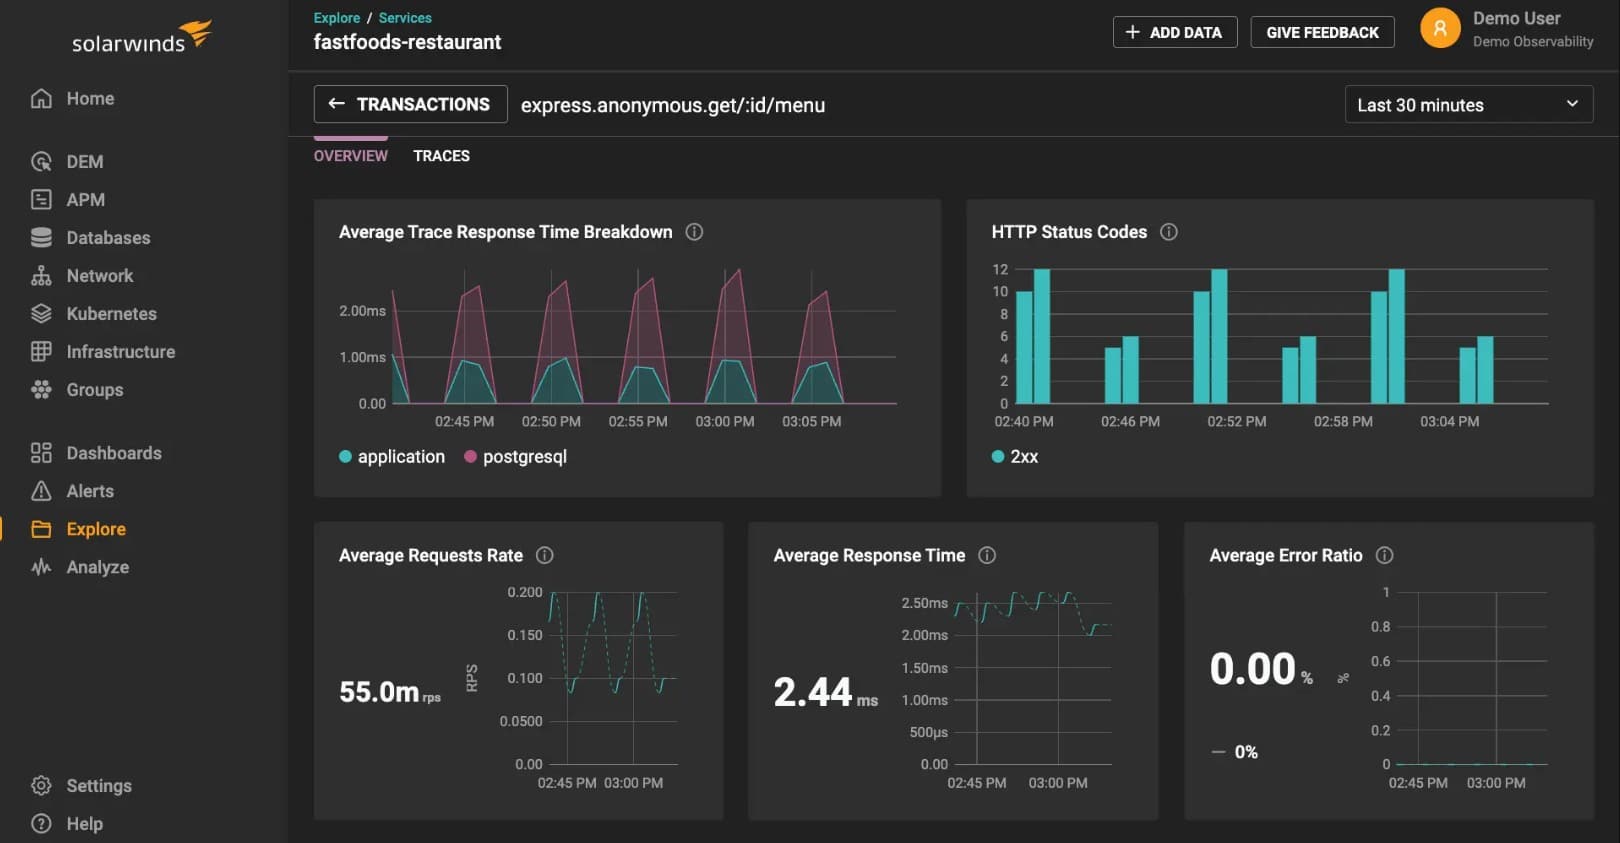
5. Solarwinds Observability
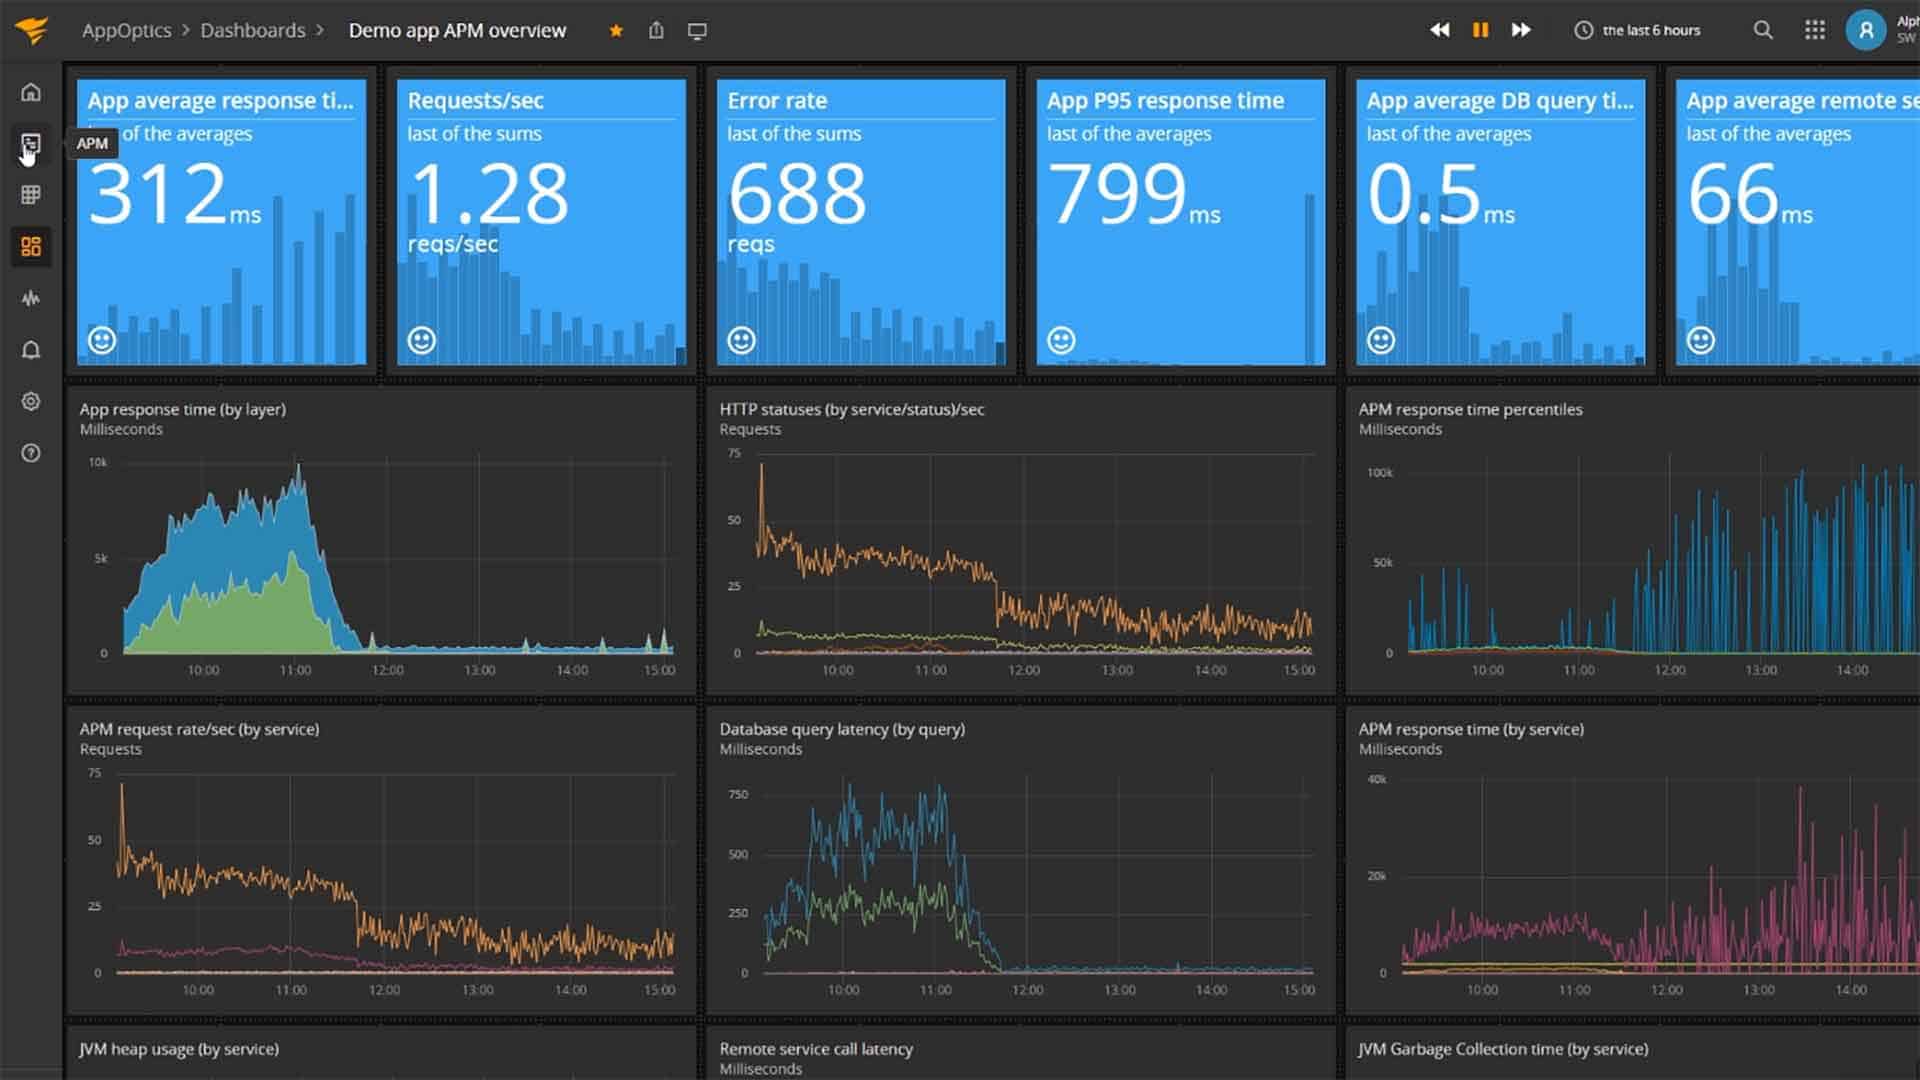
Solarwinds Observability (formerly AppOptics) is an application monitoring tool with advanced capabilities to monitor Python applications and their health and performance. Besides, it also tracks code-level changes, tracing, and exceptions.
Key Features
Below are the salient features of this tool.
- Its root cause summaries make it easy to identify the source of the problem
- Works well on both legacy applications and modern ones that run on Kubernetes
- Automatically evaluates service metrics so that you can see essential aspects such as the average response time, error rate, CPU utilization levels, error rate, and more.
- It’s a handy tool during both the development and testing phases to help create well-optimized Python applications
- Suggests code-level changes to ease the task for developers
- Provides the reason for the poor performance of applications so that they can be addressed at the earliest
- Supports distributed transaction tracing by following a request as it moves through multiple services and modules
- Traces exceptions to give a service context for each
- Offers live code profiling
- Troubleshoot transactions to help you understand the poor-performing ones
- Analyzes logs to give you in-depth insights
- Combines data across different stacks to give you a contextual view of the problem
- Isolates individual requests across systems for better diagnostics
- Monitors systems across all environments, from on-prem to highly distributed cloud apps
- Consolidates the monitoring of all applications and environments and presents the results in a single intuitive dashboard.
Why do we recommend it?
Solarwinds Observability offers an extensive range of features from root cause analysis to live code profiling, making it a comprehensive solution for Python application monitoring. Its capability to work well on both legacy and modern Kubernetes-based applications gives it a versatile edge.
Who is it recommended for?
This tool is particularly recommended for development teams that manage both legacy systems and modern microservices architecture, especially those running on Kubernetes. It’s also suitable for organizations that require detailed insights into application performance metrics across multiple environments, from on-premises to the cloud.
Solarwinds Observability comes in two pricing plans, and they are
- Infrastructure monitoring – $9.99 per host per month
- Infrastructure and application monitoring – $24.99 per host per month
Click here for a 30-day free trial.
6. Dynatrace
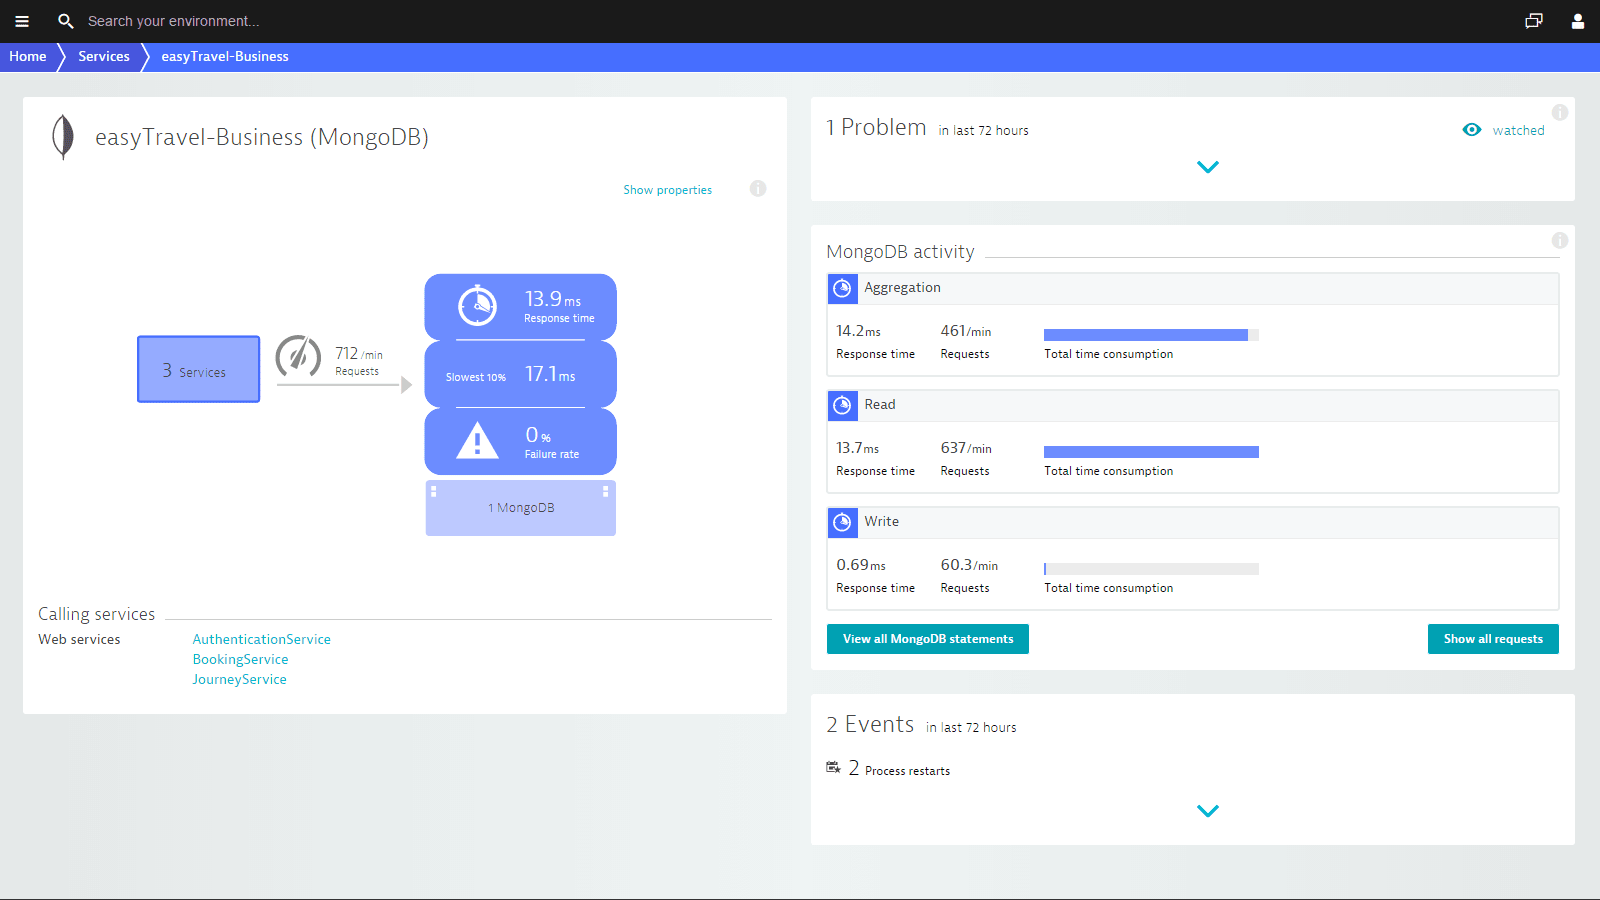
Dynatrace specializes in discovering and solving performance problems in your Python code and applications so that you can benefit from its increased performance and optimization.
Key Features
The features of Dyntace’s Python monitoring are:
- Provides a detailed view into all application and service dependencies
- Keeps track of all the Python processes
- Automatically tracks changes in Python’s live processes
- Monitor Python applications and services at the process level
- Makes a list of the calls made to and fro by your Python applications
- Focuses on process-specific context
- Displays only the essential metrics that have a significant impact on the application’s performance
- Pinpoints to the root cause of problems
Why do we recommend it?
Dynatrace offers a highly specialized focus on discovering and solving performance problems in Python applications. Its features like automatic tracking of live processes and pinpointing the root cause of issues make it a go-to choice for performance optimization.
Who is it recommended for?
This tool is ideal for organizations and development teams who are deeply concerned with the performance and optimization of their Python applications. It’s especially beneficial for those who want to understand application and service dependencies and require process-level monitoring to diagnose and fix performance issues.
Dynatrace offers six pricing plans, so choose the one that best fits your needs.
- Full-stack monitoring ($69/month for an 8-GB host) – Provides full-stack observability for apps, microservices, and infrastructure.
- Infrastructure monitoring ($21/month for an 8GB host) – Provides observability across cloud platforms, containers, and data center technologies.
- Digital experience monitoring ($11/month for 10K digital experience monitoring units) – Optimizes user experience across mobile, web, hybrid, and IoT applications.
- Application security ($10/month for an 8GB host) – Provides runtime application vulnerability detection and is optimized for the cloud and Kubernetes
- Open Ingestion ($25/month for 100K Davis Data Units) – Extends observability with log monitoring, custom metrics, and events, and FaaS traces
- Cloud automation – Custom
Click here to start a 15-day free trial.
7. AppDynamics
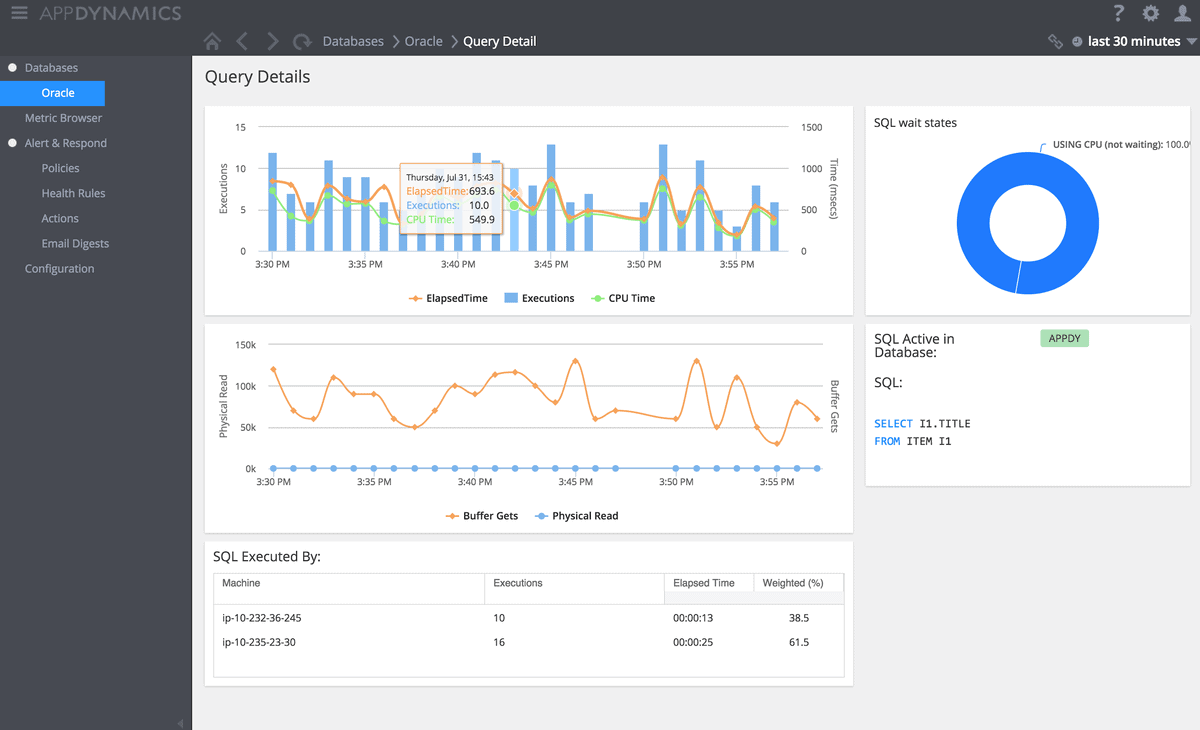
AppDynamics monitors the end-to-end performance of Python applications and handles the mapping and tracking of the critical performance metrics of these applications, even across the most complex and distributed environments.
Key Features
Here’s a look at the salient features of AppDyanmics’s Python monitoring capabilities.
- Monitors Python applications in real-time
- Correlates transactions across complex and distributed environments to provide a comprehensive view of the performance of Python applications and even your network in general
- Auto-discovers business transactions
- Ensures rapid identification and resolution of issues to avoid any impact on end-user experience
- Works well on applications that run on-premises or on the cloud
- Provides complete support for various frameworks and platforms, including Django, Flask, and Pyramid.
- Its APIs can be used to extend its functionality
- Enables you to manually instrument code for custom environments
- Visualizes and prioritizes performance issues
- Creates detailed call graphs to locate hot and slow spots in your network quickly
- Fixes errors proactively
- Pinpoints the specific queries that cause performance bottlenecks
Why do we recommend it?
AppDynamics excels in real-time monitoring of Python applications across complex and distributed environments. With features like auto-discovery of business transactions and rapid identification and resolution of issues, it offers a holistic view of your application’s performance.
Who is it recommended for?
This tool is recommended for enterprises and development teams that operate in complex, multi-layered environments, either on-premises or in the cloud. It’s especially useful for those using various frameworks like Django, Flask, and Pyramid, and who need to manually instrument code for custom environments.
AppDynamics comes in four plans, and they are
- Infrastructure Monitoring Edition – $6 per month per CU core
- Premium Edition – $60 per month per CU core
- Enterprise Edition – $90 per month per CU core
- Accurate user Monitoring – $.06 per 1000 tokens
You can also click here for a custom quote. Click here for a free trial.
8. NewRelic
NewRelic for Python monitors your Python applications, collects the necessary metrics for analysis, and helps identify the performance bottlenecks, so the same can be resolved at the earliest.
Key Features
Below are the features of NewRelic related to Python monitoring.
- Collects and analyzes business data to improve the performance of your applications
- Provides a ton of configuration options for easy customization
- Offers APIs to customize and extend the instrumentation
- Supports many frameworks and servers such as uWSGI and Gunicorn WSGI
- Provides distributed tracing if needed
- Generates multiple building blocks to customize your data
- Drives business decisions with the correct data
Why do we recommend it?
NewRelic excels in collecting and analyzing critical performance data for your Python applications. With extensive configuration options and support for various frameworks and servers, it offers a customizable approach to identifying performance bottlenecks.
Who is it recommended for?
This tool is ideal for businesses and developers who require a high level of customization and run applications on various frameworks and servers like uWSGI and Gunicorn WSGI. It’s also suited for those who rely on data-driven business decisions.
NewRelic comes in four editions, and they are
- Free
- Standard
- Pro
- Enterprise
Contact the sales team for custom pricing. Click here to get started.
9. Stackify
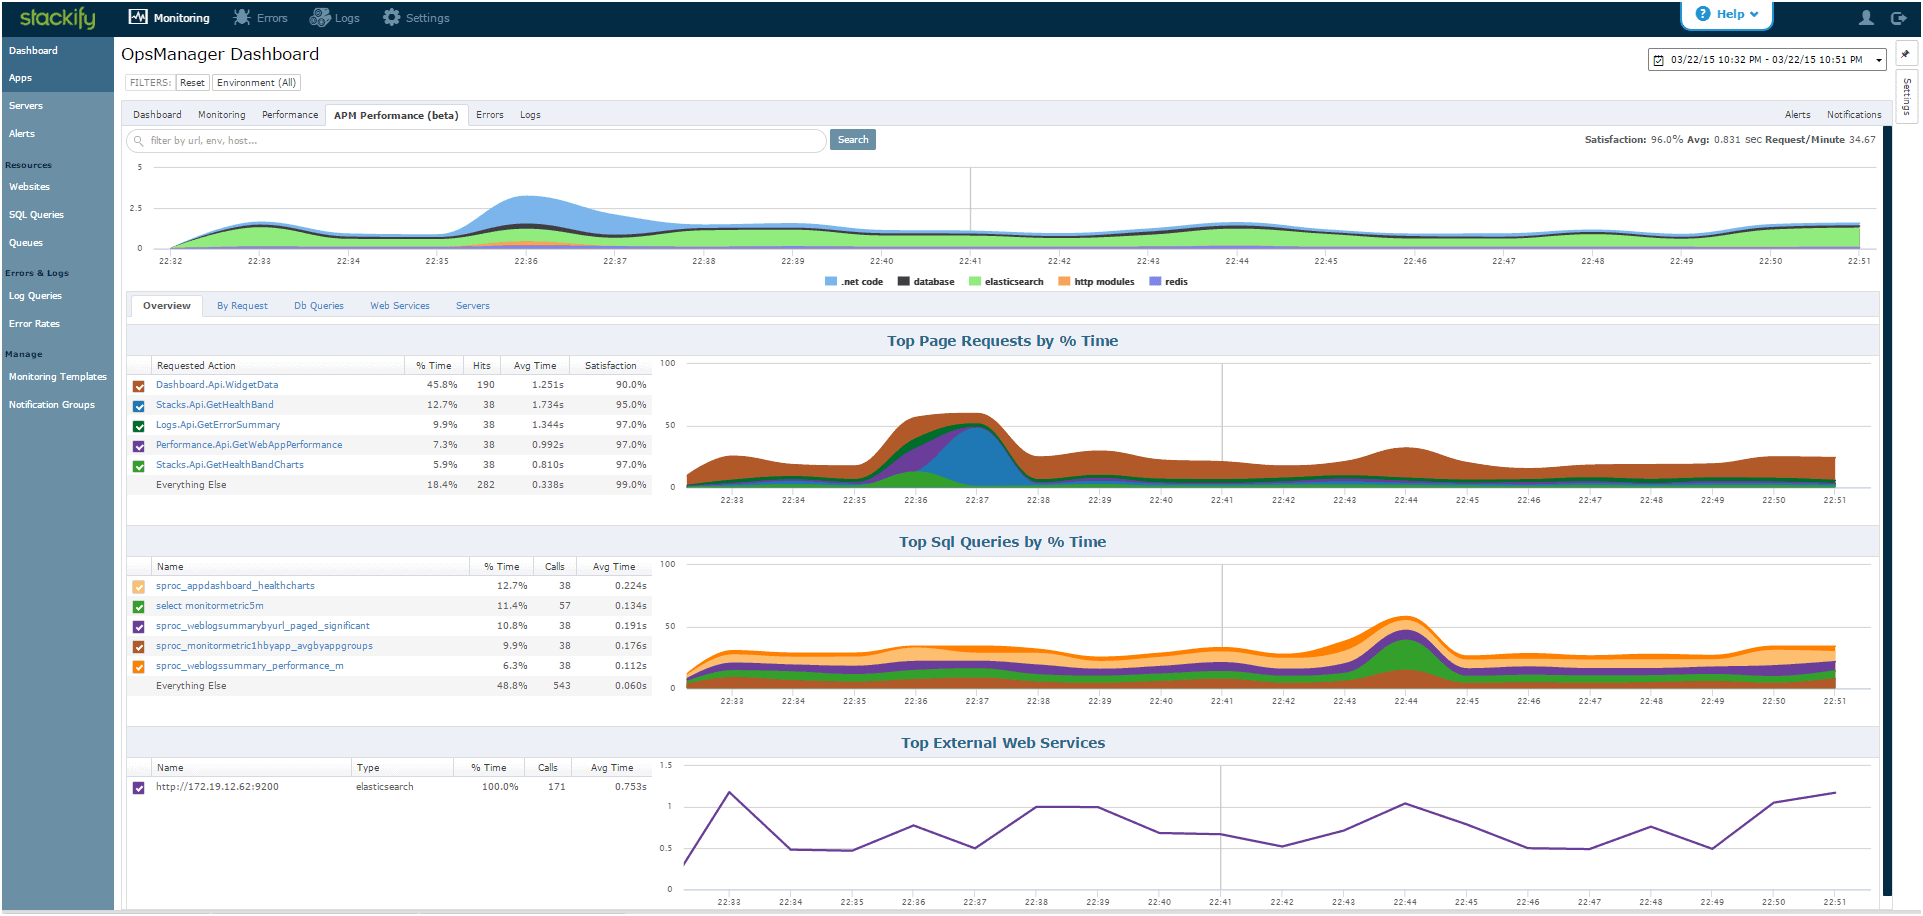
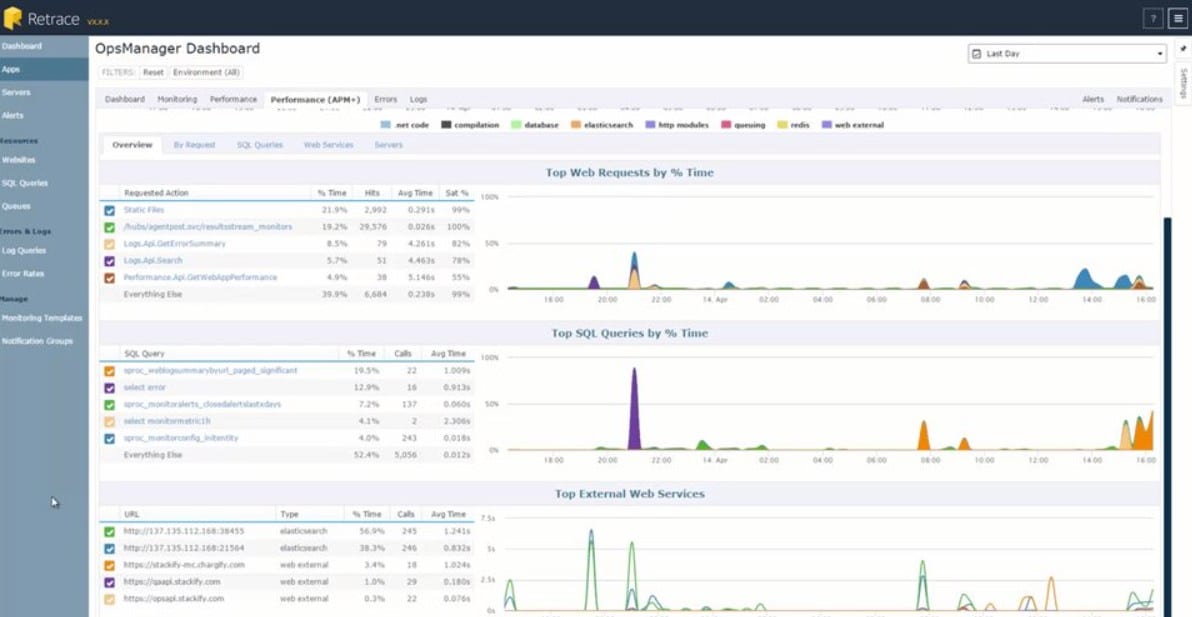
Stackify is a tool that proactively monitors application performance by retracing users and constantly observing the behavior and performance of applications in production environments.
Key Features
Here are the characteristics of Stackify:
- Aggregates all the logs in a central place for easy traceability
- Makes it easy to view and search through all the logs in a central location
- Configures and monitors automated log queries
- Identifies bottlenecks to improve your application continuously
- Tracks deployments
- Identifies slow dependencies
- Discovers your app’s performance
- Helps you to find and fix exceptions in the code
- Monitors exception rates
- Supports common reporting frameworks
- Provides code-level insights to retrace through your code
- Tracks the usage and performance of HTTP requests
- Creates custom dashboards to track the important events
- Aligns dashboards with your business goals
- Helps to create an engaging experience for your end-users
- Optimize resource performance with the resource breakdown report.
Why do we recommend it?
Stackify stands out for its proactive monitoring and comprehensive log management. It not only identifies bottlenecks but also offers code-level insights, helping you continuously improve application performance.
Who is it recommended for?
This tool is recommended for developers and operations teams who are keen on proactive performance monitoring in production environments. It is particularly useful for those looking to aggregate logs, track deployments, and monitor exception rates for in-depth analysis.
Stackify offers four pricing plans to meet your custom needs, and they are
- Logs and Errors – $35 per month
- Retrace Essentials – $79 per month
- Retrace Standard – $199 per month
- Retrace Enterprise – Custom quote.
Click here for a free 14-day trial.
10. Atatus
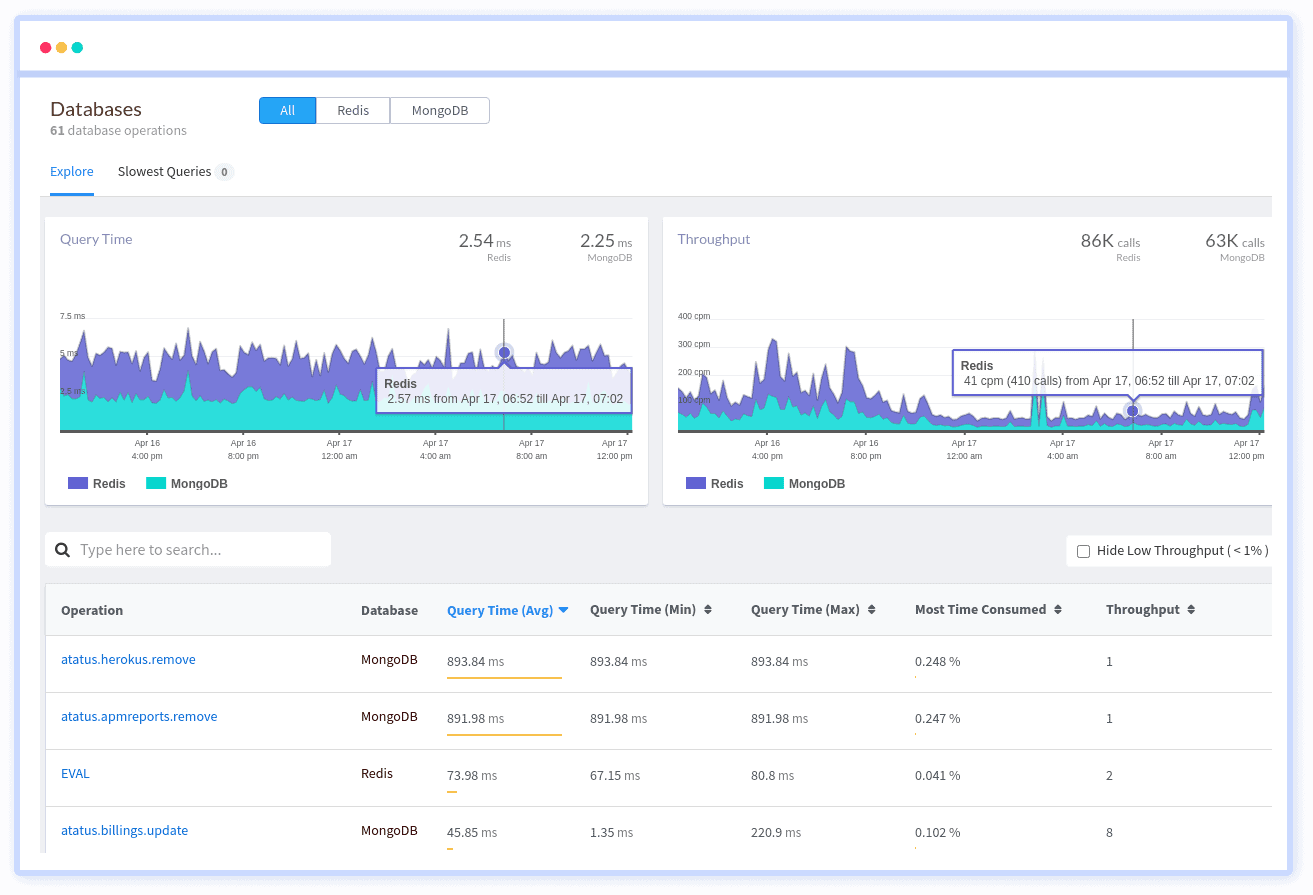
Atatus is a full-stack python monitoring tool that provides complete visibility into the performance of your Python applications. It also helps to identify and solve issues related to your applications.
Key Features
The features of this tool are:
- Captures all requests to your Python applications without requiring any changes to the source code
- Provides a clear picture of how your methods, database statements, and external requests impact your user’s experience
- Offers a complete picture of the most time-consuming database queries with a focus on the slow queries
- Instantly lists all the external requests that impact performance
- Visualizes transaction traces
- Provides a detailed overview of all HTTP failures
- Collects Python exceptions and crashes with full-stack frames
- Makes it easy to analyze the problem areas and address them quickly
- Diagnoses and fixes API failures
- Sends notifications through Slack, teams, Emails, PagerDuty, and more
Why do we recommend it?
Atatus provides comprehensive, full-stack monitoring for Python applications, capturing all requests without requiring code changes. It excels in identifying slow database queries and external requests, helping to quickly pinpoint and resolve performance issues.
Who is it recommended for?
This tool is recommended for development and operations teams seeking in-depth visibility into Python applications. It’s particularly useful for those needing to diagnose API failures, analyze slow queries, and require instant notifications for issue resolution through various channels like Slack, Email, and PagerDuty.
The pricing depends on your needs, and there are four options to choose from, namely,
- APM plans – $49 per month per host
- RUM plans – $49 per month for 250,000 views
- Infrastructure plans – $7 per month per host
- Logs plan – $10 per month for 5GB per month and a retention period of seven days.
Click here to get started.
Thus, these are some of the best Python monitoring tools available today. But, of course, the choice depends on your business needs, budgets, and the number and criticality of your Python applications.
These tools scale well to meet your requirements, and hence, choosing anyone can add value to your organization. That said, our editors suggest the ones that have the edge over the others.
