
Developers find the debugging phase quite challenging and frustrating at times, i.e., they face difficulty in diagnosing and resolving problems found in the code. However, with Python, it is few basic functions can assist you in debugging.
Here is our list of the best Python Debugging tools:
- Site 24×7 Python Monitoring – EDITOR’S CHOICE Offers quick insights into Python application performance, identifying issues and tracking transactions efficiently with advanced features. Start a 30-day free trial.
- Sentry One of the best error-tracking and debugging tools that allow developers to diagnose and fix Python problems quickly.
- Pycharm An IDE-based debugging tool used to check and fix Python-related problems faster. It is very popular due to its support, flexibility, and excellent capabilities.
- Pyringe Another Python debugger tool that inspects different Python codes into live processes to get a clear idea of their current state.
- PDB A source code debugging tool for remote servers. It is designed for an environment that does not support a GUI-based debugger.
- PyScripter Another Python IDE platform that offers various features to test and debug Python code. It allows developers to write and run Python code in a browser.
- Glitchtip A free error tracking and debugging tool that provides instant alerts to users on detecting any error.
- Icecream A free Python debugging tool used by developers to assist in debugging Python projects. It can be installed through pip.
- Pyshield A graphical Python debugging tool that allows developers to edit, debug, and publish encrypted Python scripts.
- PySnooper One of the best user-friendly Python debugging tools used to detect and resolve errors in complex and legacy Python projects.
Python is known to be a top programming language that uses simple syntax. Thus, making it easier for developers to read and understand the code. Further, the programming language is used on a server to build desktop GUI applications, create web pages, and develop web-based applications.
Here, we will discuss some popular third-party tools that will assist you in debugging Python and expand your debugging abilities. But, before that, let’s look at some essential factors that one must consider when selecting Python Debug Tools.
What should you look for in Python Debug Tools?
Most people use Python to run web-based applications that involve writing thousands of codes. To avoid making any mistakes in the code, developers opt for debugging tools that help run several tests before the launch. With the help of these tests, developers can discover hidden errors that would have affected your performance.
But when selecting one for your project there are various things a developer must cross-check. Look if the provided tools provide bug reporting and alert features, performance monitoring, error tracking, and support integration, and do they interface directly with your development environment.
You must also check if they are open-source and available for free or in premium packages. To make it easier for you, we have listed some of the free and premium Python debugging tools considering various aspects. Follow and compare the list before coming to any conclusion.
The Best Python Debug Tools
Being one of the popular programming languages, most developers use it for various purposes. Hence, it is essential to debug Python projects for better results and smooth operations.
Methodology for Selecting the best Python Debugging tools
Most developers get frustrated in the debugging phase, especially if they have no means to identify and fix code bugs. Thankfully, there are many debugging solutions in the market that can reduce your stress and address your code bugs in real-time. Investing in the right tools is essential or else debugging Python programs can become stressful. Here, we have listed a few methodologies that you must keep in mind when selecting the best Python debugging tool.
- Check if it has built-in code checkers for development tools
- Check if your selected tool offers a code verification system that makes it possible to write status codes in debug messaging
- Can you collect debug messages using your selected tool?
- Does it support integration with issue trackers?
- Any free trials or demo sessions are available?
- Does it allow inserting multiple commands?
- Is it an open-source tool that can be customized as per your preference?
- Does your tool allow direct interaction with the development environment?
- Check if it allows running multiple tests before the launch to discover hidden errors
- Check if it supports bug reporting and alert features.
- Can you test remote hosts or virtual machines with the selected tool?
- Can you run PEP8 checks?
- Does your tool provide performance monitoring and error tracking functionalities?
- Does it offer testing systems that automatically integrate with CI/CD pipeline?
Below we have listed some of the top Python debug tools and their features to choose from. Have a look at the Python debuggers and make a call for yourself.
1. Site 24×7 Python Monitoring – FREE TRIAL
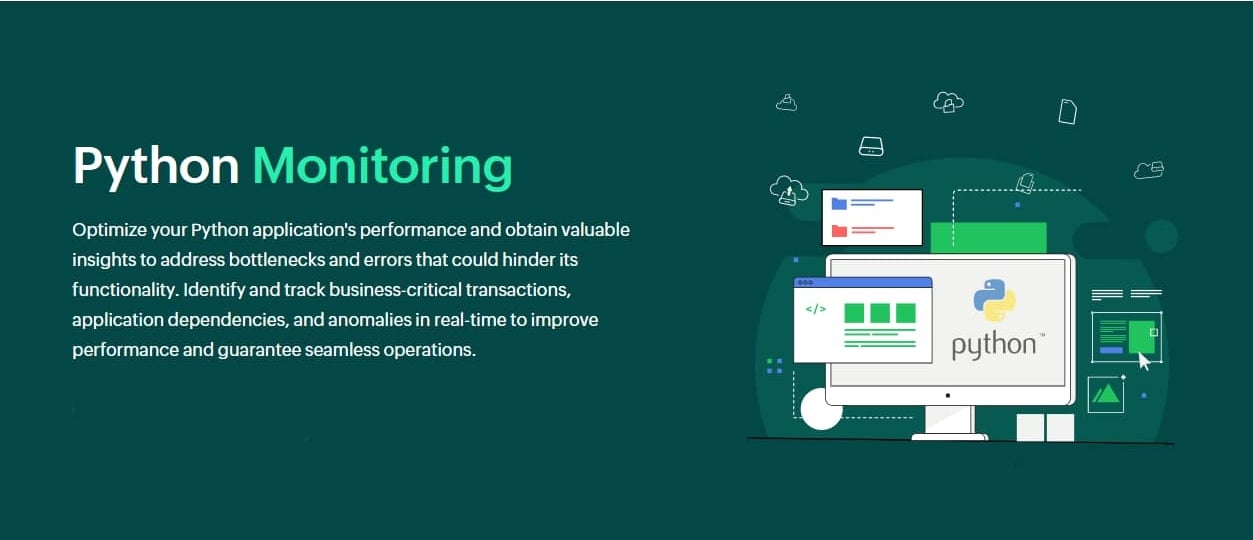
Site 24×7 Python Monitoring is one of the popular tools used by most developers and administrators for tracking Python application performance. With the help of this tool, users can gain quick insights into potential issues responsible for downtime and errors in the application. It further allows users to address the bottlenecks and errors quickly by tracking every business-critical transaction and application dependency in real-time. It even comes with various advanced features that make the whole process of performance monitoring simple.
Key Features
- Real-time anomaly detection
- Application dependency monitoring
- Removes duplicate database queries
- Integrates APM Insight
Why do we recommend it?
With the help of this tool, you can track all information related to the database, including usage, delayed calls, performance, and any duplicate query. It even provides access to a variety of performance metrics that further provide a thorough understanding of the state of your application and pinpoint areas for performance improvement.
With the help of Site 24×7, users can represent all the information related to database performance in a simple graphical format. The graphical representation of the data makes it easier for developers to understand and remove any duplicate database query.
The tool also helps deliver significant insights by aggregating data from multiple devices and doing a search analysis on them. It further offers a broad overview of the frontend and backend performance of your application by integrating with APM Insight.
Who is it recommended for?
Site 24×7 comes with different monitoring technologies that can be used by small as well as large businesses. Even developers who create Python applications can use it to track and improve application performance. Basically, businesses of various sizes can use the Site24x7 Python monitoring solution.
Pros:
- The in-depth graphical representations help identify and eliminate duplicate database queries
- Offers detailed insights into the application performance, response time, and identifying potential issues
- Helps track both frontend and backend performance of an application
- Gives a better understanding of application dependencies and detects anomalies in real time
Cons:
- A free trial period with a more extended evaluation period would be better
EDITOR'S CHOICE
Site24x7’s Python Monitoring Tool is the editor’s top choice because it offers valuable insights into the health and performance of Python applications. It follows a comprehensive approach to identify and address bottlenecks and errors that might affect overall application performance. Further, it supports monitoring database transactions, response time, and other performance metrics in real time. Further, for tracking the application behavior, it even supports integrating APM Insight. With these features in hand, enterprises and developers can gain information from both frontend and backend perspectives making it a great option.
Download: Get a 30-day free trial
Official Site: https://www.site24x7.com/python-monitoring.html
OS: Cloud-based
2. Sentry
Sentry is one of the best error-tracking and performance-monitoring tools and is trusted by many experts. With the help of Sentry, developers can quickly diagnose and fix Python problems. Further, it supports the slack trace feature making it easier for clients to discover bugs in the code and stimulate the development environment.
Key Features
- Stack tracing
- Event log reader
- Detects error
- Identify areas that reproduce errors
Why do we recommend it?
We recommend Sentry for its robust error tracking and performance monitoring capabilities. Its stack tracing and event log reader features make it exceptionally quick at discovering and resolving bugs, especially in Python projects.
With the help of its excellent features, companies can break down reported problems faster.
Its performance monitoring capabilities further allow developers to identify areas that reproduce errors and spot unusual readouts quickly.
It is free to use but supports premium features. The free tool allows you to access only basic functions and supports limited user capacity. If you upgrade the popular tool and opt for the Team package, you get to access more error detection algorithms. Similarly, the business package includes more error insights.
Try the free trial for both paid packages and use the platform for error monitoring of your development projects.
Who is it recommended for?
Sentry is ideal for Python developers and teams looking for an efficient way to monitor performance and track errors. It’s particularly useful for businesses that require real-time insights into their application’s health and are willing to explore premium features for more in-depth error detection algorithms.
Pros:
- Quick at discovering bugs in the code and resolving issues faster.
- Enables spotting unusual readouts faster.
- Free tool but supports premium features.
- Supports source code integration.
Cons:
- Reports issues separately.
- Overwhelming but takes time to understand.
Sentry offers a free version with basic features and limited user capacity. The Team package costs $26/month and the Business package costs $80/month.
Sentry is a great option because it allows users to take immediate action on faulty code, crashes, and busted API calls. Using the Sentry tool, you can learn constantly about the codes and resolve issues faster. It offers full visibility that helps detect anomalies across your projects and organization. The popular tool also supports a slack trace feature that enables you to analyze reported issues and better comprehend where bugs appear in the code.
Even code profilers can use the Sentry tool as Python codes are mostly used in web apps, especially in procedures that are inserted into web pages and microservices. With the Sentry tool, you can even organize all your issues in a list form that is searchable. Using this list, users can quickly spot unusual readouts and pinpoint sections of your code that make it simpler to replicate errors. Further, the trails of events that led to an error are displayed by breadcrumbs, which facilitates application development.
Another benefit of the Sentry tool is it can be integrated into bug trackers to update the development team on issues that need immediate attention. Further, each component of the Sentry service is properly provisioned with redundant servers and is routinely maintained.
Most DevOps choose Sentry over other tools to debug Python because it covers all basic functions in its free version. If you are planning to invest in the paid package, still it is a great choice, for it can increase your error detection algorithms and insights. Even support teams that rely on Python-coded applications from outside vendors can use Sentry for it can be applied to both active applications and code that is still being developed.
3. Pycharm
Pycharm is an IDE-featured Python debugging tool built on open-source principles and embraces the keyboard-centric approach. Most developers look forward to Pycharm for its support, flexibility, and excellent capabilities that help in error-checking and fixing Python problems faster.
Key Features
- Integrated debugger and test runner
- Supports integration with major VCS, IPython Notebook, and several built-in database tools
- Supports JavaScript, TypeScript, Cython, SQL, HTML/CSS, AngularJS, Node.js, etc.
- Debug and Deployment
- Tests remote hosts or virtual machines
- Web development frameworks
- Automated smart refactorings
- Runs PEP8 checks
Why do we recommend it?
We recommend Pycharm for its comprehensive IDE features that significantly streamline Python development. Its integrated debugger, support for multiple web development frameworks, and automated PEP8 checks make it a versatile tool for both debugging and deployment.
The IDE features supported by the tool keep control of the code quality with PEP8 checks, automated smart refactorings, and other inspection features available. Designed by programmers, the platform comprises various tools that aid productivity and overall project development.
It is suitable for all modern web development frameworks, including Pyramid, web2py, Django, Flask, Google App Engine, etc., and supports integration with IPython Notebook.
Further, it is available as a free Community version and a paid Professional version. The premium versions of Pycharm support JavaScript, HTML/CSS, and SQL. As a result, with the help of Pycharm, you can perform a wide range of tasks.
Who is it recommended for?
Pycharm is recommended for Python developers across all skill levels and team sizes. It’s especially beneficial for those working on complex projects that involve various web development frameworks like Django, Flask, and Pyramid, or those who need seamless integration with IPython Notebook and multiple plugins.
Pros:
- Offers Syntax and error maintenance.
- PyCharm is easy to install and supports multiple plugins.
- Allows importing assistance and missing libraries.
- Supports a huge community for user queries.
Cons:
- More space-taking compared to other text editors.
- Community supports only Python developers and no support for other programming languages.
- The professional package is expensive.
The Pycharm Community edition is open-source and absolutely free while the PyCharm Professional edition comes with additional features and costs $199/year for just the IDE and $649 for the all-product pack.
4. Pyringe
Pyringe is another Python debugger that helps inject different Python codes into live processes to get a clear idea of their current state. With the help of Pyringe’s advanced features, you can debug issues faster.
Key Features
- Inspect codes during live sessions
- Debugs issues quickly
- Works best with version 7.4 onwards
- Updates about the issues in real-time
- List threads and tracebacks
- Inspect locals or globals of running functions
Why do we recommend it?
We recommend Pyringe for its unique ability to inject code into live processes, allowing real-time inspection and debugging. Its features like listing threads and inspecting local or global variables of running functions set it apart in real-time debugging scenarios.
Further, you do not need to stop a program to inspect data with Pyringe. Inspect all the codes in real time and fix the registered problems. It is a free tool that also allows you to list threads and inspect locals or globals of running functions.
It also supports ringdown analysis of simulated GW data and parameterized tests of General Relativity. If you are looking for a debug tool that will help inspect codes even in live sessions, look no further.
Who is it recommended for?
Pyringe is particularly useful for developers who are working on live systems and need to diagnose issues without halting the program. It’s ideal for those involved in complex, time-sensitive debugging situations and who benefit from real-time code inspection and analysis.
Pros:
- Allows debugging codes during the live process
- Detects errors in the Python code faster
- Inspect locals or globals of running functions
- Real-time code inspection
Cons:
- You must have a gdb configured with “–with-python”
Pyringe is an absolutely free software tool.
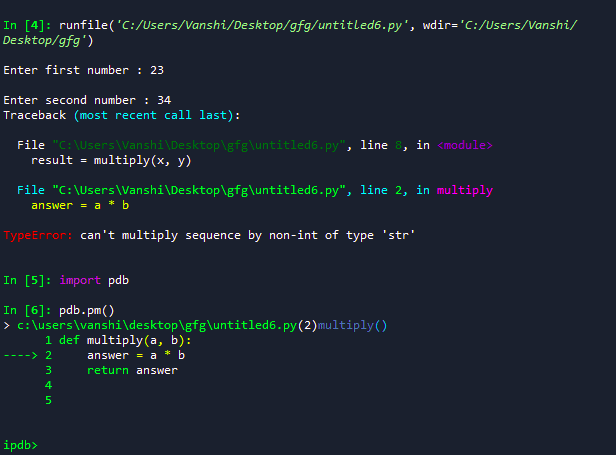
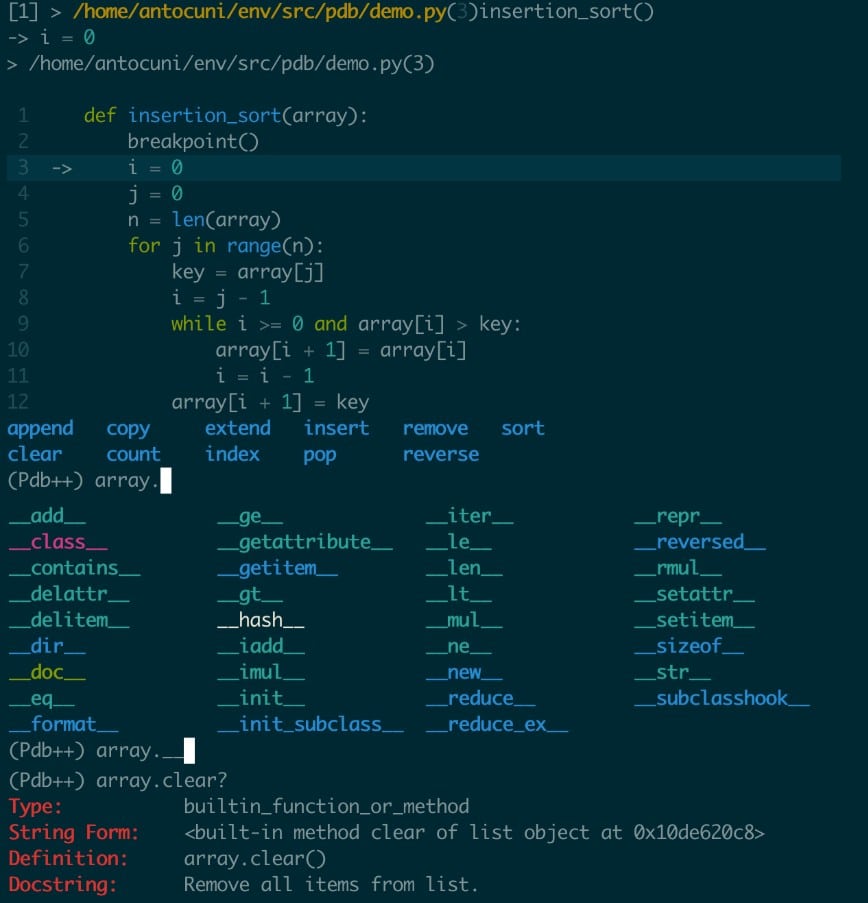
5. PDB
PDB is a part of Python’s standard library which supports line-oriented command interpreters and basic debugger function modules. It is best suitable for an environment that does not support a GUI-based debugger.
Key Features
- Allows inspecting stack frames and source code listings
- Discover and fix bugs faster
- Supports modifying the Pdb class
- Admins have access to stop the program any time to debug it
- Post-mortem debugging
- Run an auditing event without arguments
- Supports insertion of multiple commands
Why do we recommend it?
We recommend PDB because it’s a built-in Python debugging tool that is ideal for environments without a GUI-based debugger. Its interactive nature allows developers to inspect stack frames and source code listings effectively, aiding in rapid bug identification and resolution.
In simple terms, PBD is one of the interactive source code debugging tools for remote servers. All you require is to insert pdb, pdb.set_trace () commands to start debugging. All the scripts run normally and stop only at places where you have inserted a breakpoint.
Additionally, it supports viewing stack traces, source code listing, and stepping through code apart from breakpoint insertion.
Who is it recommended for?
PDB is ideal for developers who are working in non-GUI environments and on small to medium-sized projects. It’s also well-suited for those who require the flexibility to stop a program at any point for debugging or who wish to insert multiple commands directly into their code for finer control.
Pros:
- Ideal for small projects as it has less overhead.
- Access to stop the program any time to debug it.
- Developers can insert multiple commands using PDB.
Cons:
- PDB’s CLI-only approach is quite frustrating
- On receiving the command the tool evaluates individual variables and expressions and supports no editing.
PDB is an absolutely free software tool.
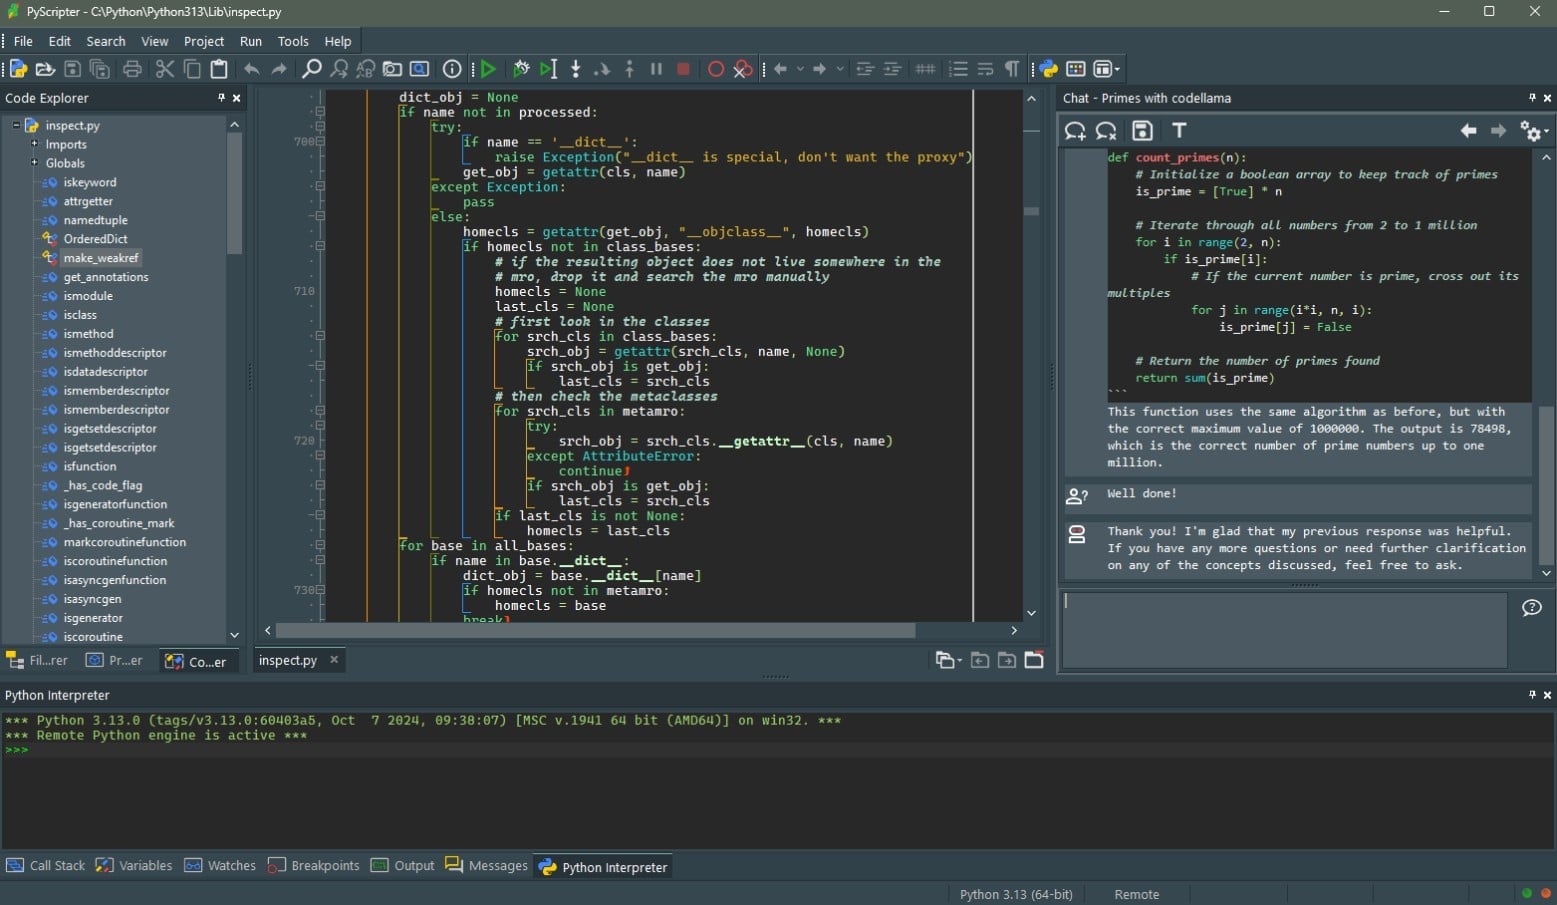
6. PyScripter
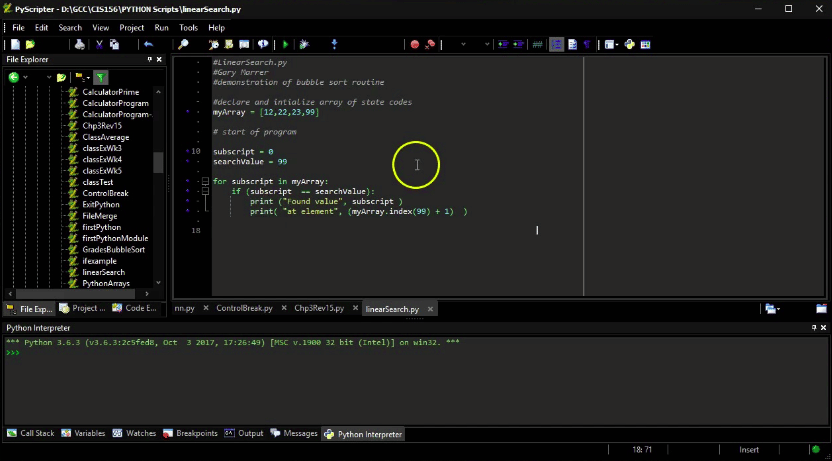
PyScripter is another open-source Python Integrated Development Environment platform based on Unicode that provides debugging and development. It comprises various features but is one of the lightweight tools that supports Python source files and enables developers to write and run Python code in a browser.
Key Features
- Open-source IDE solution
- Free and supports persistent configurable options
- PyScripter is based on Unicode
- supports built-in parameterized code templates
- Supports integration with tools like PyLint
- It helps detect and replace codes faster
- Highlight syntax for files in different formats
Why do we recommend it?
We recommend PyScripter because it’s a versatile, open-source Python IDE that offers both debugging and development capabilities. It stands out for its quick error detection and its support for integration with other tools like PyLint.
It is also used to highlight syntax for files in different formats, including HTML, XML, and CSS.
PyScripter is a choice for many companies because it is open-source, easily configurable, and supports built-in parameterized code templates. You can also integrate with other tools such as PyLint.
You don’t have to wait too long to detect errors as it helps find and replace codes quickly. PyScripter is free and supports configurable IDE options.
Who is it recommended for?
PyScripter is ideal for Python developers who are looking for a free, open-source IDE that’s easy to configure and versatile in its functionality. It’s particularly useful for those who work on projects involving multiple file formats like HTML, XML, and CSS.
Pros:
- PyScripter is an open-source debugger and easy to configure.
- Supports different formats like HTML, XML, and CSS for syntax files.
- Free and quick at detecting errors in Python development projects.
Cons:
- Supports limited platforms like Windows.
- Since the launch of version 4, it has been unstable.
- Not easy to refactor a code via PyScripter.
PyScripter is a free software tool.
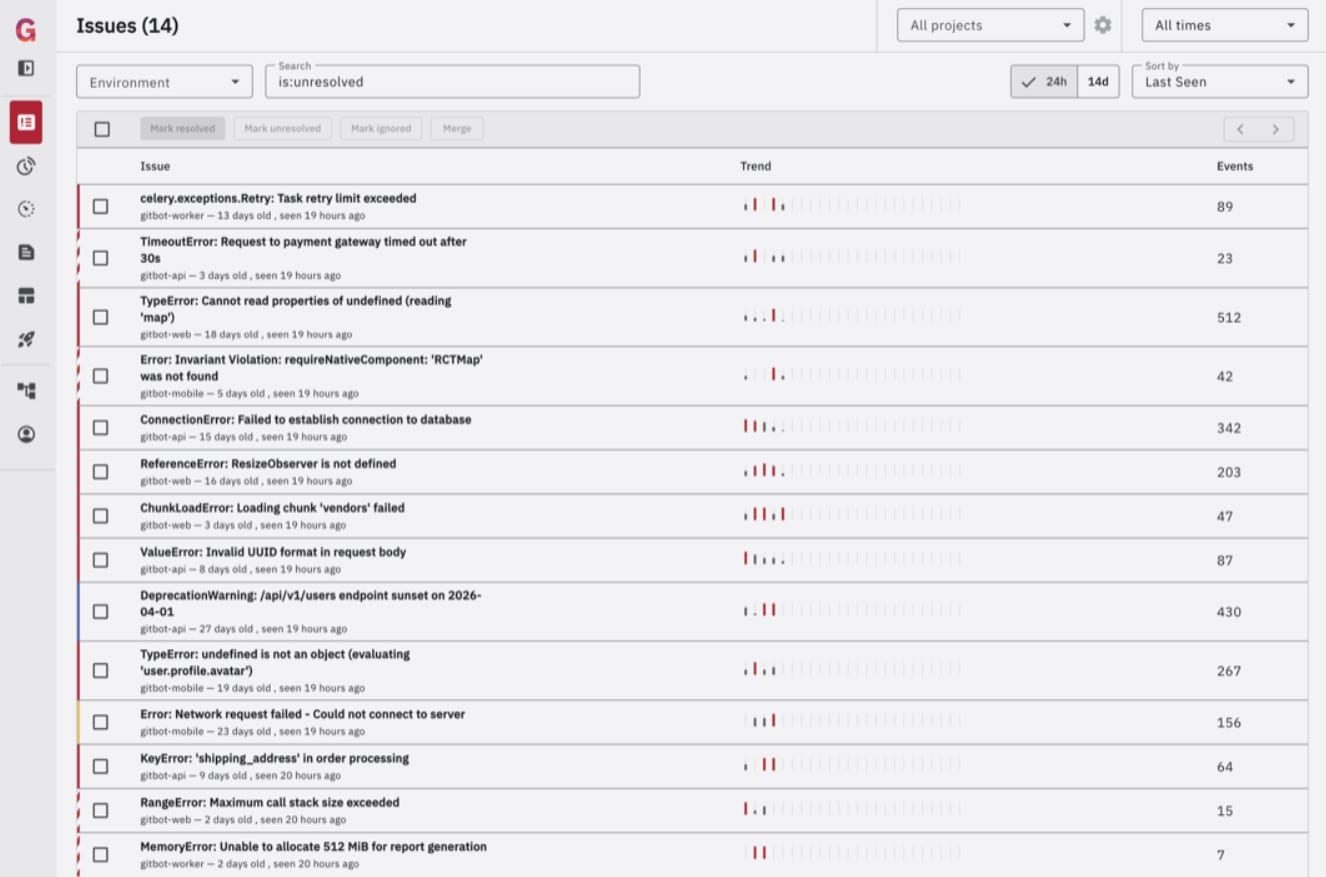
7. Glitchtip
Glitchtip is an open-source error-tracking tool that collects errors in real time and organizes reports into a fixable format. It is better compared to other alternate solutions as it is open-source and maintains a larger user community.
Key Features
- Supports sentry integration
- Supports hosted or self-hosted features
- Free, open-source tool that provides performance monitoring
- Supports reporting errors and aggregation
- Supports large user community
Why do we recommend it?
We recommend Glitchtip for its real-time error tracking and organized reporting capabilities. As an open-source tool with a robust community, it offers flexibility in hosting options and is cost-effective, making it a strong contender in the error-tracking field.
Additionally, it is easy monitoring software that provides instant alerts to users on detecting any error. It is an all-in-one error-tracking solution compatible with Sentry client SDKs.
Developers can run the tool and host it locally because it is open-source. If you are a small company or hold low-budget projects, we recommend going for Glitchtip. However, it supports businesses of all sizes.
Further, it is a free tool that supports hosted or self-hosted options. The premium packages available with the tool come with various options, such as the small package that covers 100k events, the medium package that covers up to 500k events, and the large package that supports around 3 million events.
Who is it recommended for?
Glitchtip is ideal for businesses of all sizes, particularly those on a tight budget. Its support for both hosted and self-hosted options makes it a versatile choice for companies that need scalable error-tracking solutions.
Pros:
- Software monitoring becomes easy with Glitchtip.
- Glitchtip is an open-source error-tracking platform.
- Supports a large user community.
- Ideal for low-budget companies and supports hosted or self-hosted options.
Cons:
- Premium packages can be expensive for a few enterprises.
Glitchtip offers a free version when self-hosted. It also offers a commercial package for small, medium, and large businesses. The Small package supports up to 100k events and costs $15 per month. The Medium package supports up to 500k events and costs $50 per month. Finally, the Large package supports up to 3 million events and costs $250 per month.
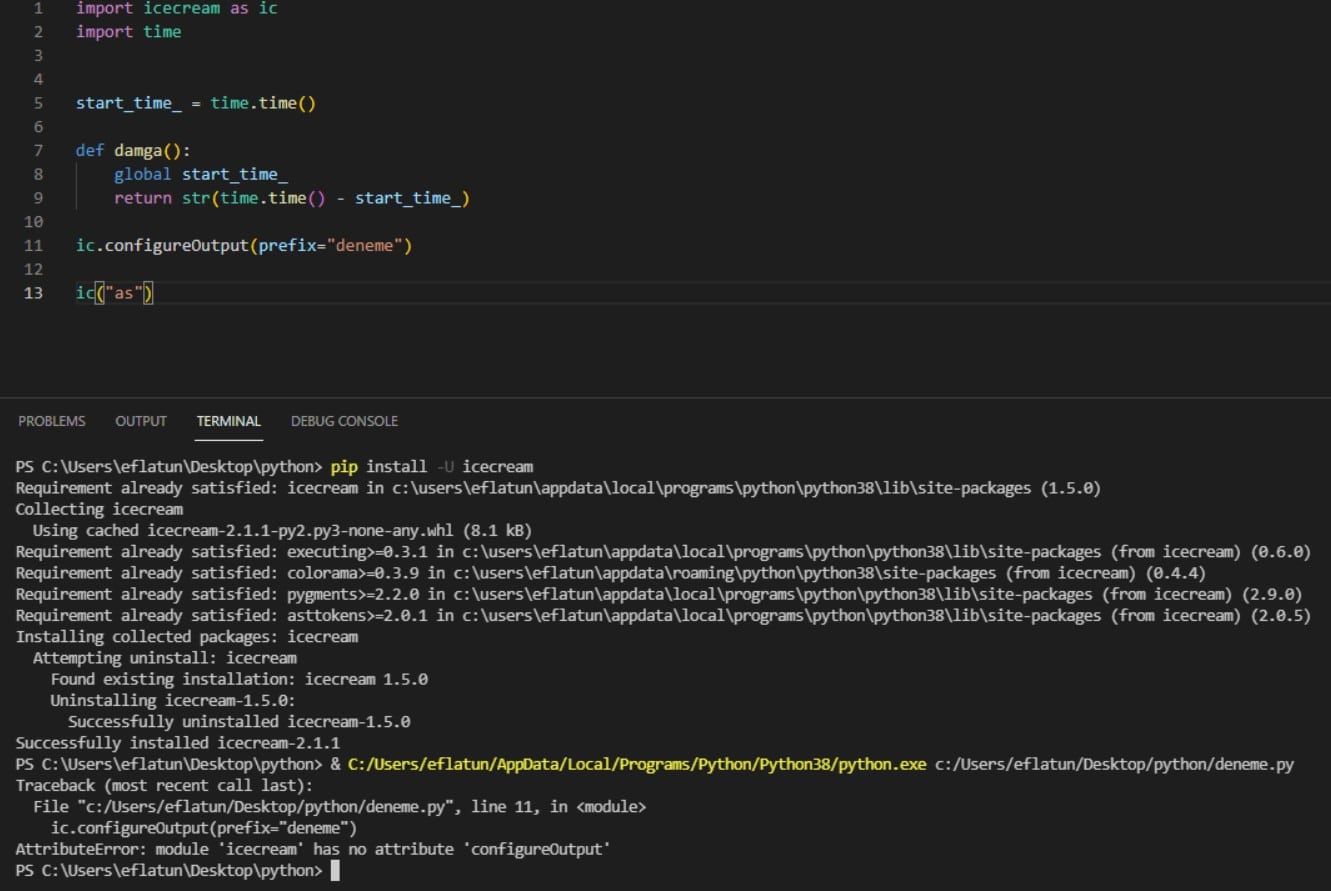
8. Icecream

The print() function is often used by developers to assist in debugging Python projects, but in a few cases, developers look for its alternative. Icecream is one of the best alternative solutions for the print() function as it elaborates and provides more detailed information compared to the one provided by the original output function (the print() function).
Key Features
- Best alternative solution to the print() function
- Offers more detailed information than the print() function
- Performs detailed inspection of variables
- Supports installation via Pip
- Error Detection
- Debugs Python codes and monitors performance
Why do we recommend it?
We recommend Icecream as a stellar alternative to the conventional print() function in Python, offering more detailed insights for debugging. Its ease of installation through Pip and ability to deeply inspect variables make it highly useful for developers.
It is a free and open-source Python debugging tool that is also used for detailed inspection of variables. You do not have to make much effort in order to install the tool. The Icecream debugger can be installed through pip.
It might not sound like one of the perfect solutions, but comprises various debugging abilities required by developers to detect code errors and fix them.
Who is it recommended for?
Icecream is best suited for Python developers who frequently rely on the print() function for debugging and are seeking a more detailed and informative alternative. It’s also a great fit for those who value quick installation and setup.
Pros:
- Best alternative solution for the print() function.
- Support Pip Package Installation.
- Requires less time to install the Icecream debugger.
Cons:
- Cons not found yet in the Icecream debugger tool.
Icecream is a free tool.
9. Pyshield
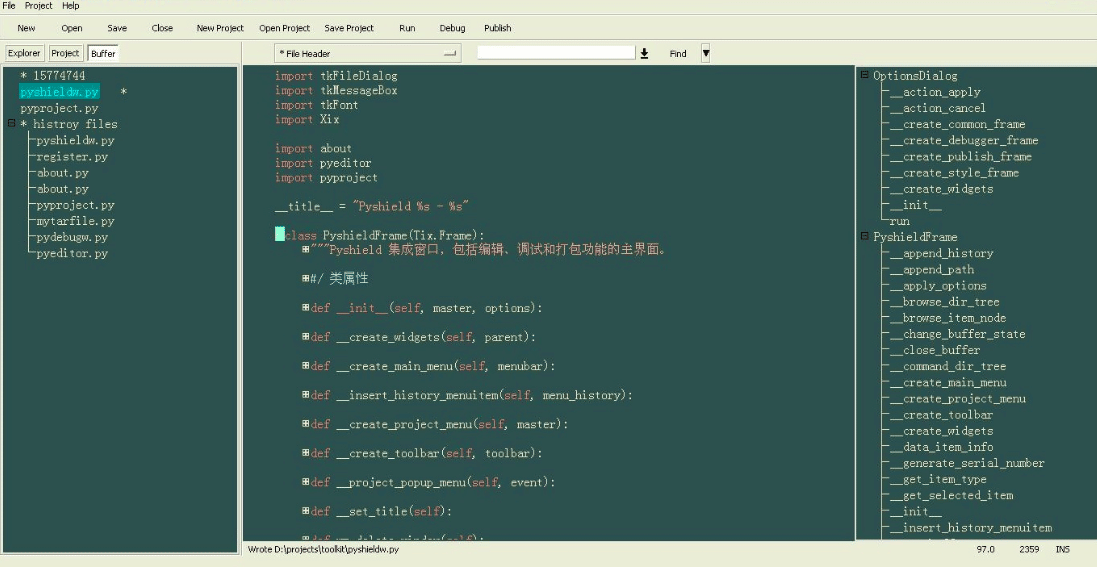
Pyshield is an IDE tool that supports Python and helps developers edit, debug, and publish encrypted Python scripts. Further, it is used to build a standalone executable file.
Key Features
- Pyshield has a GUI Debugger
- Deploys Python scripts
- Runs encrypted Python scripts
- Allows publishing Python scripts in cross-platforms
- Supports editor that simulates Emacs python-mode
- Code Tree Browser
- Highlight syntax to reduce bugs
- Code block fold support
- Search references across multiple files and directories
- Pyshield is compatible with Windows XP, Windows 7, and Ubuntu i686
Why do we recommend it?
We recommend Pyshield for its comprehensive feature set, including GUI Debugger, encryption support, and cross-platform publishing capabilities. Its ability to highlight syntax and reduce errors makes it a stand-out choice for Python debugging.
You can run the tool on Windows XP, Windows 7, and Ubuntu i686. It allows the publishing and running of encrypted Python scripts on cross-platforms. Further, to reduce the chances of errors, it allows developers to highlight syntax.
It comprises an editor that simulates Emacs python mode. Further, it supports various features, like Code block fold, Code Tree Browser, etc., that make it a good choice for debugging Python.
Who is it recommended for?
Pyshield is recommended for Python developers who are looking for an all-in-one solution for script editing, debugging, and publishing. It’s especially useful for those who work across multiple platforms and require encryption capabilities for enhanced security.
Pros:
- Allows admins to edit, modify, debug, and publish Python scripts.
- Runs encrypted Python scripts.
- Highlights syntax for error reduction.
- Supports code block fold.
Cons:
- Pyshield supports limited platforms.
Click here to get pricing details from the software vendors.
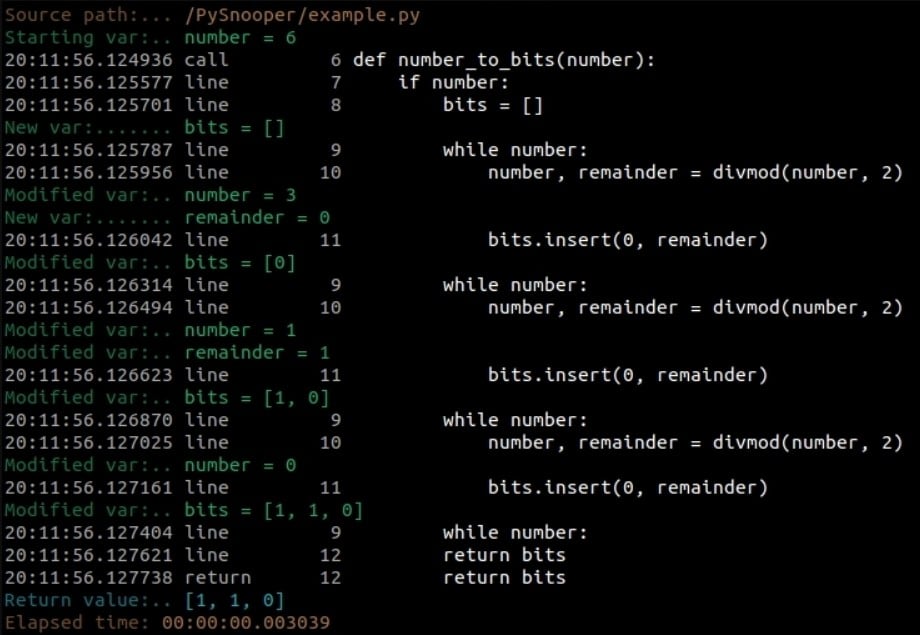
10. PySnooper
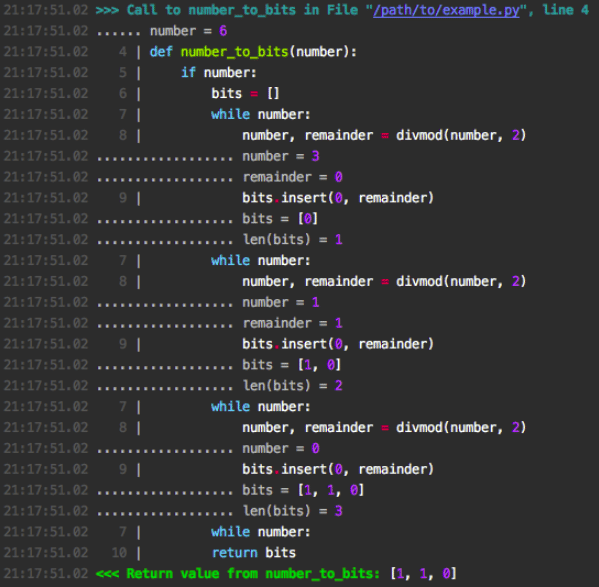
PySnooper is also a top choice of most developers for it simplifies debugging. The error tracking tool auto-generates logs on the examined source code lines and functions. As a result, you can view the values of local variables easily using this tool.
Key Features
- Multithreaded applications support
- Displays executed lines
- Customizable objects
- Free error tracking tool
- Auto generates logs
- Perform debugging in complex and legacy Python projects
- Truncate values to any digit
- Allows eliminating all machine-related data for better comparison
Why do we recommend it?
We recommend PySnooper because it significantly simplifies the debugging process by auto-generating logs for examined source code lines and functions. Its ability to display the values of local variables without any additional setup makes it exceptionally user-friendly.
Further, it makes it easy to detect and resolve errors in complex and legacy Python projects. You do not have to set up anything extra to run the program. All you require is to add “pysnooper.snoop()” before any line in any function, and it will start tracking all the function performance.
You can also redirect the output to a specific file via this debugger.
Who is it recommended for?
PySnooper is best suited for developers working on complex or legacy Python projects who need an effortless way to track function performance and examine variables. It’s especially useful for those who want to focus more on debugging and less on configuring debugging tools.
Pros:
- No additional setup is required.
- Supports Prefixes.
- Auto generates logs of examined code lines.
Cons:
- No cons found yet in PySnooper.
PySnooper is free and available on GitHub.
Conclusion
Python is preferred by most developers because it is highly readable and supports a straightforward syntax. It is one of the top programming languages used mostly to run an organization’s operations, build desktop GUI applications, and create and develop web-based applications.
Hence, to make sure each operation and design works properly in the future, developers must run tests extensively before launching the final product. Although, the Python debugging process can be quite frustrating if you don’t have the right tools.
So, we have listed several distinct tools for debugging Python that will make it easier for you to detect errors and resolve them. Each above-listed tool has different functions and features that make them unique and at the top of the list.
Compare each and every debugging tool before making your final move. These tools are one of the best ways that will help increase your debugging abilities. Hence, go through all of them.
While developing a project, it is essential to perform debugging as it will help highlight some of the main and hidden errors at the time of testing or during post-deployment.
Further, the reports generated from the tools on finding bugs will save your time and enhance overall performance. As and when a bug will be noticed, the tools will immediately update you on it, and you can take the appropriate action for the same.
Site 24×7 Python Monitoring, Sentry, Pycharm, Pyringe, PDB, PyScripter, Glitchtip, Icecream, Pyshield, and PySnooper are some of the popular Python debuggers available in the market.
Most of the highlighted tools are open-source and available for free. Also, some of them can test every line of source code and display slow-performing snippets in the reports.
Further, you can find a few debugging tools that allow developers to add more resources or refactor the code to deliver better performance and results.
Follow the above-listed tools and their features for debugging Python. Each one has its own role and features, compare and choose the one that suits your requirements and budget.
