
Irrespective of the Application server, whenever something goes wrong with the Java applications, most developers and system admins start searching for JMX monitoring tools. Earlier there were not many JMX monitoring tools in the market. But, today, you can find a large number of JMX monitoring tools that will help check the internals.
Here is our list of the best JMX monitoring tools:
- Site24x7 – EDITOR’S CHOICE A cloud-hosted, all-in-one monitoring platform that includes JMX monitoring. It provides real-time visibility into Java application performance, with insights into JVM metrics and proactive alerting to support efficient resource management across environments. Get a 30-day free trial.
- ManageEngine Applications Manager – FREE TRIAL A comprehensive application performance monitoring (APM) tool that includes JMX monitoring alongside features such as application discovery and dependency mapping, code profiling, and distributed tracing. It is available for Windows, Linux, AWS, and Azure. Start a 30-day free trial.
- Jolokia A lightweight, open-source JMX monitoring tool that exposes a RESTful interface. It is compatible with Linux, Windows, and macOS systems, making it a flexible option for accessing JMX data.
- Zabbix A free system monitoring solution that includes JMX monitoring capabilities. It runs on Linux and is also offered as a paid, hosted SaaS version for cloud-based deployments.
- Hawt.io An open-source, web-based JMX console designed for monitoring JVMs. It supports web applications, mobile apps, and microservices, and can be deployed on Kubernetes or OpenShift environments.
- Nagios A widely used system monitoring platform available in both free and paid editions. It runs on Linux or within containerized environments and can be extended for JMX monitoring.
- AppDynamics An application and infrastructure monitoring platform offering JMX monitoring for Java applications. It provides real-time performance metrics and is available as a cloud-based SaaS or as a self-hosted VM deployment.
- eG Enterprise An application monitoring solution with advanced JMX capabilities for Java environments. It is available as either a SaaS platform or as software for Linux and Windows systems.
- Dynatrace A monitoring platform that includes JMX monitoring with AI-driven insights for Java environments. It forms part of a broader system monitoring suite and runs on Linux and Windows, with a cloud-based SaaS option.
JMX monitoring tools are easy to integrate into your infrastructure which further helps in automating the monitoring requirements of JVM or application server.
Here, we have shared information on JMX monitoring tools, their benefits, and their key features that will help monitor and manage application performance.
Introduction to JMX Monitoring?
Java Management Extensions (JMX) include various tools that help in managing and monitoring application servers, service-oriented networks, system objects, and devices like printers. These tools use a JVM port (JMX console) to expose data represented by objects called MBeans (Managed Beans). You can find multiple domains in JVM grouped to inform where the resource belongs to.
System Admins and Developers can find it challenging to extract JMX metrics. As a result, JMX monitoring tools were introduced, a standard way to manage and monitor JVM resources.
It makes use of a three-level architecture to extract queries:
- The Probe Level This level is also known as the Instrumentation level, comprising probes (called MBeans) that list all the different attributes of resources under monitoring.
- The Agent Level This level is known as MBeanServer, responsible for exposing all the MBeans to applications.
- The Remote Management Level Under this level, the remote applications access the MBeanServer using connectors and adaptors. The connector uses various communication (RMI, IIOP, JMS, WS-*) to provide full remote access to the MBeanServer, whereas adaptors adapt to other protocols like SNMP or web-based GUI to provide access to the MBeanServer.
Why We Need JMX Monitoring
If your business runs Java applications, make sure to upgrade them and monitor them at all times for smooth running. If you fail to deliver optimal results, the user will feel unsatisfied, which can affect your business goodwill. Thus, do not limit your task to only installation. Instead, one must look beyond the code and ensure the Java Virtual Machine (JVM) is working actively.
Manual monitoring of each Java app can be a daunting task for system admins. With the help of Java Monitoring Tools, the developers and admins can monitor performance and track issues responsible for affecting users’ experience.
JMX is vital for applications in the same manner SNMP is for network devices. Hence, JMX plays a key role in Java applications and helps automate the monitoring and collects performance statistics about application servers for fixing and improvement.
JMX is also widely used by management tools in multiple ways:
- JMX helps monitor agent and agentless servers and exposes performance metrics of applications servers, including JBoss, WebLogic, Tomcat, etc.
- You can also monitor all the JVMs running on a server and threads when trash collection happens or check on how much memory is released.
- Access to monitor custom MBeans exposed by applications running on servers.
Methodology for Selecting the Best JMX Monitoring Tools
There are various factors that one must keep in mind when selecting the best JMX monitoring tool. Go through our shared methodology to select the best tool for your needs:
- Check if it can easily detect Java-based modules
- Does it support application dependency mapping?
- In order to track remote services, does it offer distributed tracing?
- Does it offer intuitive user interfaces and easy customization options?
- Check if it compatible with your application server and operating systems
- Is Code profiling available?
- Can you perform a risk-free assessment or free trial for the selected tool?
- Can it track remotely-hosted systems and in-house services?
The Best JMX Monitoring Tools
Java Virtual Machine (JVM) includes a variety of tasks that need monitoring. Here we have penned down some of the comprehensive monitoring systems that will help deliver optimal results, including:
1. Site24x7 – FREE TRIAL
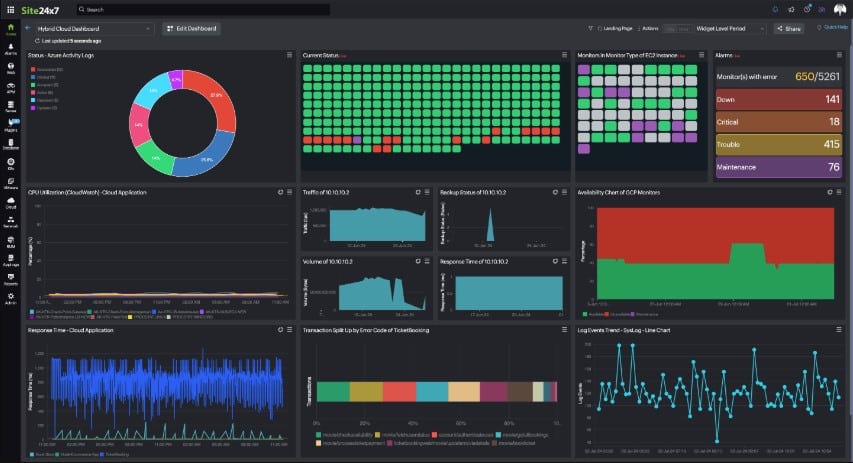
Site24x7 is a capable JMX monitoring solution that gives administrators real-time visibility into Java application behavior. It follows important indicators such as memory consumption, processor demand, and garbage collection activity, helping teams maintain stable performance across JMX-enabled environments. The service sits within the wider full-stack observability platform from Site24x7 and is delivered as a hosted system rather than a self-managed package.
Key Features:
- Live monitoring for JMX metrics
- Custom JMX query support
- Built-in JMX metrics for widely used application servers
- Proactive alerts tied to JMX thresholds
- Custom dashboards for JMX data visualization
- Integration with Site24x7 APM Insight
- Historical analysis for trend review
- Anomaly detection for unusual behavior
- Support for multiple Java application servers
- Straightforward setup and management
- Detailed JMX performance reporting
- Multi-platform compatibility
- API access for automation and integrations
- SSL support for secure communication
- Scalability for larger environments
Why do we recommend it?
Site24x7 is worth recommending for JMX monitoring because it combines live metrics, customizable queries, proactive alerting, and integration with APM Insight in one service. Site24x7 also adds accessible dashboards and historical reporting, which makes it a strong option for teams that need both immediate visibility and longer-term performance analysis. Beyond JMX, the wider platform also monitors applications, endpoints, networks, and cloud services, so the Java monitoring function is not isolated from the rest of the stack.
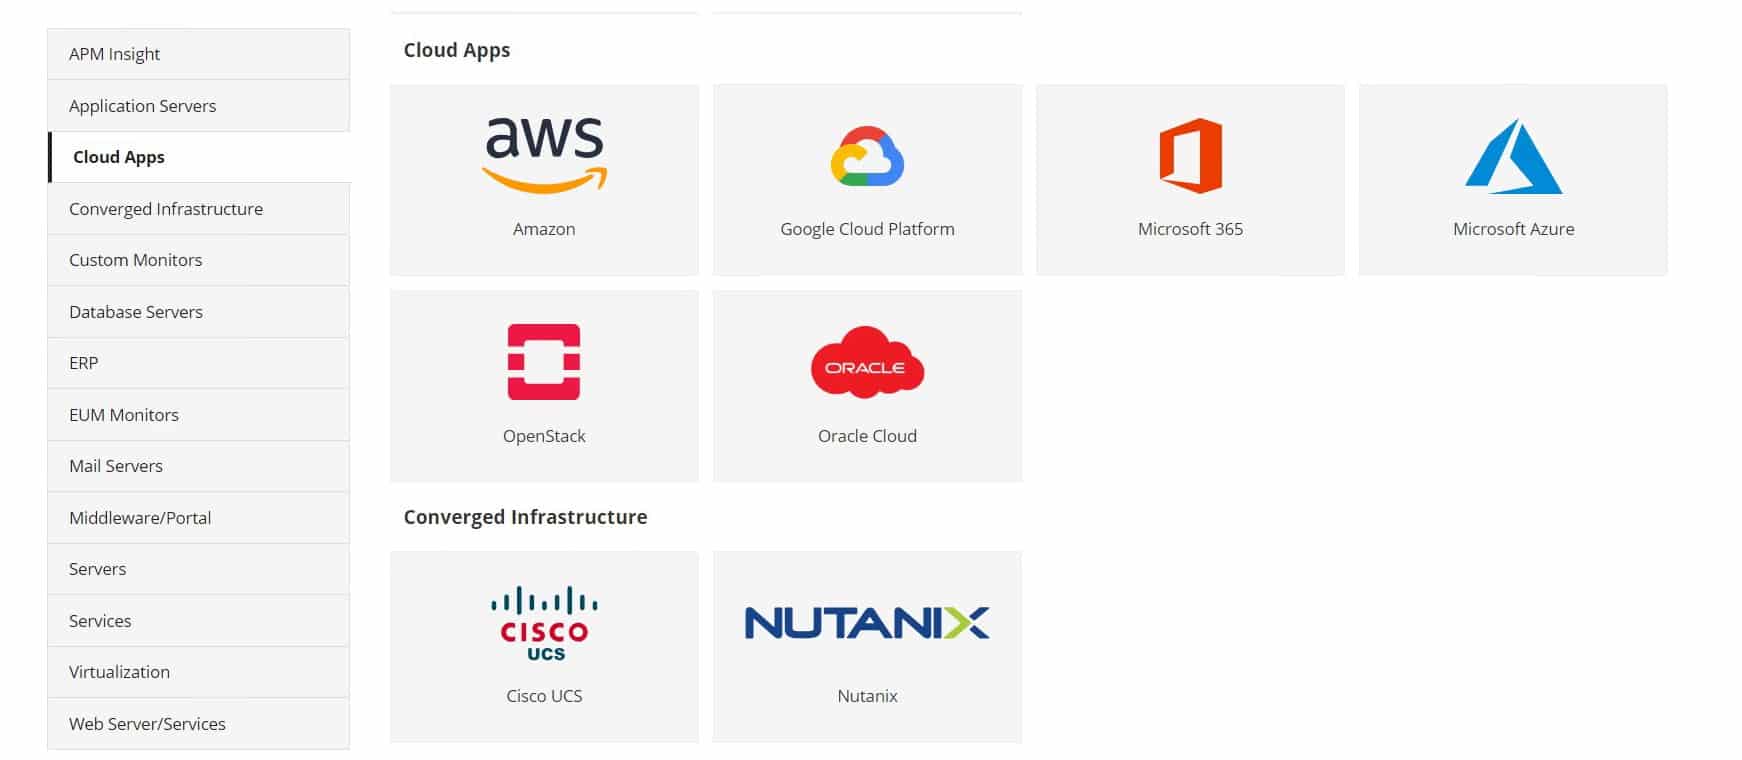
The platform also brings in web application discovery, code profiling, and distributed tracing. Those capabilities help administrators and developers see how applications are structured, where bottlenecks are forming, and how transactions move across services. Automatic discovery reduces setup effort, code profiling highlights inefficient thread and memory behavior, and distributed tracing makes it easier to investigate faults in more complex architectures. Together, these functions give Site24x7 broader diagnostic depth than a narrow JMX-only tool.
Because the service is hosted, there is no full local deployment to manage. A data collector is installed on one of your servers, while the rest of the platform runs through a hosted dashboard that can be reached from any standard web browser. The package also includes hardware and application discovery, which helps populate the monitoring views automatically and reduces manual setup.
Who is it recommended for?
Site24x7 is a good fit for organizations that run Java applications and need JMX monitoring to follow JVM metrics such as heap memory consumption and CPU utilization. It suits developers, IT operations teams, site reliability engineers, and enterprises with more complex Java estates. Its cloud delivery model gives teams a scalable and cost-conscious way to gain real-time visibility, receive proactive alerts, and monitor hybrid environments while protecting application performance and uptime.
Pros:
- Tracks key Java application metrics in real time
- Automatically discovers JMX-enabled components
- Provides customizable dashboards
- Includes proactive alerting
Cons:
- No on-premises hosting option
Register for a 30-day free trial.
EDITOR'S CHOICE
Site24x7 is our first choice for a JMX monitoring tool, as it provides a practical way to gain real-time insight into Java application performance. It connects directly with Java Virtual Machines (JVMs) to gather key metrics such as memory usage, thread counts, garbage collection statistics, and JVM heap data, helping to monitor application behaviour and system health. Its automatic discovery feature helps identify Java applications and JVMs within the environment, reducing the need for manual configuration. The web-based interface also simplifies setup and ongoing management, making JMX monitoring more accessible, even for users with limited Java performance expertise. Alerting can be tailored to specific thresholds, allowing potential issues to be flagged early and supporting more proactive maintenance. The platform also supports hybrid environments, enabling monitoring across both on-premise and cloud-based systems. This flexibility makes it suitable for a wide range of deployment scenarios, from smaller environments through to larger enterprise infrastructures
Download: Get a 30-day FREE Trial
Official Site: https://www.site24x7.com/signup.html?pack=44&l=en&lp=1
OS: Cloud-based
2. ManageEngine Applications Manager – FREE TRIAL
You can also invest in ManageEngine Applications Manager for monitoring Java/J2EE Applications. ManageEngine Applications Manager helps expose management metrics via JMX. It supports various tools like the Java thread dump analyzer that help in performing thread dumps and analysis.
Key Features:
- Get unmatched visibility into business applications
- Visualize J2EE web transactions and performance metrics
- Discover and resolve issues responsible for performance degradation
- Use Apdex scores to measure user satisfaction
- Track metrics of Java/J2EE components, EJB, and SQL statements
- Gauge database performance
- Report slow database calls and usage with graphical and tabular representations
- Identify slow traces
- Discover SQL queries executed at the time of transaction
- Identify bad-performing database queries
- Supports distributed tracing for applications in a microservice environment
- Monitor frequency of hits to DB calls and service calls
- Allows configuration of custom app parameters
- Thread Profiling helps pinpoint the root cause of CPU spikes and other problems
- Automated Service Map
- Analyze the failed requests
- Selenium-based scripting of tests
- Real User Monitoring
- Synthetic Transaction Monitoring
- Insights into web transactions, Javascript errors, etc.
- Offers Multi-cloud monitoring and database monitoring
- Allows taking screenshots if there are errors
Why do we recommend it?
ManageEngine Applications Manager is highly recommended for monitoring Java/J2EE Applications due to its comprehensive feature set and capabilities. It provides unmatched visibility into business applications, allowing administrators to visualize J2EE web transactions and performance metrics effectively. ManageEngine Applications Manager tracks a wide range of metrics related to Java/J2EE components, EJB, SQL statements, and database performance.
Though monitoring JMX and custom MBeans is a challenging task, with ManageEngine Applications Manager, you can query and report MBeans, get better real-time visibility into custom metrics, execute JMX MBean Operations, create notification listeners, and more.
One can also automate regular maintenance tasks with the help of the ManageEngine Applications Manager. ManageEngine Applications Manager is a great solution if you are planning to invest in the JMX monitoring tool as it also notifies or alerts when the application becomes critical.
Who is it recommended for?
ManageEngine Applications Manager is recommended for organizations and IT professionals seeking a robust solution for monitoring Java/J2EE Applications. It is particularly suitable for those who require in-depth visibility into the performance of their business applications. This tool caters to a wide range of users, from application administrators to IT managers and developers. It is ideal for organizations that prioritize user satisfaction and need to track various application metrics, database performance, and transaction details.
Pros:
- Helps watch over Java/J2EE Applications
- Uses JMX to reveal management metrics
- Uses Java thread dump analyzer to perform analysis
- Automates regular maintenance tasks
- Sends alerts if the application becomes critical
Cons:
- Exploring all features can be time-consuming
Start by downloading the 30-day free trial.
3. Jolokia
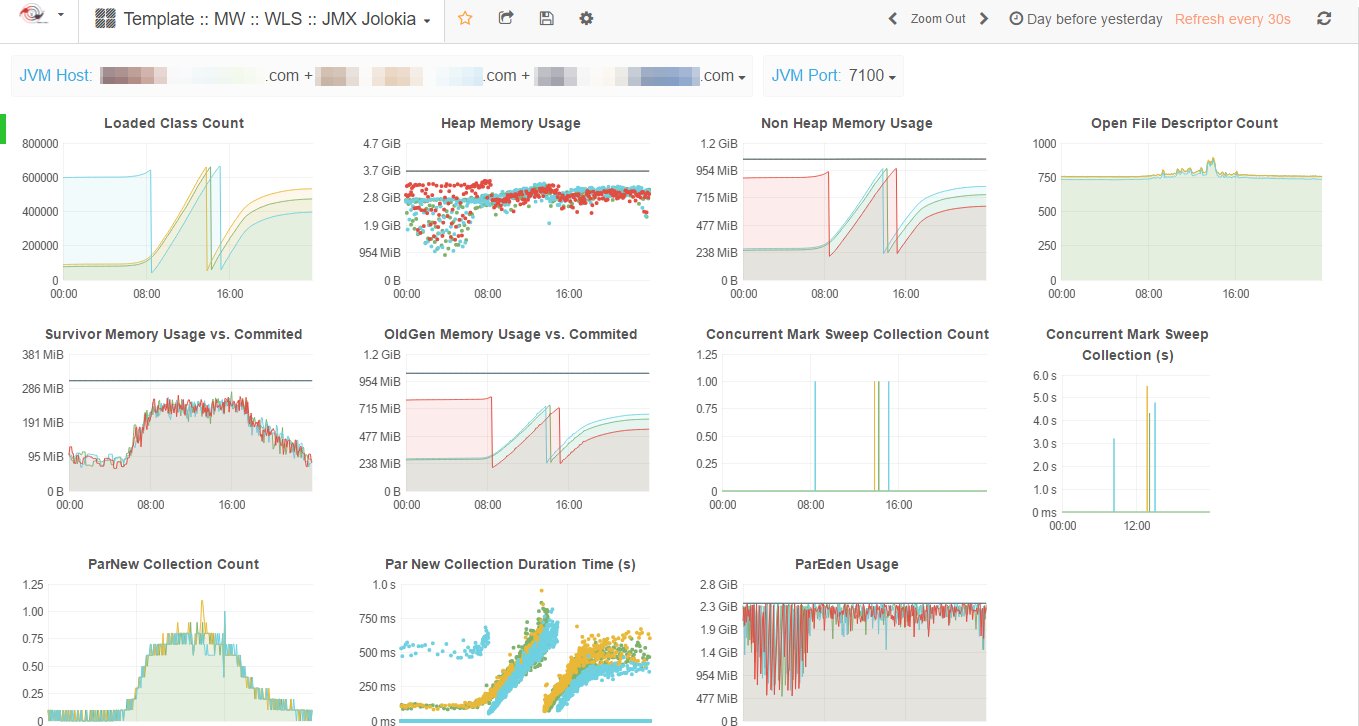
Jolokia is an agent-based approach that can be easily installed by adding agent JAR into the classpath or dropping the WAR file and auto-deploy. The JMX monitoring tool helps monitor the application status using the API endpoints. It is a JMX-HTTP bridge that is a great alternative to JSR-160 connectors and supports multiple platforms.
Key Features:
- Supports API endpoints
- Compatible with multiple platforms
- Supports bulk requests
- Fine-grained security policies
- Supports Bean invocation over REST API
- Alternative to standard JSR 160 connectors
- Communicates over HTTP (GET or POST)
- Supports reading and writing JMX attributes
- Allows discovering MBean Names by pattern
- Comprises Java, Perl, and Javascript client libraries
- History mode helps calculate the change of JMX attributes
- Uses the fast JSON serialization library for response creation
- Helps bridge the Java-centric technology of JMX to other non-Java platforms
- Jolokia is easy to install and set up compared to the standard JSR-160 RMI connector
- A great solution for firewall setups
Why do we recommend it?
Jolokia is highly recommended as a JMX monitoring tool for several compelling reasons. It offers an agent-based approach for easy installation, making it accessible by adding the agent JAR into the classpath or deploying the WAR file. One of its standout features is its ability to bridge the Java-centric technology of JMX to other non-Java platforms, offering a versatile alternative to standard JSR-160 connectors.
Admins can easily process data to get what they need using the popular tool. Also, another advantage of using Jolokia is it supports Bean invocation over REST APIs. Further, it enhances JMX remoting using some of its advanced features, including bulk requests and security policies.
The tool has been in the market for a long period and comprises some amazing features. At present, it also includes an actual JSR-160 connector that helps admins to connect to jconsole and other JSR-160 tooling to connect directly with Jolokia.
Furthermore, it is a simple, easy-to-install, super-fast monitoring tool that can seamlessly operate over multiple HTTP-Proxy hops.
Who is it recommended for?
Jolokia is an ideal solution for administrators and IT professionals seeking efficient JMX monitoring and management. It is especially recommended for those who need to connect JMX with non-Java platforms, as Jolokia serves as a bridge between them. Its lightweight installation process and fine-grained security policies make it suitable for a wide range of use cases, including firewall setups.
Pros:
- Uses API endpoints to track the application status
- Enables you to connect JMX with other non-java platforms
- Lightweight installation and fine-grained security policies
- Supports bulk requests and Bean invocation over REST APIs
- Super-fast and can operate over different HTTP-Proxy hops
Cons:
- Does not support Graphical User Interface
- Jolokia runs only on Linux
4. Zabbix
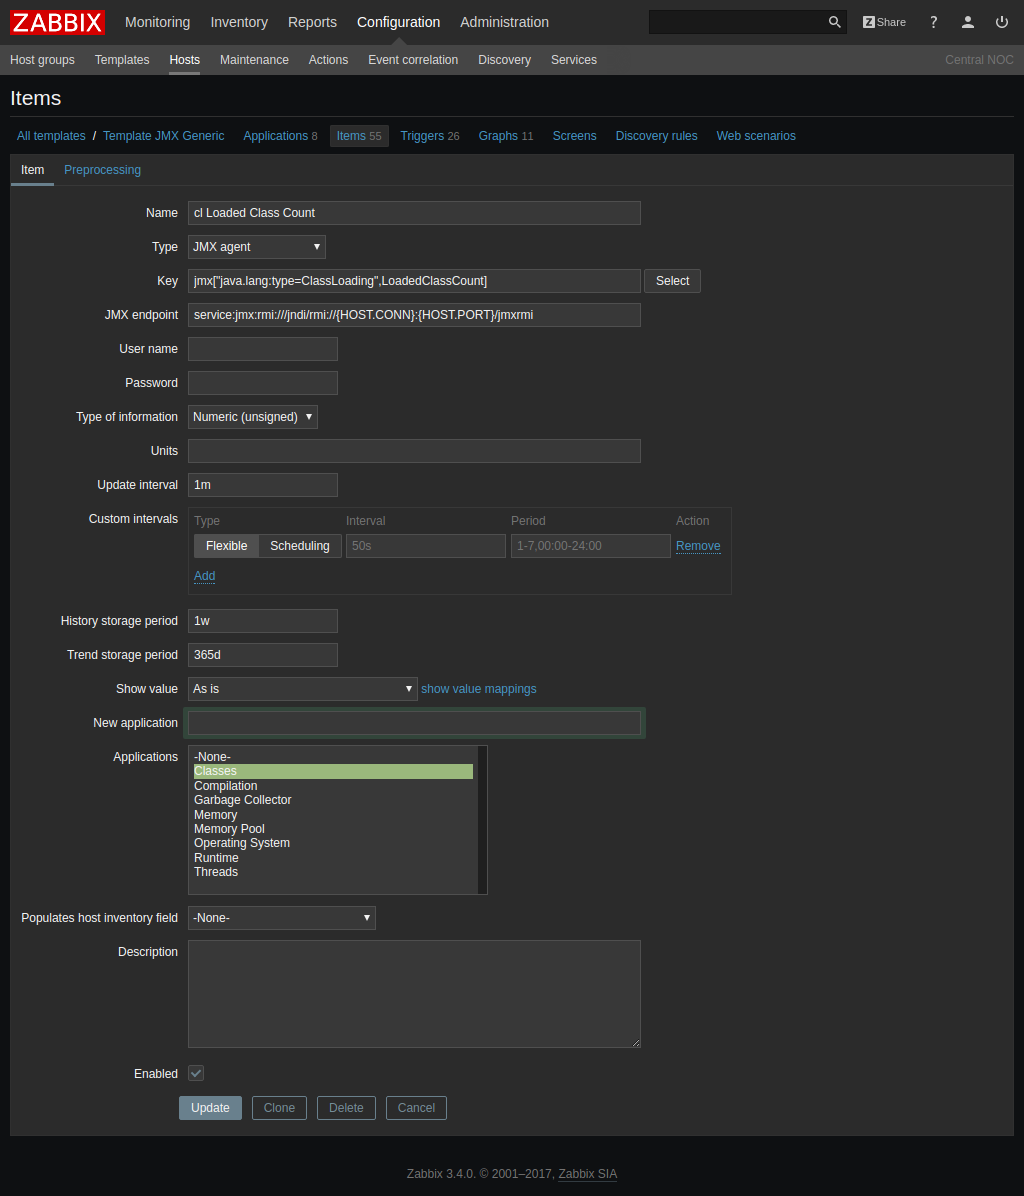
Zabbix is open-source software designed for real-time monitoring of metrics collected from multiple servers, VMs, and network devices. Admins can easily redeem data through JMX using Zabbix. The tool also initiates its own Zabbix JavaPollers process while accessing Java application performance. It helps in connecting with JavaGateway and collecting metrics.
Key Features:
- CPU Monitoring
- Bandwidth Monitoring
- IP Address Monitoring
- Effortless deployments and scalability
- Network Analysis
- Data Visualization
- Metric collection
- Distributed Monitoring
- Zabbix API
- Supports the auto-discovery feature
- Zabbix helps identify and resolve bottlenecks.
- Supports encryption communication for data protection
- The open-source tool offers real-time monitoring of the network servers and applications
- Supports custom check
- Access to create the custom graphs
- Offers easy Configuration and Templates
- Stores sensitive information in the database connected with the tool
- Timely alerts and notifies the user of the issue
- The web interface is easy to use and can be accessed from any location
- Zabbix has an easy-to-use GUI
Why do we recommend it?
Zabbix is highly recommended as an open-source monitoring tool for several compelling reasons. One of its standout features is its seamless integration with JMX, allowing easy retrieval of data. Zabbix also initiates its own Zabbix JavaPollers process, enhancing its capability to access Java application performance metrics.
The main purpose of configuring the monitoring tool is to allow the Zabbix server to connect with Zabbix JavaGateway and commence JVM remote monitoring capabilities. The tool also provides data on CPU load and disk space consumption, network utilization, etc.
Zabbix is one of the popular monitoring tools compatible with Linux, Hewlett Packard Unix (HP-UX), Mac OS X, and other operating systems. However, for monitoring Windows, the tool performs the process through agents.
Admins can also view the IT environment using the Zabbix customizable dashboard.
Who is it recommended for?
Zabbix is an ideal solution for administrators and IT professionals seeking robust real-time monitoring capabilities. It is particularly recommended for those dealing with complex IT infrastructures involving multiple servers, VMs, and network devices. Zabbix’s ability to seamlessly redeem data through JMX makes it a valuable tool for those focused on Java application performance monitoring.
Pros:
- Monitors metrics collected from multiple devices and servers in real-time
- Easy to redeem information via JMX
- Provides detailed insights on CPU load, network usage, and disk space consumption
- Works well with most operating systems like macOS X, Hewlett Packard Unix, and Linux
- The customizable dashboard helps the user easily view the IT environment
Cons:
- Creating alerts/triggers is a bit challenging
- The UI/UX needs to be more comprehensive and appealing.
5. Hawt.io
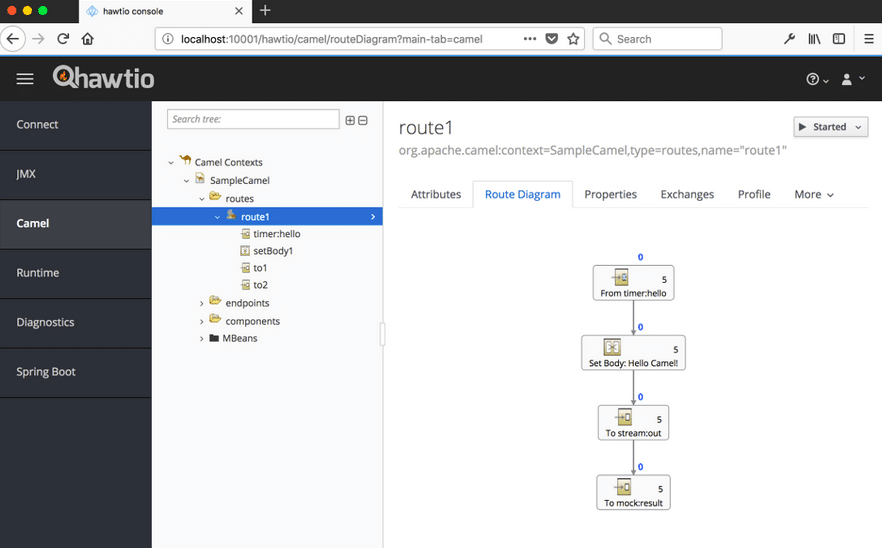
Hawt.io is one of the lightweight and modular web consoles that help in the management of Java applications. It also supports multiple plugins like OSGi, Logs, Spring Boot, JMX, etc. Built on top of Jolokia, its components create a secure communication between the frontend and Jolokia endpoints.
Key Features:
- Supports Jolokia API endpoints
- Various in-built plugins such as Logs, Apache ActiveMQ, Apache Camel, etc.
- Highly extensible modular architecture
- Compatible with Kubernetes and OpenShift
- Supports stylish UI – Bootstrap and PatternFly
- Scalable web console
- Flawless working with Tomcat, WebLogic, Liberty, and other applications
Why do we recommend it?
Hawt.io is highly recommended for managing Java applications due to its lightweight and modular design. It offers an array of features that make it a valuable tool for administrators and developers. Built on top of Jolokia, Hawt.io leverages Jolokia API endpoints to establish secure communication between the frontend and Jolokia endpoints, ensuring the safe management of Java applications.
It is a highly scalable monitoring tool and provides accurate results. Also, Hawt.io supports all applications, including WebLogic, Liberty, Tomcat, WebSphere, etc. Further, it offers access to the graphical user interface and API endpoints in a single JAR file.
Who is it recommended for?
Hawt.io is an ideal solution for administrators and developers tasked with managing Java applications efficiently. It is particularly recommended for those seeking a lightweight and modular web console that simplifies the management process. Hawt.io’s support for various plugins, including Logs, Spring Boot, and OSGi, makes it a valuable asset for those dealing with diverse Java application environments.
Pros:
- Easy to manage java applications
- Logs, Spring Boot, and OSGI are various plugins supported by Hawt.io
- Users can access both GUI and API for management
- Supports Jolokia API endpoints
- Operates on OpenShift as well as Kubernetes
Cons:
- Hawt.io is not a suitable option for large businesses
- It can be quite complex and overwhelming for new users
6. Nagios
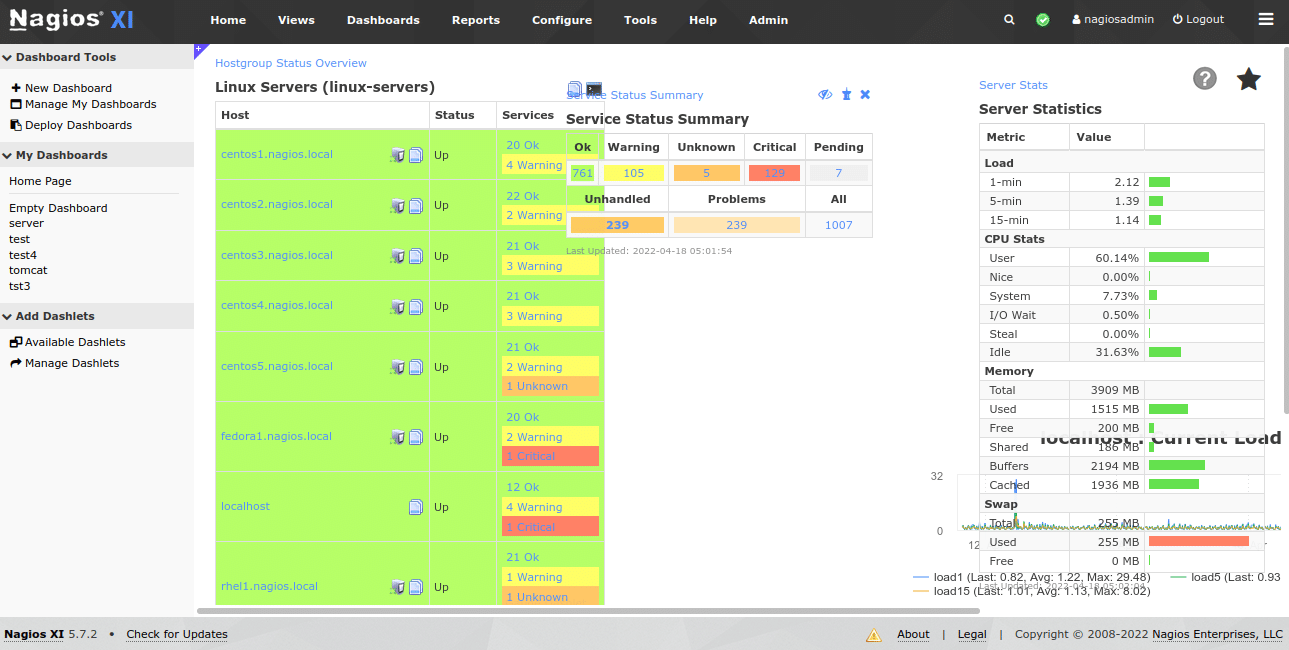
Nagios is another leading software that provides monitoring of Java Management Extensions (JMX). If you are looking for a trusted tool that helps in detecting network outages and protocol failures, we recommend investing in Nagios. It comprises various solutions, out of which Nagios XI and Nagios Core are known to provide JMX monitoring capabilities.
Key Features:
- Helps increase server and application availability
- Quick detection of network outages
- Discovers protocol failures
- Discovers batch jobs
- Nagios has an integrated web-based configuration interface
- Offers full visibility to entire IT operations
- Event handlers can restart failed applications and servers
- Windows Server Monitoring
- Linux Server Monitoring
- Web Application Monitoring
- Detailed status information
- Alerts via email or SMS
- Supports powerful script APIs
- Trending and capacity planning
- Allows Multi-user access to the web interface
- Historical reports
- Supports Third-party addons that help improve reporting capabilities
- Nagios is an open-source tool released under the GPL license
- Helps discover and resolve IT infrastructure problems faster
Why do we recommend it?
Nagios is highly recommended as a leading software for JMX monitoring due to its exceptional capabilities in detecting network outages, protocol failures, and batch job issues. Nagios offers an integrated web-based configuration interface, allowing for easy and comprehensive management of configurations and settings.
Nagios is a great software that also increases application and server availability with its advanced features. Its integrated web-based configuration interface allows administrators to manage and monitor all configurations and settings.
It also provides timely alerts to system admins for failures via email or SMS.
The tool also supports community-developed add-ons and integration with third-party applications. System admins can easily monitor servers with both agent-based and agentless monitoring.
Today, Nagios is trusted by many companies ranging from Fortune 500 to small business owners for monitoring IT infrastructure, sorting log data, and analyzing bandwidth.
Who is it recommended for?
Nagios is recommended for a wide range of users, from system administrators to IT managers, who require robust monitoring of their IT infrastructure. It is especially suitable for organizations that prioritize high server and application availability. Nagios is an excellent choice for those in need of quick detection of network outages, protocol failures, and batch job issues.
Pros:
- Quickly identifies protocol failures as well as network outages
- Helps in the easy management and monitoring of all configurations
- Restarting failed servers and apps is possible with event handlers
- Notifies admins via email or SMS on detecting protocol failures
- Supports integration with third-party applications
Cons:
- The free version lacks the high-quality customer service
- Installation may be technically challenging
7. AppDynamics
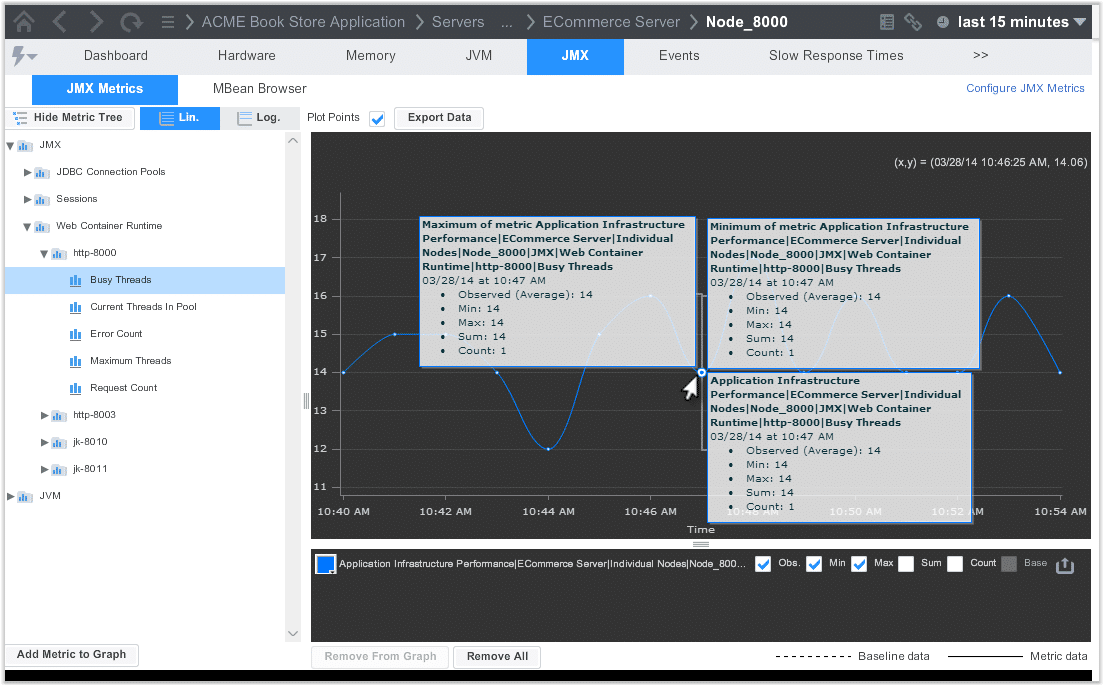
AppDynamics helps perform JMX monitoring by querying JMX metrics. The tool ensures that all the shared resources that can affect or create an impact on application performance must be properly monitored.
Key Features:
- Supports JMX checking
- Access Controls/Permissions
- Helps pinpoint application problems in real-time
- Offers seamless traceability
- Offers complete visibility
- Automated action
- Get access to Code level visibility
- Application performance management
- Dynamic baselining
- Mobile Real-User Monitoring
- Browser Real-User Monitoring
- AppDynamics allows quick installations
- Allows tracking and monitoring multiple platforms
- Synthetic Monitoring
- Offers real-time insights into user experience and business outcomes
- Multi-channel user experience management
- Customized alerting features
- Supports tracking custom MBeans
- Automate threat detection in real-time
- Cassandra tracking
- Supports tracking of custom MBeans
- Drills into database connectivity pool bottlenecks
- Tracks business activities and classes that use JVM assets
- Map JVM dependencies
- Endorses Java monitoring applications, including Weblogic, WildFly, Glassfish, Tomcat, etc.
Why do we recommend it?
AppDynamics is highly recommended for JMX monitoring because it excels in real-time JMX metric querying, ensuring optimal Java application performance. It provides complete visibility into shared resources impacting application performance, enabling proactive issue resolution. With features like dynamic baselining, mobile and browser real-user monitoring, and automated actions, AppDynamics offers a versatile and powerful solution.
AppDynamics serves the purpose of monitoring and managing JMX and works great in pre-production and development environments.
It also allows admins to track and monitor database usage by your applications and custom MBeans. Get access to real-time visibility of custom metrics with the help of AppDynamics. The JMX monitoring tool is the right choice and a great option for most companies as it helps discover which class or business transactions consume JVM resources.
Another advantage of investing in AppDynamics is you can visualize and map JVM dependencies. Also, one can auto-discover and interact with Java applications and JVM. Thus, offering a better view of the application performance compared to the other Java performance tools.
Admins can also analyze key metrics from JVM and Container using JMX.
Who is it recommended for?
AppDynamics is recommended for IT professionals, administrators, and developers seeking advanced JMX monitoring capabilities to ensure peak Java application performance. It suits organizations with complex application environments, emphasizing real-time visibility and proactive issue resolution. AppDynamics is particularly valuable for businesses relying on Java applications and is ideal for those needing multi-channel user experience management and automation for threat detection.
Pros:
- Watches over business operations and classes that employ JVM resources.
- Administrators can also watch over database usage
- Visualize and map JVM dependencies
- Offers better visibility and in-depth insights into application performance
- Administrators can use JMX to evaluate important JVM and Container metrics
Cons:
- Short trial period
- The license model needs improvement
8. eG Enterprise
With eG Enterprise, you do not need to write any code for monitoring Java applications. It supports agent-based and agentless monitoring of applications via JMX and tracks all aspects of JVM performance. It also allows developers to keep track of web container performance and discover bottlenecks.
Key Features:
- IT Performance Monitoring
- Accelerates service delivery performance management
- Improves ROI across different environments
- Pinpoints the root cause of IT service slowdowns automatically
- Allows tracking of each layer and tier of the IT infrastructure
- User Experience Monitoring
- Allows testing applications 24×7 from different places
- Application Code-Level Visibility
- Transaction flow graphs give a clear idea of transaction slowdowns
- Enterprise Application Monitoring
- Faster troubleshooting
- Alerting options
- Built-in correlation rules
- Allows teams to plan future rollouts for any IT environment
- Offers in-depth insights on intuitive dashboards
- Monitors Windows, Linux, AIX, HP-UX, and other operating systems
- Deep Virtualization Monitoring
- Monitors cloud applications and infrastructures across different environments
- Offers unparalleled flexibility
- Auto-discovers infrastructure dependencies
Why do we recommend it?
eG Enterprise is highly recommended for monitoring Java applications as it eliminates the need for code writing, making it user-friendly and efficient. It excels in agent-based and agentless monitoring via JMX, tracking JVM performance comprehensively. With its ability to monitor web container performance and identify bottlenecks, eG Enterprise simplifies the management of Java applications, offering valuable insights for developers and administrators.
Many application developers use eG Enterprise over other tools for it allows monitoring custom Java applications and alerts the team members instantly when abnormalities are noticed.
It also allows monitoring of user experience through synthetic web containers, custom applications, and tracking JVM performance aspects. With the help of eG Enterprise, developers can also auto-discover MBeans of a target application and import them as per your interest.
Another feature that makes it a top choice is eG Enterprise is compatible with hybrid-cloud setups and on-premises deployments.
Who is it recommended for?
eG Enterprise is recommended for application developers and IT teams in need of robust Java application monitoring. It’s particularly suitable for those who want to effortlessly monitor custom Java applications and receive instant alerts for abnormalities.
Pros:
- For monitoring java applications, there is no need to write any codes
- Helps monitor JVM and web container performance
- Sends alerts on discovering any abnormality
- Developers can automatically find and import the MBeans of a target application
- Works well with both on-premises installations and hybrid cloud configurations
Cons:
- The freeware version is not available
- The management dashboards need improvement
9. Dynatrace
Dynatrace is a monitoring platform that simplifies cloud complexities and monitors performance metrics of all Java applications in real-time. Developers can track every transaction and auto-discover the entire Java application stack. It provides continuous insights into your applications and updates on the response time, throughput, and failure rate.
Key Features:
- Monitors application performance
- Cross-application transaction tracking
- Supports garbage collection
- Memory and process statuses
- Offers to monitor of the end-to-end transaction process
- Customizable dashboards
- Allows monitoring application uptime
- Server-side service monitoring
- Offers visibility across VMs, containers, logs, etc.
- Container Monitoring
- Cloud and Virtual Machine Monitoring
- Performs Root-cause analysis
- Apdex score
- CPU and memory usage
- Updates about request and response sizes
- Details on Response Time
- Custom JMX metrics
- Full-stack monitoring
- Offers better visibility
- Collects high-fidelity monitoring data using a single agent
- Supports integration with cloud platforms
- Dynatrace is automatic and requires only a single agent
- Fast and secure automated runtime application vulnerability management
- Uses a single agent to collect metrics
- Maps and detects all causal dependencies
- Offers code-level visibility
Why do we recommend it?
Dynatrace is highly recommended for monitoring Java applications due to its exceptional capabilities in simplifying cloud complexities and providing real-time insights into performance metrics. Developers can effortlessly track every transaction and auto-discover the entire Java application stack, ensuring comprehensive monitoring. Dynatrace offers continuous updates on response time, throughput, failure rate, and other vital metrics, enabling proactive issue resolution and optimization.
It has a pre-configured dashboard that collects all vital metrics and provides SQL statements and code levels.
Another advantage of using Dynatrace is you can keep track of all JVM, servers, or applications. No matter if the selected application is a console application or web service, the tool is compatible with all applications and allows proper monitoring.
Further, it helps detect and diagnose problems in real-time and pinpoints the root cause so that you can work on it and fix it before customers face any challenges. It also helps discover hotspots at the code level and locate CPU or network bottlenecks.
Who is it recommended for?
Dynatrace is recommended for developers, IT teams, and organizations seeking a robust monitoring platform for Java applications, especially in complex cloud environments. Dynatrace caters to a wide range of applications, including console applications and web services, making it suitable for various use cases.
Pros:
- Real-time monitoring of Java application performance metrics
- The entire Java application stack can be automatically discovered with Dynatrace
- Generates insights on response time, request, memory status, etc.
- Real-time diagnosis and problem detection
- Identifies hotspots at the code level
Cons:
- The product might be too much for smaller businesses
- The centralized dashboard’s graphs can be more illustrative.
Conclusion
Java Management Extensions (JMX) includes various tools that help manage and monitor different applications and service-oriented networks. Extracting JMX metrics can be a challenging task for developers and admins, but with the above-listed JMX monitoring tools, things will be a lot better.
If you want to manage and monitor Java applications for your business, invest in Java Management Extensions (JMX). These also help track applications, offer timely alerts, and resolve issues when encountered.
Site24x7, Jolokia, Zabbix, Hawt.io, ManageEngine Applications Manager, eG Enterprise, and Nagios are a few popular JMX monitoring tools that track the shared resources and pinpoint the root cause of problems. JMX collects management data in Java classes and manages and monitors each application. It also helps write codes that further optimize network resource usage and are easy to manage.
Jolokia is an agent-based approach, whereas Zabbix is open-source software that provides real-time monitoring of collected metrics and initiates its own Zabbix JavaPollers process.
Nagios is another great tool that helps detect network outages and protocol failures faster and supports Third-party addons that help improve reporting capabilities. ManageEngine Applications Manager, on the other hand, helps expose management metrics via JMX and offers unmatched visibility into business applications.
Similarly, each tool has its pros and cons that make it a great option for developers.
If your business runs Java applications, upgrade them and make sure the Java Virtual Machine (JVM) is working actively with the help of these tools. Drawing out metrics from JMX is not an easy task, instead, you require tools that help in the management and monitoring of Java applications for better results. JMX Monitoring tools help manage the JVM resources and allow developers to monitor their performance.
Go through the above-listed monitoring tools and pick one as per your need and budget. Make sure to compare and go through their features before selecting one for your Java applications.
