
JavaScript is one of the popular scripting languages used to design and develop dynamic and interactive web pages. However, while developing Javascript projects, there might be cases when a function is not working smoothly due to an error occurring in the code. Hence, to prevent mistakes and spot errors before execution, most developers look for JavaScript debugging tools.
Debugging is not an easy task, but you can find various tools online that will help you in spotting errors and bugs at different development stages. The main role of these popular debugging tools is to identify, examine, and fix the errors by locating their cause.
Here, we will discuss some trusted JavaScript Debug and Monitoring tools and what factors to look for when selecting one for your Javascript project.
Here is our list of the best JavaScript Debugging and Monitoring tools:
- Site24x7 – FREE TRIAL Identifies and tracks JavaScript errors occurring in your web applications. It provides detailed information about the errors, including stack traces, affected browsers, and user impact. Start a 30-day free trial.
- ManageEngine Application Manager – FREE TRIAL A robust observability solution that traces code-level performance and pinpoints issues and errors in real-time, allowing developers to remediate performance issues in Java applications or any other programming language before they escalate. Start a 30-day free trial.
- Sentry.io A JavaScript tool that helps users to monitor and track all bugs and issues. It supports multiple languages and allows developers to detect where the bugs generate each time.
- Theseus Another debugging tool that tracks and detects bugs across several platforms including, JavaScript, Node.js, and Chrome.
- Postman A console-based debugging and error-tracking solution that allows developers to tweak requests and analyze codes. It is compatible with all major operating systems including Windows, Linux, and macOS.
- ESLint A basic tool that identifies and fixes basic syntax problems and catches errors in the code before execution. It allows developers to customize and write their own rules.
- JS Bin A simple and easy-to-use JavaScript debugging tool used for testing and debugging JavaScript code. It allows developers to track real-time changes.
- SplineTech A simple and one of the most popular debugger tools used to debug JavaScript and VBScript inside HTML and DHTML pages.
- Airbrake A lightweight and fast error-tracking and performance-monitoring solution and it has an agentless and serverless architecture that makes the error-detecting process much easier.
- Raygun An error monitoring tool that helps to assess the impact of JavaScript bugs and other problems responsible for degrading performance.
- The Firefox JavaScript Debugger One of the most popular debugging tools that allows developers to examine JavaScript and debug code running locally in Firefox or remotely.
- Edge Developer Tools A built-in tool for Microsoft Edge used to debug and inspect web pages and applications. It is used by developers to debug and automate the browser.
What should you look for in JavaScript Debug and Monitoring tools?
Developers write thousands of codes to develop a web-based application. But, hoping everything will go perfectly is the biggest mistake you might make. You might often face difficulties in the production environment, such as the code not working or not behaving in the manner you wanted it to run.
Many issues arise when developers design and develop a project which often frustrates them. Hence, it is recommended to install debugging tools. These tools will help figure out the root cause of the problem, identify its cause, and eliminate the reason behind its unexpected behavior.
But before buying one for your project, make sure to check if the selected tool supports a rigorous testing phase. Under this phase, developers can easily locate where bugs are found.
Also, make sure it includes intelligent debugging utilities and spot errors and bugs faster as and when they crop up.
Further, look into the error reporting solutions. A debugging tool with an insightful reporting feature will massively expand the Javascript bug monitoring performance.
The Best JavaScript Debug and Monitoring Tools
Indeed, Javascript is mainly used for designing web pages and developing web-based applications, but its services can be extended to other areas of software development as well. If you are looking for tools that help in debugging and monitoring Javascript projects, you have come to the right place.
Have a look at some of the top Javascript debugging and monitoring tools available online:
1. Site24x7 Real User Monitoring – FREE TRIAL
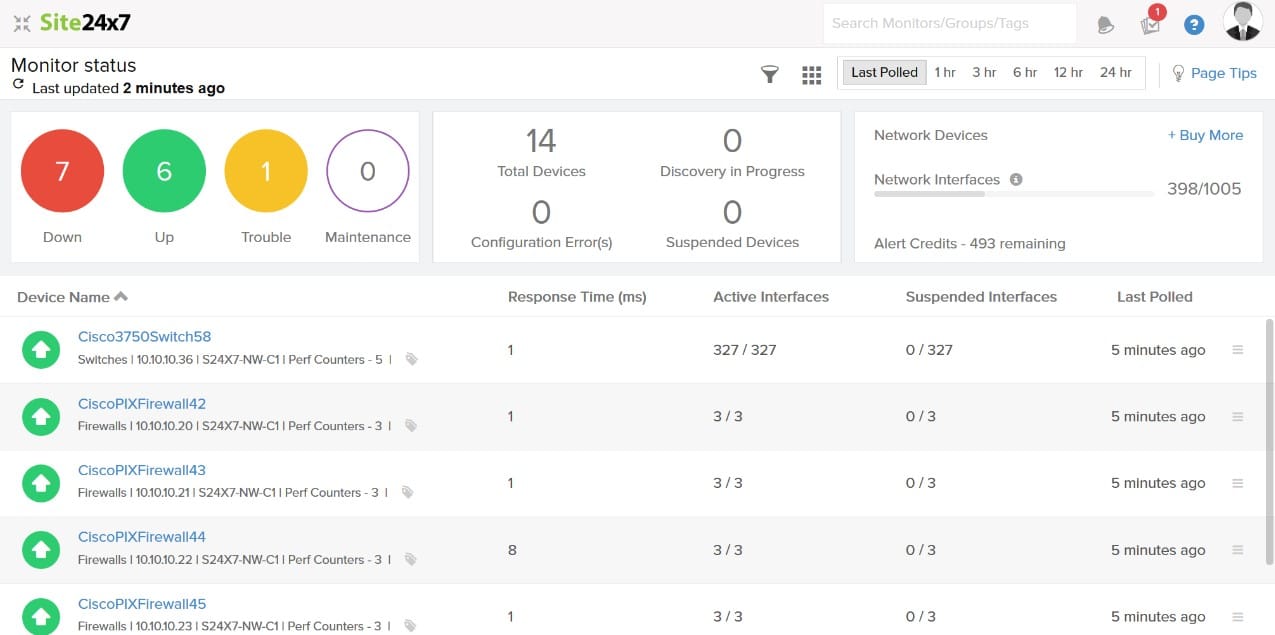
Site24x7 Real User Monitoring is a great tool because it allows users to detect and resolve errors found in the JavaScript codes faster. It even allows businesses to measure resource usage, network latencies, page load time, and other factors responsible for smooth performance. You can even watch over AJAX calls’ performance and get quick insights over user sessions with this helpful tool.
Key Features
- JavaScript error detection
- Integrates with APM Insight
- Response time analysis and resource monitoring
- Real-time visibility into applications
- AI-powered alerts
Why do we recommend it?
With the Site24x7 Real User Monitoring tool, users can detect JavaScript errors even after the web application is live. Apart from monitoring every single page of your application, the tool allows users to gain comprehensive visibility into both the back and front-end performance of your web as well as mobile applications.
There are several benefits to using this tool out of which the important one is tracking a web application’s uptime and availability. Additionally, it allows businesses to keep track of malfunctioning servers, server time, and performance ensuring there is no delay in operations. Upon identification, administrators have the ability to delve further and address specific code lines to address the problems.
Who is it recommended for?
Web application developers and administrators who are willing to address their web and mobile application performance issues in real-time must go in for the Site24x7 RUM tool.
Pros:
- The tools offer full visibility into your web and mobile applications’ front-end performance
- From monitoring page load time to network latency, the tool monitors every single page application and measures live sites
- Updates on how the website performs across different geographical areas using graphs and charts
- Integrating with APM insight will provide visibility into front-end and back-end performance under one console
Cons:
- Errors detected by RUM may be difficult to fix if the end user’s device or ISP is running slowly.
Access the 30-day free trial.
2. ManageEngine Application Manager – FREE TRIAL
ManageEngine Application Manager is a robust observability solution that enables team members or developers to perform deep investigation into code lines and identify errors in real-time. The tool provides full visibility into the system and allows tracking poorly performing SQL queries, if any.
Key Features
- Tracing code-level performance
- Captures errors and exceptions
- Resource consumption analysis
- Provides AI-powered deep insights
- Smart Alerting and predictive reporting
- Distributed Tracing
- Mapping capabilities
- Digital experience monitoring (DEM)
- Full-stack visibility
Why do we recommend it?
ManageEngine Application Manager offers full visibility into applications, which makes it easier for developers to trace and track errors in real-time. Be it Java applications or any other application type, the tool traces code-level performance, analyzes user behavior, and detects anomalies in real-time to prevent critical issues.
With its distributed tracing capabilities, developers can even identify bottlenecks or performance issues in complex application architectures. Further, no matter whether you are working on PHP, JavaScript, or any other language, Application Manager’s mapping capabilities help visualize and understand the relationships between applications. Thus, allows users to easily track resource consumption, monitor application dependencies, and identify bugs and issues.
Who is it recommended for?
Application Manager is a perfect solution for developers who work on complex architecture and demand deeper insights into code-level performance. Further, organizations that prioritize monitoring performance across multiple platforms, such as Java, .NET, .NET Core, Node.js, Python, PHP, and Ruby applications, must go for this tool.
Pros:
- Identifies errors in code and fixes JavaScript issues in real-time
- Tracks application KPIs and analyzes user behavior to identify issues faster
- Monitors resource usage and opportunities for optimization
- Generates real-time insights into application performance
- Addresses poorly performing SQL queries
- Faster identification of the root cause of issues in complex architectures
- Provides Transaction-level insights
- Offers an overview of the application’s current health and operational status
Cons:
- There is no support for reporting in the default installation option
- On-premises installation is essential
A demo option is available for interested ManageEngine users. You can download it and access the 30-day free trial. For quotes and updates on pricing models, you must submit a request via form.
3. Sentry.io
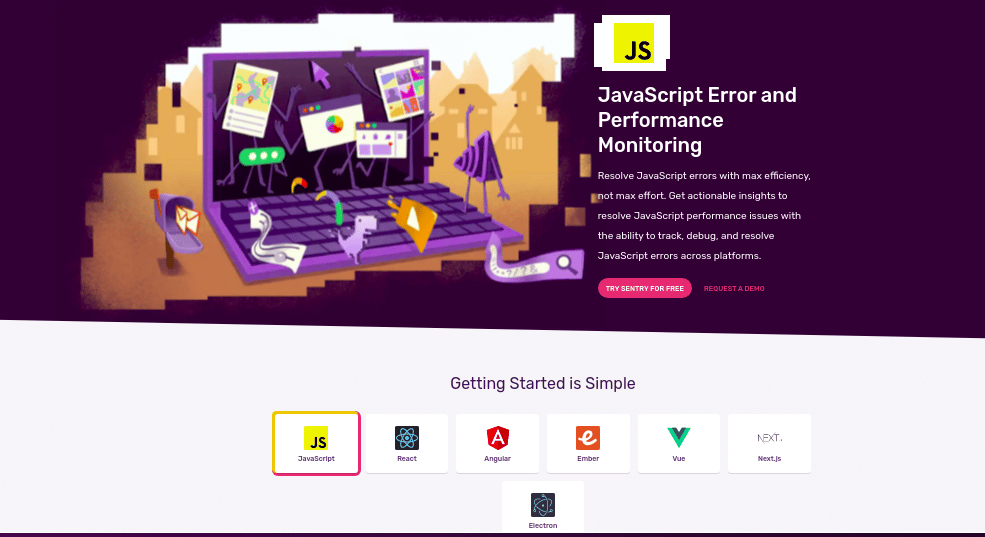
Sentry is an error-tracking software that helps identify, examine, and respond to bugs and crashes in real-time. The open-source software aggregates and adds significant context to stack traces and allows developers to set priorities based on business-critical issues.
Key Features
- Tracking bugs and errors
- Monitors overall performance
- Provides log data insights
- Available for free with premium features
- Fault aggregation workflows
- Visualize end-to-end distributed trace
- Breadcrumbs
- Application Management
- Workflow Management
Why do we recommend it?
Sentry excels in real-time error tracking and debugging across multiple programming languages, making it invaluable for developers dealing with business-critical issues. Its robust performance monitoring tools also help in diagnosing problems quickly, which improves overall efficiency and user experience.
It does not matter whether you use JavaScript, PHP, or any other language, Sentry provides visibility to all language codes and enables users to detect where the bugs generate each time.
Also, with the help of Sentry, you can uncover insights for different teams. From performance monitoring to tracking all the bugs and issues, developers can view all the information and deliver quick remediations.
Who is it recommended for?
Sentry is ideal for developers who are working on complex projects and need to prioritize and resolve bugs in real time. It’s also beneficial for teams looking to monitor performance across various languages like JavaScript, Python, Java, and more. Sentry’s integrations make it a seamless addition to existing development workflows.
Pros:
- Quickly diagnoses and resolves JavaScript issues.
- It helps spot unusual readouts and diagnose problems using the performance monitoring tool.
- Debugs all discover mistakes and enable developers to track the source of the generation of bugs.
- Sentry enables developers to trace slow database queries.
- Developers can discover the root cause faster.
- Uses Breadcrumbs to check the trail of events.
- Offers visibility to errors.
- Improves the efficiency of deployments and user experience.
- Monitors JavaScript, Python, Java, PHP, Ruby, etc.
- Allows integration with existing tools.
Cons:
- Breadcrumbs need to be properly set up and require attention.
- Delay with the error reporting in a few cases.
Sentry offers a free tool with a limited user capacity. You can upgrade to the Team package for $26/month and the Business package for $80/month.
4. Theseus

Theseus is another JavaScript debugging tool used by many developers to monitor and track bugs across several platforms, such as JavaScript, Node.js, and Chrome. It is a free extension of the Brackets code editor released under an MIT License.
Key Features
- Free extension released under an MIT license
- Bug Tracking and Monitoring
- Supports Rewriting of JavaScript code
- Error tracking on JavaScript, Node.js, and Chrome
Why do we recommend it?
Theseus stands out for its real-time function call monitoring and ease of JavaScript code rewriting, offering a nuanced and detailed approach to debugging. Its comprehensive support for JavaScript, Node.js, and Chrome makes it versatile for a range of development scenarios.
After the User Design Interface Group at MIT and Adobe Research collaboration, the JavaScript debugging tool was created that provides a real-time understanding of each function call.
Developers also find it easy to rewrite JavaScript code using the tool. It comprises various features that make it a great option when looking for a performance monitoring and debugging tool.
Who is it recommended for?
This tool is highly recommended for developers who are focused on JavaScript development across multiple platforms like Node.js and Chrome. Those looking to understand intricate control flows or needing to inspect parameters and exceptions in real time would find Theseus particularly beneficial.
Pros:
- It offers a real-time understanding of each function call.
- Rewriting JavaScript code for tracing is much easier with Theseus.
- Allows developers to inspect different parameters and exceptions provided by each function.
- Debugs functions running on JavaScript, Node.js, and Chrome.
- It helps analyze complicated control flow in languages.
Cons:
- No cons found in Theseus
Theseus is free, open-source, and is released under MIT License.
5. Postman

Most developers trust Postman for it helps troubleshoot requests and responses and debugs all problems. The error-tracking solution is compatible with all Windows, macOS, and Linux systems.
Key Features
- Troubleshoot responses and requests
- Postman is compatible with macOS, Windows, and Linux platforms
- Debug issues and analyze responses
- Supports collection feature
- Advanced Reporting
- Supports integrations
- Offers advanced analysis
Why do we recommend it?
Postman is a trusted tool for debugging requests and responses, offering comprehensive features like advanced reporting and analytics. Its capability for repetitive testing tasks and seamless integrations with other platforms make it a go-to solution for many developers.
With the help of the collection feature, developers can save sets of requests and responses of their APIs. It is also great at performing repetitive testing tasks.
Developers can use the perfect tool to tweak requests and analyze codes. Postman is a free tool with premium options. It supports integrations, advanced reporting, analytics, and other features.
Who is it recommended for?
Postman is an excellent fit for developers who need to troubleshoot and debug API requests and responses on multiple operating systems. It is also ideal for teams that require advanced reporting and analytics or are looking for a tool that can automate repetitive testing tasks.
Pros:
- Developers can tweak requests and analyze codes faster using Postman.
- It helps troubleshoot all responses and requests.
- Allows conducting repetitive testing tasks.
- The premium versions support 100 integrations.
Cons:
- The free tool is available only for three members.
Postman offers a free version that supports up to three members. Postman offers three pricing plans. The Team plan costs $12 per user per month, the Business plan costs $24 per user per month and the Enterprise plan costs $69 per user per month.
6. ESLint
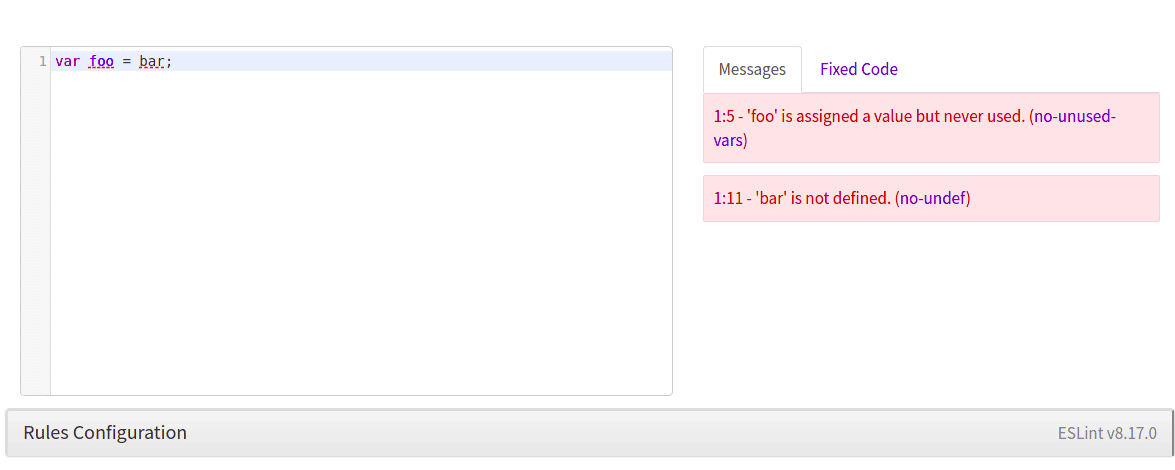
ESLint helps identify and fix basic syntax problems. It is great at catching errors in the code before execution. Also, it can be set up as a plugin for different code editors.
Key Features
- Configurable rules
- Supports writing your own plugins and rules
- Quick detects errors and fixes them automatically
Why do we recommend it?
ESLint is particularly strong at automatically identifying and fixing syntax errors before code execution. Its high level of customizability—allowing developers to write their own rules and plugins—sets it apart from other debugging tools.
ESLint is quick at analyzing codes and fixing problems. It requires Node.js for smooth functioning and supports custom parsers. Further, it is highly compatible with Windows, Mac, and Linux platforms.
Who is it recommended for?
ESLint is best suited for developers who want to catch errors in the early stages of the development cycle and value the ability to tailor the tool to their specific needs. It is also a strong option for teams working across Windows, Mac, and Linux platforms.
Pros:
- Detects errors and fixes problems automatically.
- Allows developers to customize and write their own rules.
- Supports preprocessing of code.
- Perform thorough analysis to detect faults and errors.
- Highly flexible and easy to use.
- ESLint performs all functions well with Windows, Mac, and Linux platforms.
Cons:
- No cons found yet for ESLint
ESLint is open-source and absolutely free.
7. JSBin
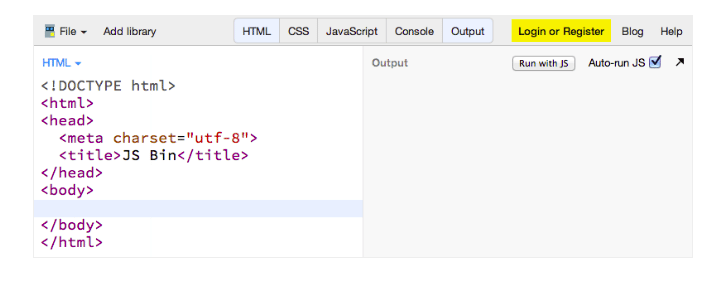
JSBin is another JavaScript tool that helps developers in testing and debugging JavaScript code. Debugging JavaScript codes can be a challenging task, but with JSBin, you can make the debugging process simple and easy.
Key Features
- Drag and drop editing
- Supports keyboard shortcuts
- Supports SSL embeds
- Asset and private hosting
- View real-time changes
- Supports custom templates
Why do we recommend it?
JSBin excels at making the JavaScript debugging process straightforward and effective. Its features like real-time change tracking and drag-and-drop editing significantly streamline the workflow, making it a robust tool for testing and debugging.
Once you have familiarized yourself with the tool and its features, everything will become so easy for you. Developers can archive or delete code bins as per their requirements.
Further, it is much easier to run the JavaScript code under JSBin. Also, it allows developers to view the results on the debug console.
Who is it recommended for?
JSBin is suitable for developers who prioritize ease-of-use and real-time feedback while debugging JavaScript code. It is also recommended for those who require a tool that allows for quick adjustments to templates and default preferences without affecting other running applications.
Pros:
- JSBin supports code clones, sandbox mode, Vanity URLs, and other features.
- It allows developers to change templates and default preferences at any time.
- Track real-time changes.
- Conflicting codes running in other applications cause no impact.
- Easy to run the JavaScript code and track bugs using JSBin.
Cons:
- Saving the original bin is not possible.
- All settings are not visible in the user interface.
JSBin is entirely free and open source. There is a Pro subscription available for $126 per year or $16 per month.
8. SplineTech
SplineTech is a popular JavaScript editor and debugger tool compatible with all Windows operating systems. Using the tool, developers can easily debug JavaScript and VBScript inside HTML and DHTML pages. Further, it can modify supported languages.
Key Features
- 100% independent, standalone full-featured JavaScript debugger
- Full visibility into function calls
- Monitors local variables
- Pop-Up debugging
- SplineTech supports all Windows operating system
Why do we recommend it?
SplineTech stands out for its comprehensive debugging capabilities, supporting a variety of JavaScript libraries and frameworks. Its 100% independent, standalone nature ensures that there are no portability issues, offering full visibility into function calls and local variables.
Users can debug JScript, ExtJS, JQuery events, and both simple and complex JavaScript via SplineTech.
Who is it recommended for?
SplineTech is a strong fit for developers using Windows operating systems who require extensive debugging capabilities across various JavaScript libraries and frameworks. It’s also recommended for those who need to debug remote JavaScript files or are looking for a tool with no portability issues.
Pros:
- Allows debugging Debug jQuery, Ext-js, Prototype.js, etc.
- Allows debugging HTML and JavaScript pages.
- There are no portability issues.
- Users can debug remote JavaScript files easily via Splinetech.
Cons:
- No cons found in SplineTech
SplineTech is open-source and available for free.
9. Airbrake
Airbrake is a frictionless error and performance monitoring solution designed ideally for developers to track bugs and errors. It is one of the fastest and most lightweight error monitoring tools that supports all major languages and frameworks.
Key Features
- Deployment tracking
- CI/CD integration
- Airbrake is compatible with multiple languages
- Real-time notifications
- Performance Monitoring
- Error Monitoring
- Supports breadcrumbs and backtrace plugins
Why do we recommend it?
Airbrake distinguishes itself through its lightweight and fast error monitoring capabilities that work across all major languages and frameworks. Its real-time notifications and deep error reporting enable developers to quickly identify and resolve issues.
It has an agentless and serverless architecture that supports code snapshots and breadcrumbs. Thus, making the process of examining and detecting errors in the code easy and quick. With the help of this tool, developers gain full visibility into the health of the entire stack.
It also provides real-time notification to users on critical errors. Further, you can integrate it into Slack, Trello, Github, etc.
Who is it recommended for?
Airbrake is recommended for developers who are looking for an all-encompassing error and performance monitoring solution that integrates seamlessly with project management tools like Slack, Trello, and Github. Its agentless and serverless architecture makes it particularly useful for teams interested in maintaining a streamlined development stack.
Pros:
- It helps discover the root cause of software errors
- Offers in-depth error reports
- Allows integration with project management solutions like Github, Trello, Slack, etc.
Cons:
- Difficult to backtrace all log files
Airbrake provides a free trial for a 30-day with all features. The product price depends on the Tiers. The Tier 1 package supports 25k errors and costs $19 per month. The Tier 4 package supports up to 1 million errors and costs $299 per month.
10. Raygun
Raygun is an error monitoring tool that helps assess the impact of JavaScript bugs and other problems responsible for degrading performance. Raygun requires only a few lines of code for the setup.
Key Features
- Real-time code-level insights.
- Quick identification and fixing of errors.
- Full visibility into the tech stack.
- Raygun is quick-to-install and easy-to-use software.
- Real-time deployment monitoring.
- Supports integrations.
- Uses smart filtering options.
Why do we recommend it?
Raygun excels in providing real-time, code-level insights and quick error identification and resolution. Its capacity for smart filtering and integration with third-party tools like Jira and Zendesk makes it a comprehensive debugging solution.
Using the tool, developers get the advantage of generating code-level insights in real time. If you are looking for a debugging tool that detects errors and fixes issues fast, go with Raygun.
Further, you don’t have to go through each log as it provides full visibility into the entire stack and saves you time. Get insights on the main cause of the errors and crashes using Raygun.
Who is it recommended for?
Raygun is ideal for developers who want to proactively manage errors and performance issues without sifting through logs. It’s also well-suited for teams that rely on third-party integrations and need real-time alerts to minimize the impact of errors on end-users.
Pros:
- Using Raygun, developers can prioritize errors and fix them before they create any negative impact on the end-users.
- Offers insightful reports for analysis.
- Integrates with third-party tools like Jira and Zendesk.
- Provides real-time alerts to end-users on fault detection.
- Raygun helps reduce MTTR.
- Access to add contextual information as per the need.
Cons:
- Users find it difficult to understand the user interface.
- Trouble sending notifications if an error reoccurs.
Raygun JavaScript debugging tools can be found in the Error Monitoring & Crash Reporting application, which costs $4 per month. The price for each product is scalable based on the required capacity.
11. The Firefox JavaScript Debugger
Firefox JavaScript Debugger is another powerful tool that helps track down bugs. It is used by many developers to examine JavaScript and debug code running locally in Firefox or remotely. It supports various web development tools that help in inspecting cookies, and errors, checking missing features and analyzing the site’s responsiveness and layout performance.
Key Features
- Debug HTML, CSS, and JavaScript
- Accessibility inspector
- Supports Storage Inspector to inspect cookies
- DOM Property Viewer
- Style editor support
- Examine and modify source code
- Identify and fix code errors
Why do we recommend it?
The Firefox JavaScript Debugger offers an extensive suite of debugging capabilities, from examining code locally or remotely to allowing paused code execution for monitoring. Its integrated tools for inspecting cookies and analyzing site responsiveness make it a comprehensive debugging option.
Earlier the best features of the Firefox development tools were integrated into the browser. Hence, you can still find all its tools, but not as a separate plugin. The Firefox JavaScript Debugger is free-to-use software that runs tests step by step to track bugs and spot errors.
Who is it recommended for?
This tool is ideal for developers who are looking for an all-in-one debugging solution that offers capabilities beyond JavaScript. It’s especially beneficial for those who require advanced features like accessibility inspection and style editor support, or who need to debug worker threads and eval sources.
Pros:
- Developers find it easy to search and access pages using these tools.
- Developers can examine the code and modify its state to track bugs.
- It helps debug code running locally or remotely.
- Allows developers to pause code execution for monitoring.
- Allows debugging worker threads and eval sources.
- Enables developers to visualize different aspects of a page.
- Using its web console, you can track web pages and make changes to them.
- It helps analyze the site’s responsiveness and layout performance.
- The accessibility inspector helps check missing features.
Cons:
- Frequent updates are not supported.
Firefox JavaScript Debugger is completely free. You can use it without any cost.
12. Edge Developer Tools
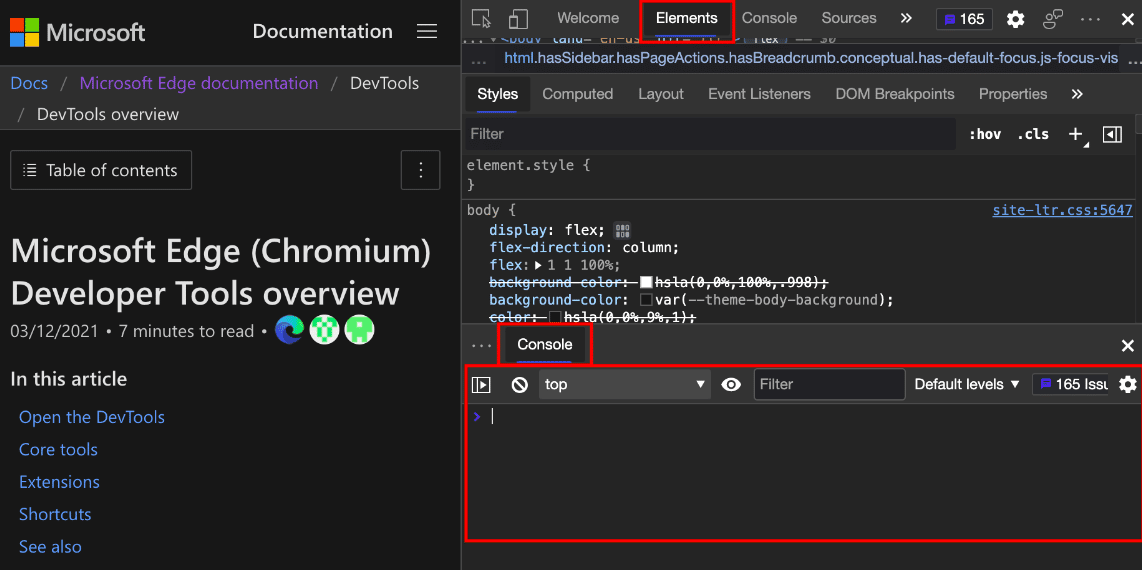
Microsoft Edge comprises built-in web development tools that are available for free and aid in inspecting and debugging web pages and applications. With the help of these tools, developers can make changes to the source files and create website projects.
Key Features
- Offer best-in-class extensions
- Web Compatibility
- The tool is compatible with different versions of Windows, macOS, iOS, and Android
- Allows developers to debug and automate the browser
- Supports a new feature – quiet notification requests
Why do we recommend it?
Edge Developer Tools offer a robust set of features including best-in-class extensions and web compatibility across multiple platforms. The tool’s ability to debug and automate the browser, coupled with specialized features like quiet notification requests, makes it a versatile choice for web development.
To use the developer tools, all you require is to press the F12 or Ctrl+Shift+I key on the keyboard. You can also go to the settings in Microsoft Edge, select More Tools, and click Developer Tools.
There are many advantages of using Edge, but it lacks extension support. However, a developer must not worry as it comprises various developer tools that can be useful for their project work.
Who is it recommended for?
Edge Developer Tools are recommended for developers who work across various operating systems including Windows, macOS, iOS, and Android. It’s particularly useful for those who need to test their websites on multiple virtual machines or who prioritize web accessibility and compatibility.
Pros:
- It supports several virtual machines for testing and development procedures.
- You can perform free testing with Azure Remote App using RemoteIE.
- Supports tools like screenshot generator that help view how their generated pages look across several browsers.
- It helps manage and detect installed apps and sites.
- Allows developers to scan the website with tools like WebHint.
- It helps developers find and fix accessibility issues with insightful reports.
Cons:
- Lacks plugin support.
- Lacks add-ons.
The Microsoft Edge browser comes with built-in web development tools, called Microsoft Edge DevTools. You can use it without any cost.
Conclusion
No doubt, JavaScript is a popular scripting language and is mostly used for developing websites and web-based applications. But, at the time of coding, developers may face problems in the production environment, such as the code not behaving in the manner you wanted it to run.
To identify and fix code errors and other problems, developers switch to monitoring and debugging tools for your JavaScript project. While selecting one for your project, make sure to check if the tool supports intelligent debugging utilities and error-reporting features.
These features will help expand the Javascript bug monitoring performance.
Here, we have listed some of the best JavaScript Debug and Monitoring Tools that will help examine and respond to bugs and crashes in real time. Further, most of the tools will help uncover insights for different teams.
Each debugging tool has its advantages and disadvantages. Check and compare all the above-listed JavaScript Debug and Monitoring Tools and then select one for your Javascript projects.
Most of the tools support breadcrumbs, provide workflow management features, and aid developers in quickly performing diagnoses and resolving JavaScript issues. If you are looking for a similar tool that offers full visibility into the entire tech stack, go through our list.
Debugging is a critical part of an application’s performance and each developer must test codes, look for errors, and fix them in real-time to deliver a better-performing website or web-based application. Hence, compare their features and see if the tools are free or support premium options before making a final call.
