
Databases are an integral part of every software and system infrastructure, as this is the layer that stores data and retrieves it when needed. Since the process of storage and retrieval is critical for any application, you must ensure that the database is in optimum health and performance at all times. Also, any improvements or failures in its performance can impact the interpretation of one or more of your applications.
Here is our list of the best Database monitoring tools:
- ManageEngine OpManager Nexus – Best for DBAs and engineers overseeing hybrid database environments
- Datadog Database Monitoring – Best for businesses of all sizes with diverse DBMS integrations
- SolarWinds DBA – Best for multi-location teams running multiple database platforms
- OpsView – Best for hybrid on-prem and cloud multi-database setups
- dbWatch – Best for large data centers managing many database instances
- AimBetter – Best for SQL Server, Oracle, and SAP users wanting expert support
- SQL Power Tools – Best for large organizations needing zero-impact SQL query analysis
Given this criticality of the database performance, it makes sense to monitor it all the time, But this may not be easy given the vastness of the database itself. This is why automated database monitoring tools can come in handy for you.
In this article, we’ll take an in-depth look into the best database monitoring tools available in the market today, so you can decide which of these is the best for you. Let’s jump into the specifications and features of each of these tools right away.
The Best Database Monitoring Tools
Methodology for selecting a database monitoring tool
There are many factors to consider when selecting a database monitoring tool including the size of the company, the type of database, the type of work being done, etc.
The type of database is important because it can help determine what kind of monitoring tools are needed. Also, the type of work being done is important because it can help determine which features are most useful for that specific situation.
Apart from these, we have listed a few more criteria that one must consider when reviewing a database monitoring tool:
- Support connecting database instances from multiple DBMSs
- Optimizing and debugging SQL queries
- Monitoring of database and server resources
- Risk-free evaluation period with a free trial, demo, or money-back guarantee
- Fair price that represents the worth of the product and is in line with its quality
- Easy-to-use interface with alert options. How quick is the tool at notifying about resource shortages and declining performance?
- Secure access protocols with numerous user accounts and authentication
1. ManageEngine Applications Manager – FREE TRIAL
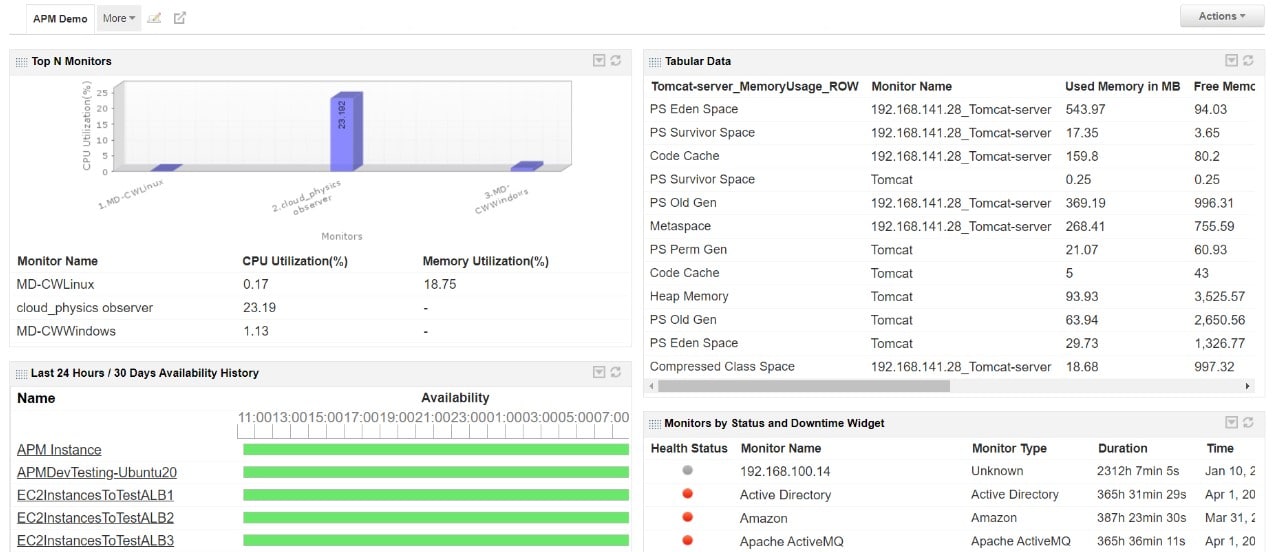
ManageEngine Applications Manager is a performance monitoring system for software and services. Its capabilities include database monitoring. It watches relational databases, including Oracle, SQL Server, MySQL, and PostgreSQL. The system can also track activity in NoSQL services, such as Cassandra, Couchbase, and MongoDB, and big data packages.
Key Features:
- Multi-Vendor Support: Uses a single console to keep an eye on several databases for different environments, including cloud, virtualized, or on-premises.
- Comprehensive Analysis: Examines your database’s response time for each individual web transaction
- In-Depth Insights: Provides detailed insights into the health and performance of different database types for optimization
- Alert System: Allows setting up both static and dynamic thresholds and notifies on being violated
- Reporting: Allows users to save the generated report in the form of PDF, Excel or CSV format
Why do we recommend it?
ManageEngine Applications Manager uses specialized procedures to monitor different database types and analyze the dependencies of additional applications dependent on databases. It is a versatile tool for modern IT systems due to its multi-platform compatibility, capacity projections, and extensive alerting system.
Who is it recommended for?
IT managers and database administrators who handle multiple databases and applications might find it highly useful for it allows monitoring all relational, NoSQL, big data, and in-memory database management systems from a single console. Businesses using hybrid cloud systems and those that demand capacity planning tools will find it very helpful.
Pros:
- Agentless Database Monitoring: No need to install or look after the maintenance of agents with this solution as it uses agentless methods like native OS and API calls
- Slow-Running Queries: Pinpoints queries that are operating slowly and determines the underlying cause for the performance gaps.
- Monitor Business-Critical DB Metrics: Provides updates on resource usage, user session, and query performance for business optimization
- Reduce MTTR: Uses DB monitors to automatically detect anomalies which will assist in lowering MTTR.
- Custom Reports: Users can generate reports on demand or based on schedules
Cons:
- Cost: Small and medium-sized businesses might find the tool a bit pricey but it comes with a wide range of features.
ManageEngine provides three editions for Applications Manager:
- Free
- Professional – from $395 per year
- Enterprise – from $9,595 per year
The Free edition will track databases and is limited to monitoring five assets. Register for the 30-day free trial.
EDITOR'S CHOICE
ManageEngine Applications Manager is our top pick for a database monitoring tool because this package is able to track the performance of a number of DBMSs. It can monitor relational databases, such as SQL Server, MySQL, and PostgreSQL, NoSQL systems, such as MongoDB and Cassandra, the in-memory Memcached system, and bog data management tools, such as Hadoop and Apache Spark. The tool focuses on capacity issues and throughput metrics rather than query analysis. It will also monitor all of the applications and services that link to each of your database instances. This is achieved through the discovery of all applications and the assembly of an application dependency map. That map includes server resources as well as applications. So, the tool is abv to forecast upcoming server resource requirements rather than waiting for a shortage to occur. This foresight gives technicians the opportunity to head off disaster before performance issues arise.
Download: Get a 30-day free trial
Official Site: https://www.manageengine.com/products/applications_manager/download.html
OS: Windows Server, Linux, AWS, and Azure
2. Paessler PRTG Network Monitor – FREE TRIAL
Paessler PRTG is a sensor-based monitoring system that can monitor a wide range of devices on your network, including databases. It comes with many sensors explicitly designed for monitoring different databases and to ensure that they work optimally.
Key Features:
- Numerous Servers: Database of more than 300 sensors is available for monitoring servers, networks, and applications.
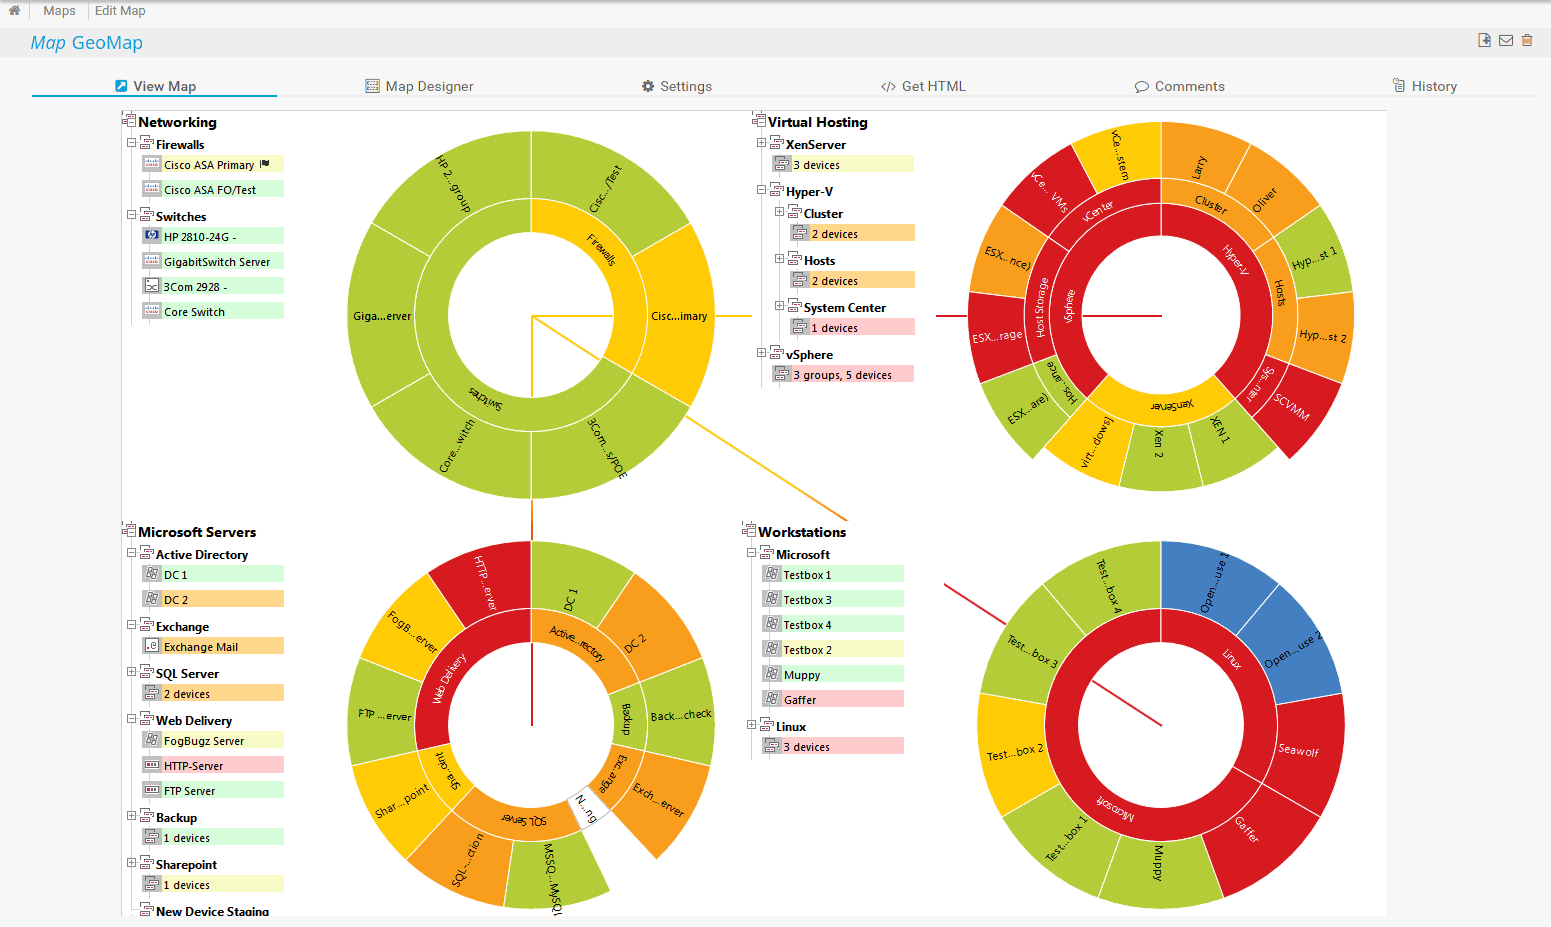
- Map Editor: Displays your database architecture for internal or external usage
- PRTG Database Observer: Extension that helps enhance the tracking of database activity
- Alert System: Notifies in case of slow-performing database
- Database Server Monitoring: Facilitates the monitoring of query execution times on your database servers.
Why do we recommend it?
Apart from just monitoring the networks, Paessler PRTG is a robust solution that monitors servers as well as applications and key metrics for different databases. With the help of this tool, users can even keep a close watch on the execution time for an SQL query and notify about database issues in real time
Who is it recommended for?
Most IT managers and database administrators prefer PRTG because it offers server, network, and application monitoring capabilities in the same package as well as supports SaaS platform installation along with a Windows server. Businesses that use multiple database types can also choose this tool for monitoring purposes
Pros:
- Deployment Options: Users can deploy on-premises for the Windows server as well as the SaaS platform
- Customizable Sensors: Option to pull specific metrics to monitor
- In-Depth Reporting: Create database reports on demand or schedule as per their needs and preference
- Data Visualization: Makes personalized PRTG maps and dashboards for viewing your configuration as you see fit.
Cons:
- Advanced Features: Some of the advanced features offered by the tool can be challenging for new users to learn and understand
Some of the sensors you can choose for monitoring your database.
- Microsoft SQL v2 sensor
- MySQL v2 sensor
- Oracle SQL v2 sensor
- PostgreSQL sensor
- ADO SQL v2 sensor
- WMI Microsoft SQL Server 2008, 2012, 2014, 2016, 2017, and 2019 sensor
The cost depends on the number of sensors you use. Typically, one sensor measures a specific metric in one unit. Here is the breakdown of the cost.
- First 100 sensors – Free
- PRTG 500 – 500 sensors, 1 server installation – $1,750
- PRTG 1000 – 1000 sensors, 1 server installation – $3,200
- PRTG 2500 – 2500 sensors, 1 server installation – $6,500
- PRTG 5000 – 5000 sensors, 1 server installation – $11,500
- PRTG XL1 – Unlimited sensors, 1 server installation – $15,500
- PRTg Enterprise – 20,000 sensors +, unlimited server installations – Custom quote
PRTG is free to use for up to the first 100 sensors. You can start with a 30-day free trial to figure out your network requirements.
3. Site24x7 Database Monitoring – FREE TRIAL
Site24x7 has an intuitive and advanced SQL server monitoring tool that ensures the availability and performance of your SQL server. It is designed to deliver optimal SQL performance around the clock.
Key Features:
- Capacity Planning: Provides insights into different aspects of buffer management and memory to ensure the best capacity planning.
- Database Detail cCapture: Collects information on data file sized used and other attributes for monitoring
- SQL Server Status: Provides updates on the response time, availability status, downtime, and more
- Application Monitor: Watches over the activities of all applications in real-time
- System Discovery: Discovers and maps down applications around the database and their dependency
Why do we recommend it?
Site 24×7 offers out-of-the-box database monitoring capabilities that help track the performance and availability of SQL servers better. It is an all-in-one solution that triggers alerts on failovers and assists with capacity planning.
Who is it recommended for?
DevOps teams and database administrators that demand 24/7 monitoring and analysis for MySQL, Postgres, MariaDB, and other relational databases might find it a perfect option. In fact, organizations that need a cloud-based solution with no additional installations and a single package with all modules must go in with this tool.
Pros:
- Query Analysis: Analyzes database queries for performance optimization
- No Manual Intervention: Helps you monitor your databases automatically and around the clock.
- Alert Settings: Notifies using different channels if there is a problem with your database or it goes offline
- Cloud-Based Service: Does not require any additional monitoring software since it is a cloud-based service
- SQL Monitoring: Keeps tabs on SQL execution, errors, replications, and compilations.
Cons:
- Comprehensive Solution: Users may take some time to go through each functionality for it is a feature-rich comprehensive platform
The starter pack starts at $9 per month, and it covers 10 websites/servers/clouds, 500MB logs, five network monitoring interfaces, two NetFlow analyzer devices, and standard support. You can always include add-ons at extra cost to suit your needs. Start with a 30-day free trial.
4. ManageEngine OpManager Nexus – FREE TRIAL
ManageEngine OpManager Nexus, formerly OpManager Plus, is a database monitoring tool that analyzes the health and performance of all databases in your environment. It monitors relational, NoSQL, in-memory, cloud-based, and traditional databases and displays the findings through a unified console.
Key Features:
- Key Metrics: Tracks many key metrics, like CPU, memory, and I/O, to ensure the optimal use of resources.
- Performance Issues: Analyzes cache efficiency and locks to identify performance bottlenecks.
- Storage Usage: Tracks the available storage space to avoid overflow and write failures.
- Dashboards: Visualizes the findings on intuitive dashboards and reports.
- Wide Coverage: Correlates data from different databases to provide an accurate view of your database health.
Why do we recommend it?
OpManager Nexus combines performance metrics, query analysis, anomaly detection, log analysis, and resource usage to offer detailed insights into your infrastructure’s health. The highlight is that it correlates all this data and displays the findings on charts and graphs that make it easy to understand for anyone.
Using this tool, you can go deep into the root cause of slow query performance and storage issues and fix them before they impact applications.
Who is it recommended for?
It is a good choice for database administrators, systems engineers, application owners, developers, and others who are responsible for maintaining the overall architecture of applications.
Pros:
- Highly Scalable: It can monitor thousands of databases.
- Anomaly Detection: Correlates multiple metrics to pinpoint the root cause.
- Reports: Generates extensive reports for compliance and auditing
- Coverage: Monitors modern and legacy databases without requiring any custom scripts.
Cons:
- Feature-rich: It can take some time to fully explore the tool.
The pricing starts at $1,233 for the Professional edition and $19,995 for the Enterprise edition. Start a 30-day free trial.
5. Datadog Database Monitoring
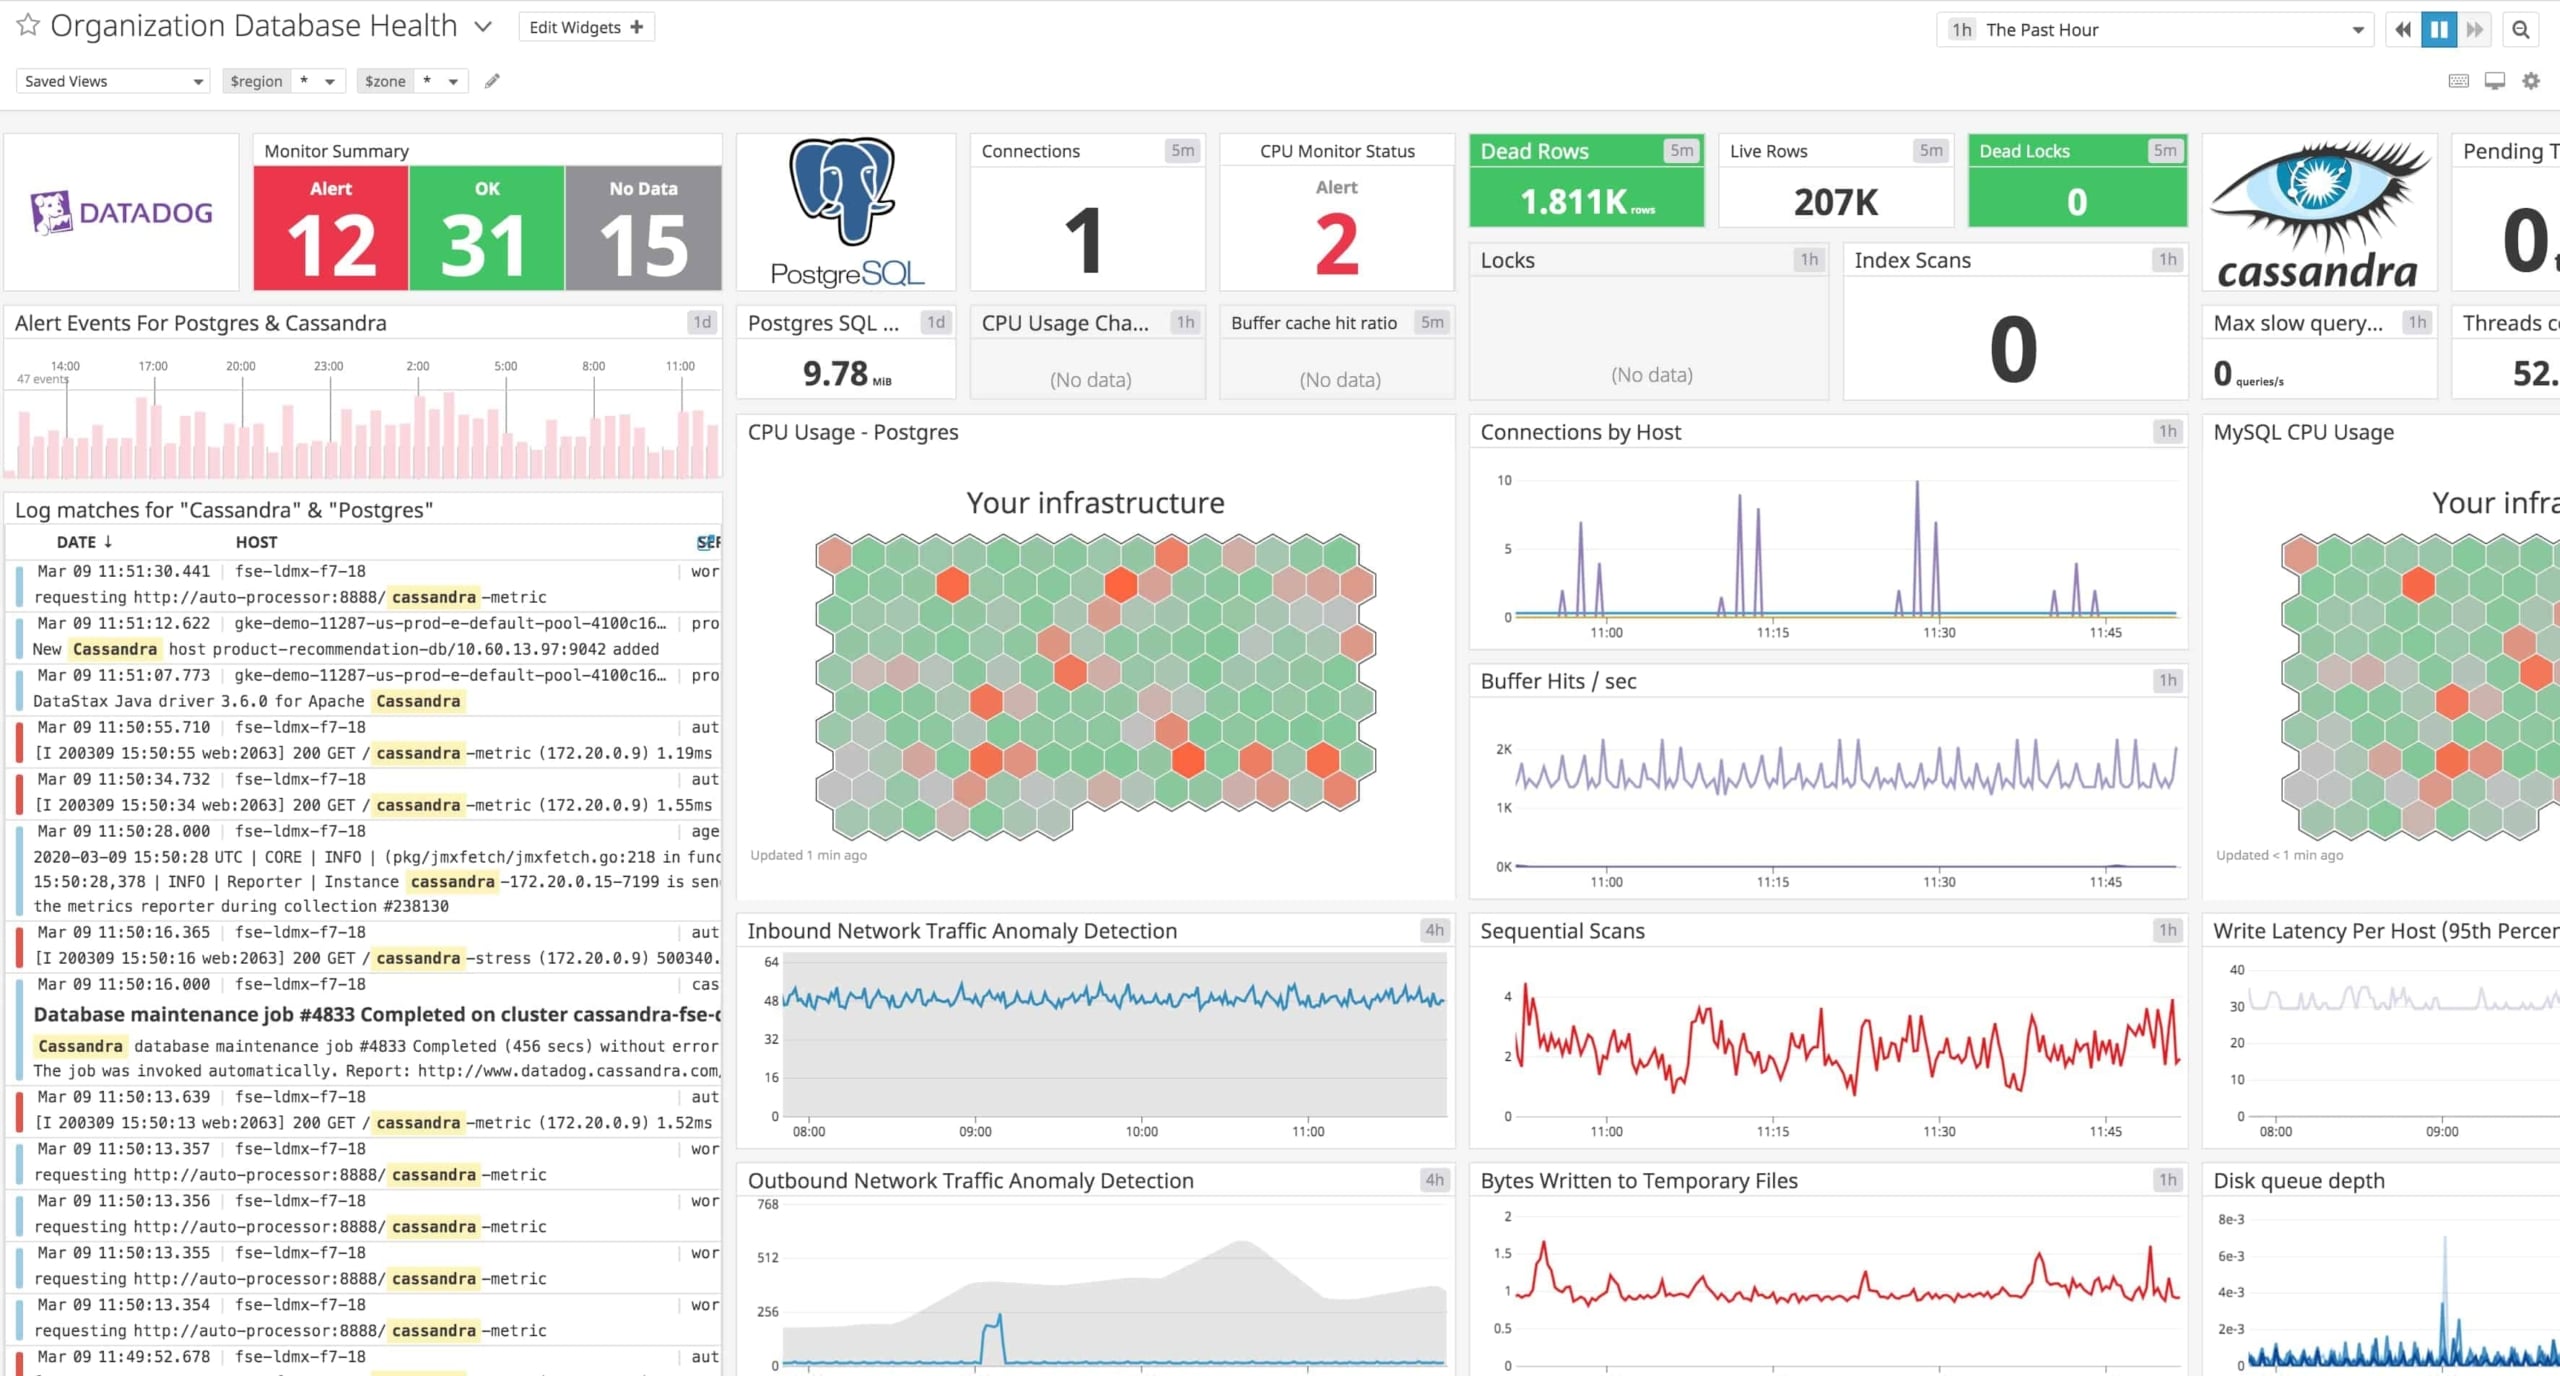
Datadog’s Database Monitoring tool is a comprehensive way of staying on top of metrics, performance, traces, and logs from your infrastructure. It also monitors the health and performance of your databases at all times, so you can proactively fix issues and resolve deadlocks before they impact your applications.
Key Features:
- Database Monitoring: Enables admins to monitor all the metrics and parameters of the database
- Detect Performance Bottlenecks: Monitors and identifies performance bottlenecks at an initial stage
- Metrics Tracking: Collects and views query metrics apart from tracking system performance metrics from different databases
- Data Protection: Use automatic PII obfuscation in explain plans and query metrics to safeguard confidential information.
Why do we recommend it?
Datadog is a SaaS package that offers real-time performance insights and supports 400 integrations alongside a strong alert system. With the help of infrastructure or website monitoring modules, the performance monitor—which offers an array of database performance visualizations—can pinpoint the specific location of any performance problems in your IT system.
Who is it recommended for?
Datadog stands out for its multiple DBMS integrations and per-host charging plans that are suitable for businesses of all sizes. Although most monitoring tools can interact with SQL Server and many also support MySQL, MariaDB, Oracle, and PostgreSQL, if you use a very obscure database management system (DBMS), you may need to rely on Datadog.
Pros:
- Cloud-Based Monitoring: Using a web browser admins can access the tool from any location
- Detailed Analysis: Provides in-depth insights into the data trends, query activities, and anomalies for better optimization
- Performance Graphs: Tracks and analyzes multiple metrics using graph options
- Customizable Dashboard: NOC teams might find it easy to view, track, and get notified of database activities
Cons:
- Integration Support: Offers no support to Oracle integrations
Datadog offers three comprehensive plans, and they are:
- Free
- Pro – $15 per host per month
- Enterprise – $23 per host per month
Besides, many add-ons can be included in your plan to get specific monitoring capabilities, and of course, they would cost extra. Click here for a 14-day free trial.
6. SolarWinds Database Performance Analyzer
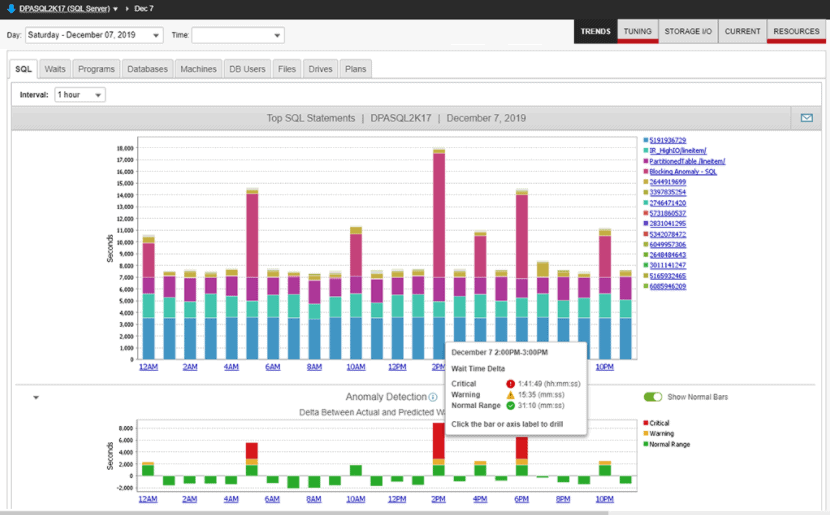
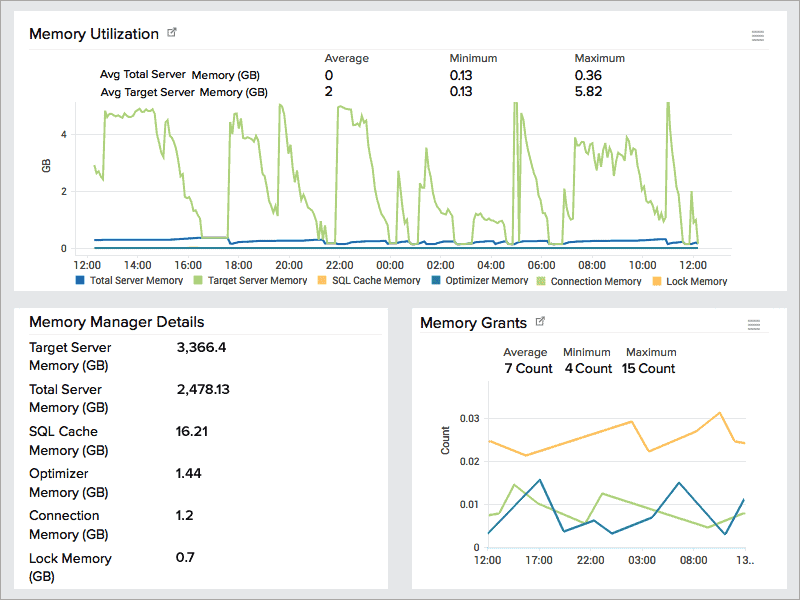
SolarWinds Database Performance Analyzer (DPA) is a top-notch tool created by experts to stay on top of your databases’ health and performance, perform fine-tuning where needed, analyze its working, get the necessary metrics for analysis, and more. Its real monitoring coupled with a host of features such as cross-platform support and AI make it an effective tool for anyone who wants to monitor the underlying database.
Key Features:
- Monitoring Capabilities: Allows access to both real-time and historical data for better analysis and monitoring
- Live Database Monitoring: Monitors MySQL, MariaDB, Amazon Aurora, SQL server, and other database types in real time
- Intuitive Performance Analysis: Analyzes performance and represents insights into an easy-to-understand format
- Blocking and Deadlock Analysis: Provides insights into the overall effect of blocking on database performance and generates deadlock resolution reports
- Recommendations: Provide appropriate suggestions on how to optimize the database workload
- Anomaly Detection: Uses machine-learning algorithms to identify anomalies in real time
- Query Performance Analysis: Identifies performance bottlenecks by analyzing individual database queries
Why do we recommend it?
SolarWinds Database Performance Analyzer offers real-time monitoring with which users can keep track of all instances, queries, and structure changes in real time. It uses machine-learning algorithms to detect anomalies and performs root cause analysis across multiple database platforms.
Who is it recommended for?
SolarWinds Database Performance Analyzer is a perfect solution for businesses that run multiple DBMSs in different areas or locations. Apart from offering live monitoring functionalities, the tool offers live analysis capabilities which you can use to easily identify the poorly planned structures and remediate issues quickly.
Pros:
- Real-Time Monitoring: Keeps a close watch over your databases, optimizes performance and alerts in real-time on detecting anomalies
- Customizable Dashboard: Allows users to easily view and monitor the health and performance of databases
- Quick Troubleshooting: Analyzes which queries consume maximum resources and accordingly troubleshoots performance of the SQL server
- Root Cause Analysis: In-depth insights into database performance enable users to diagnose the root cause of the problem
- In-Depth Insights: Updates on the usage and database engine status in detail which further aids in better decision-making
Cons:
- Navigation Issue: Some users might find it challenging to navigate different options
Starts at $1,111. Click here for a fully functional free trial.
7. OpsView
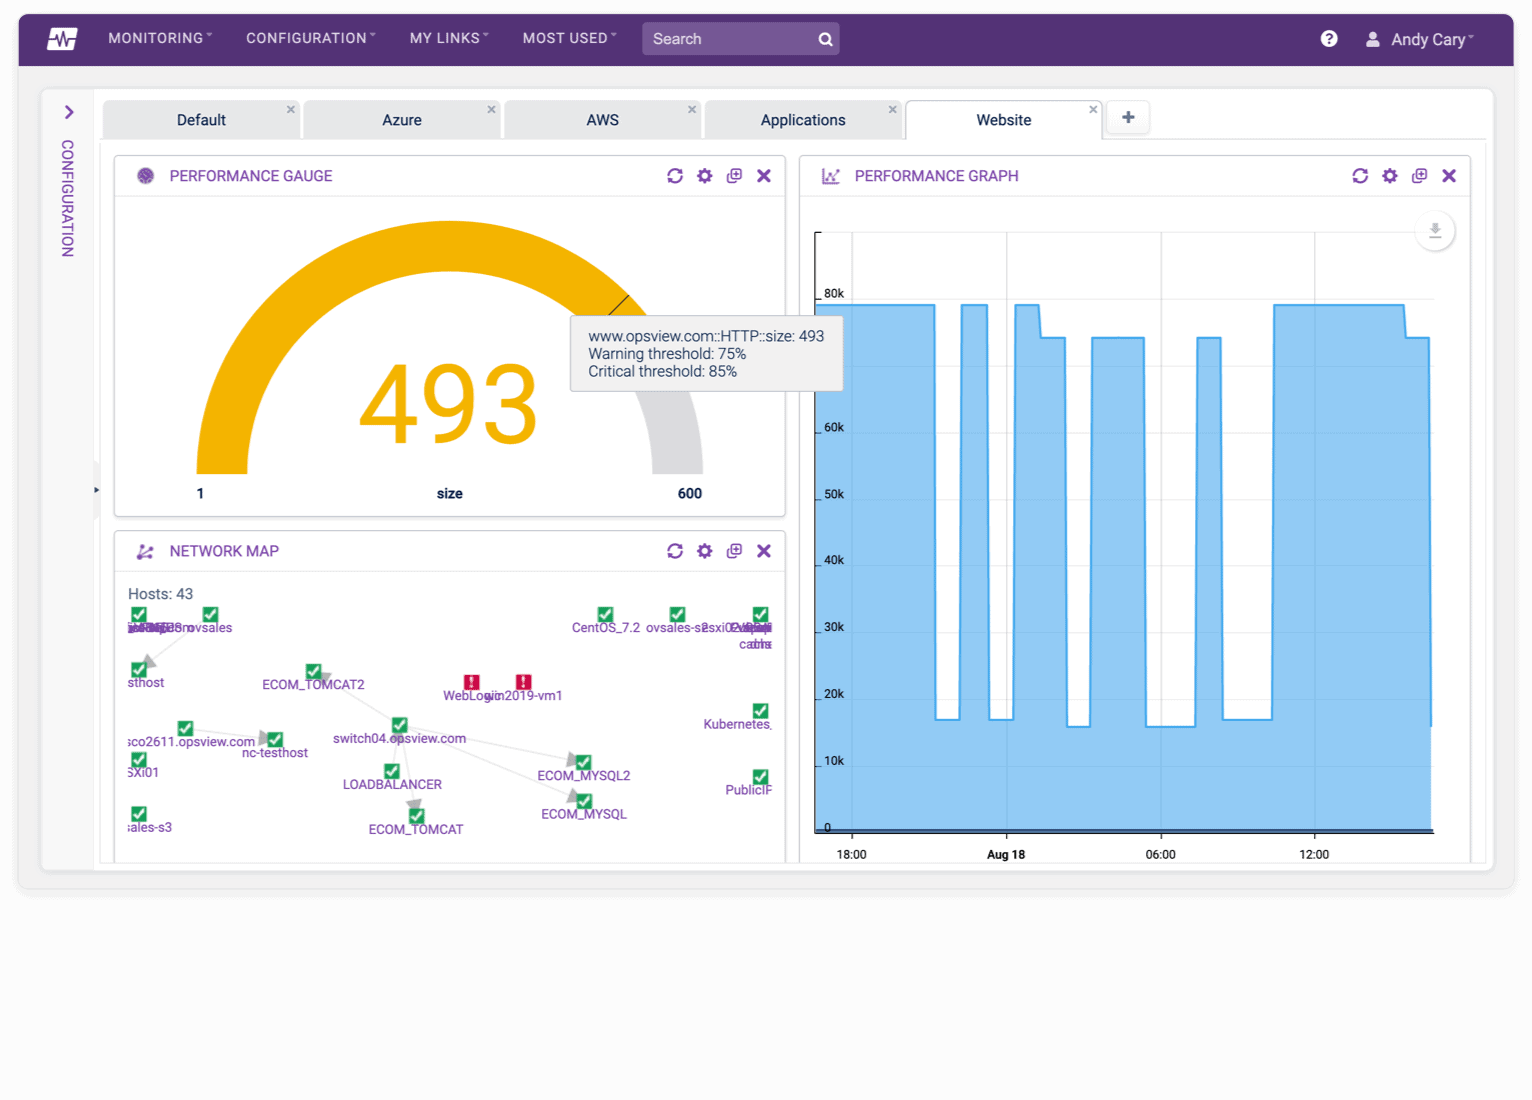
OpsView’s database monitoring tools are designed to provide unified database monitoring across your entire infrastructure that could include both on-premise and cloud systems. It is a comprehensive tool that analyzes all aspects of your database to give the insights you need in real-time.
Key Features:
- Business Service Monitoring: Provides clear visibility into the IT infrastructure and monitoring services
- Plugin Support: Comes with 4500+ plugins that help businesses keep a close eye on IT infrastructure, cloud services, databases, and applications
- Easy Integration: Facilitates effortless two-way interaction and workflow in case your company already has ticketing, alerting, and analytics systems in place.
- Customer Support: Professional team to look after customer queries and requirements
Why do we recommend it?
From Oracle and Microsoft SQL to cloud databases like AWS DynamoDB, OpsView provides a unified monitoring solution that supports a wide range of databases. Its comprehensive performance indicators and instant alerting mechanism make it a powerful solution for guaranteeing peak database performance.
OpsView monitors the following databases:
- Oracle
- IBM DB2
- MySQL
- Microsoft SQL
- Amazon RDS
- InfluxDB
- PostgreSQL
- Azure SQL
- Google Cloud MySQL
- AWS DynamoDB
- Etcd
- LDAP
- MongoDB
Who is it recommended for?
Businesses with a hybrid IT infrastructure—one that combines on-premise and cloud databases—will find it a great product. Additionally, database managers and IT administrators who require strong reporting features and real-time monitoring to oversee multi-database setups may also find it useful.
Pros:
- Real-Time Monitoring: Tracks databases in real time and ascertains the precise impact that their hybrid IT architecture and app performance have on the distribution of services.
- Cost Reduction: Manages network analysis on its own which eventually cuts manpower cost
- Alert Option: Instantly notifies the team members of notices and issues in the database system
- Integration Support: Ensures the tool integrates well with new or existing business applications to extend their functionality
Cons:
- Needs Improvement: there are certain areas that require attention and improvement, i.e., cloud monitoring packs
There are two OpsView plans, and they are:
- OpsView Cloud – Ideal for MSPs as it starts at 150 hosts and can scale up to 50,000+ hosts
- Enterprise – Ideal for organizations that want to deploy on-premises. It starts at 300 hosts and scales up to 50,000+ hosts.
Reach out to the sales team for pricing. Click here for a free trial.
8. dbWatch
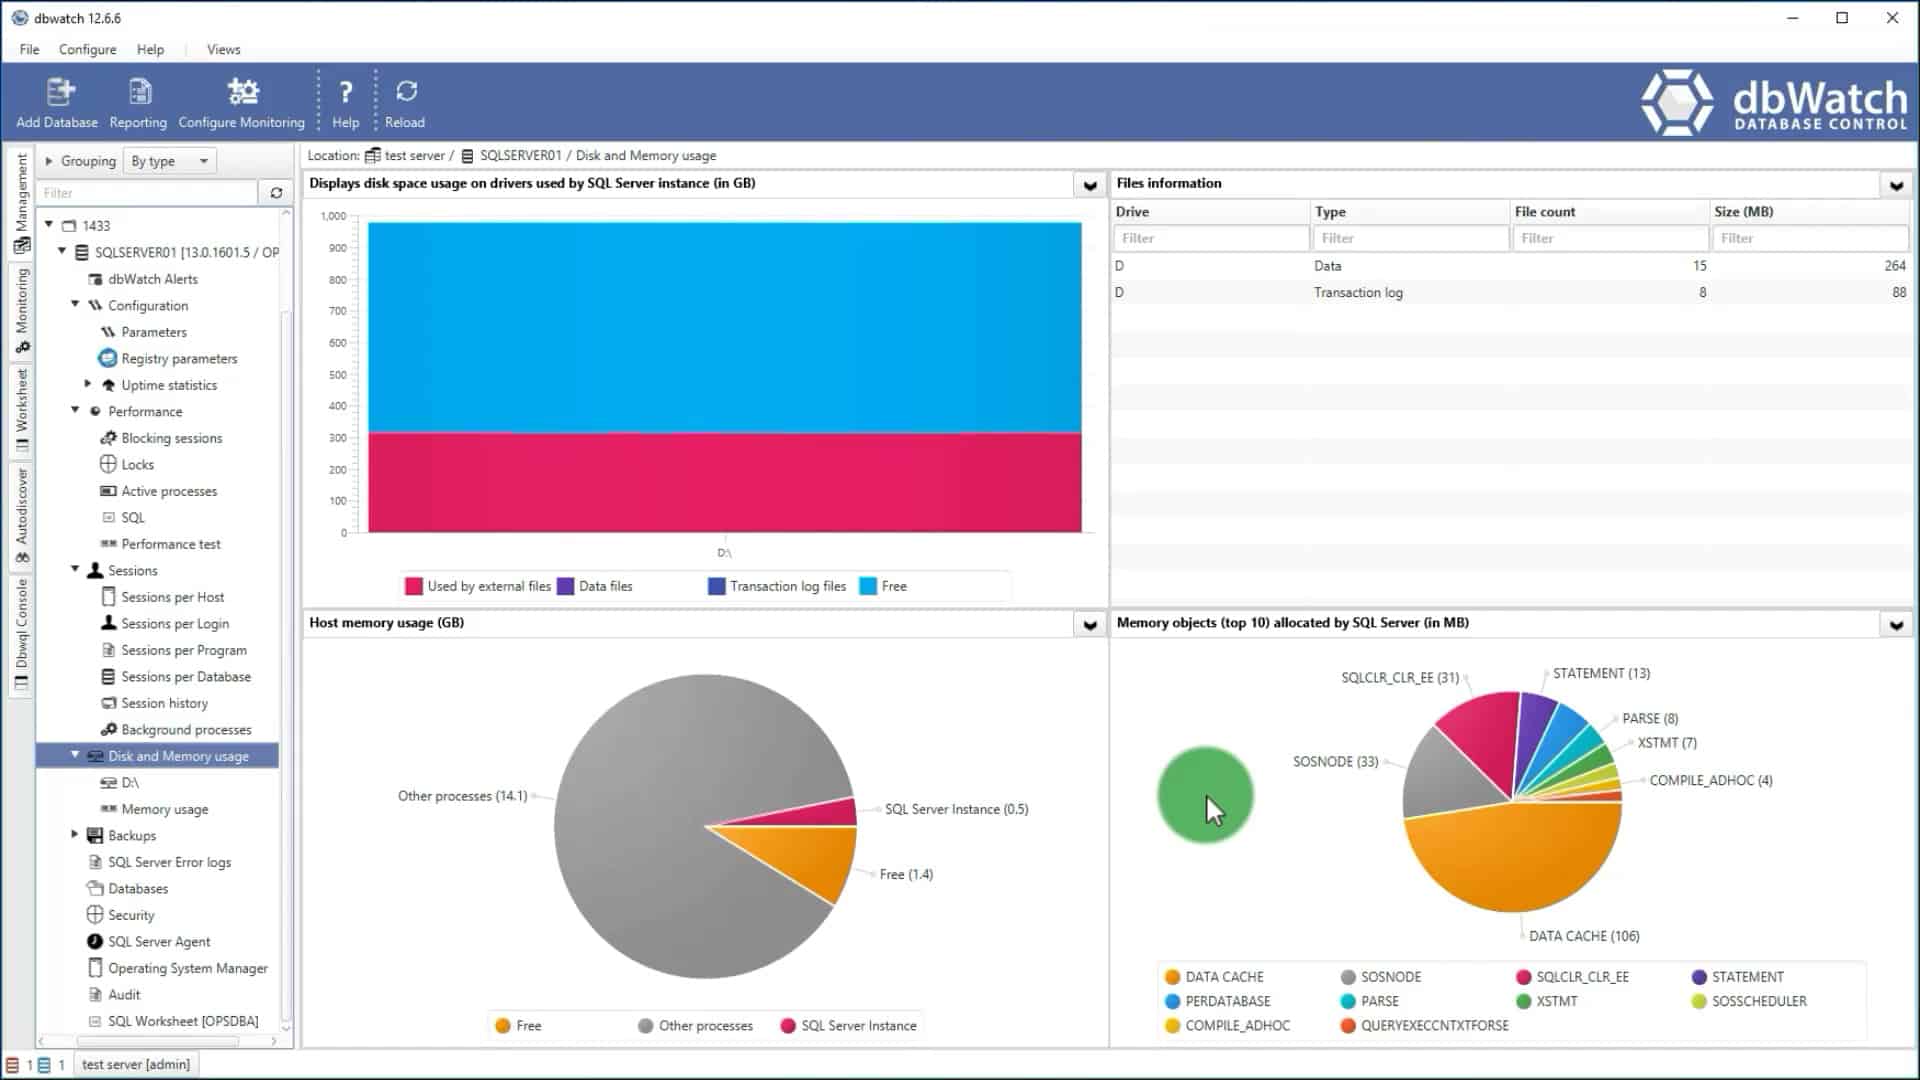
dbWatch is an advanced database monitoring tool that helps you stay on top of the performance of all your databases and sends notifications in real time to alert you to any specific operation.
Key Features:
- Multi-Platform Monitoring: Monitors multiple platforms like physical or cloud as well as databases including SQL server, MariaDB, MySQL, and more from a single console
- Historical Data: Uses historical data and information for future reference and analysis
- Reduce Cost: Manages expenses by automating routine monitoring tasks or optimizing resource usage
Why do we recommend it?
With the dbWatch Database Control system, users can manage and monitor multiple database types and their performance, regardless of the fact that they are running on-premises or on the cloud. Additionally, it helps you stay ahead when it comes to database maintenance by sending real-time notifications and proactive risk management solutions.
Who is it recommended for?
Organizations with large data centers might find it ideal for it offers automated routine monitoring and other capabilities. However, it might not be a perfect solution for small businesses because it demands a minimum license requirement of 10 databases.
Pros:
- Scalable: Users can track the status, performance, and resources of Oracle and SQL servers using this scalable solution
- Monitor from Anywhere: Users can constantly track their SQL servers from anywhere without any hassle
- Domain Connection: Enables simultaneous connections to multiple active dbWatch domains
Cons:
- Complexity: The configuration process is a bit complex and demands expertise for proper implementation
There are two editions offered by dbWatch.
- Enterprise edition – $490/instance and a minimum of 10 instances
- dbWatch Control Center – $550/instance and a minimum of 10 instances
The above licensing cost is for a year. Click here for a free trial.
9. AimBetter
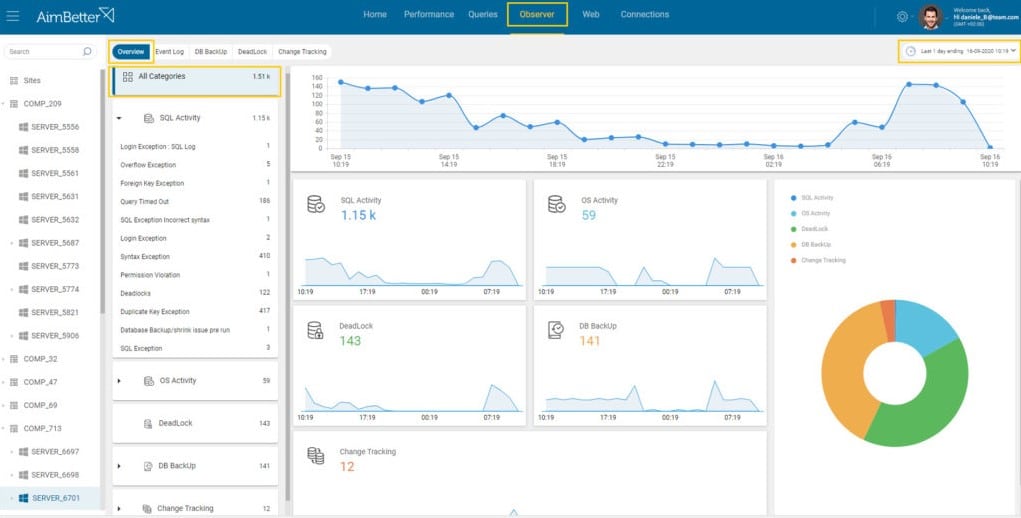
AimBetter is a cloud-based provider that provides automated monitoring tools plus the services of a team of database experts that you can step up into a fully managed service. The system reaches across the internet to liaise with a local agent program that constantly gathers access and performance data on each database instance.
Key Features:
- Real-Time Problem Solving: Automatically identifies the root cause of the problem and performs analysis
- Quick Installation: Fast to complete the installation process and generate quality results
- Zero-Trust Data Protection: Secures and shields IT needs with strict security policies and compliance
Why do we recommend it?
AimBetter is an integrated database monitoring solution that combines a special combination of automated monitoring techniques with the knowledge of a dedicated group of professionals. With over 400 metrics and a year of data retention, it is excellent for troubleshooting and performance analysis.
Who is it recommended for?
AimBetter is a remote management service useful for companies that mostly use SQL Server, Oracle, and SAP. It is an ideal solution not only for businesses that demand automated database monitoring but expert advice and managed services as well.
Pros:
- Unified Dashboard: View database queries quickly and comprehensively from a single screen
- Historical Data: Keeps your historical data safe for up to one year for future reference and analysis
- Metrics Analysis: Allows 300+ system metrics monitoring for both server and database level
Cons:
- Support Feature: Unlike other tools, it does not offer any live support option
- No On-Premises: Does not support the on-premises version
AimBetter has a flexible pricing model that is based on your database requirements which assures you won’t be paying for modules and extras that you don’t use or need. This is a cloud service, so you sign up for the service rather than downloading a package. You can request a free trial.
10. SQL Power Tools
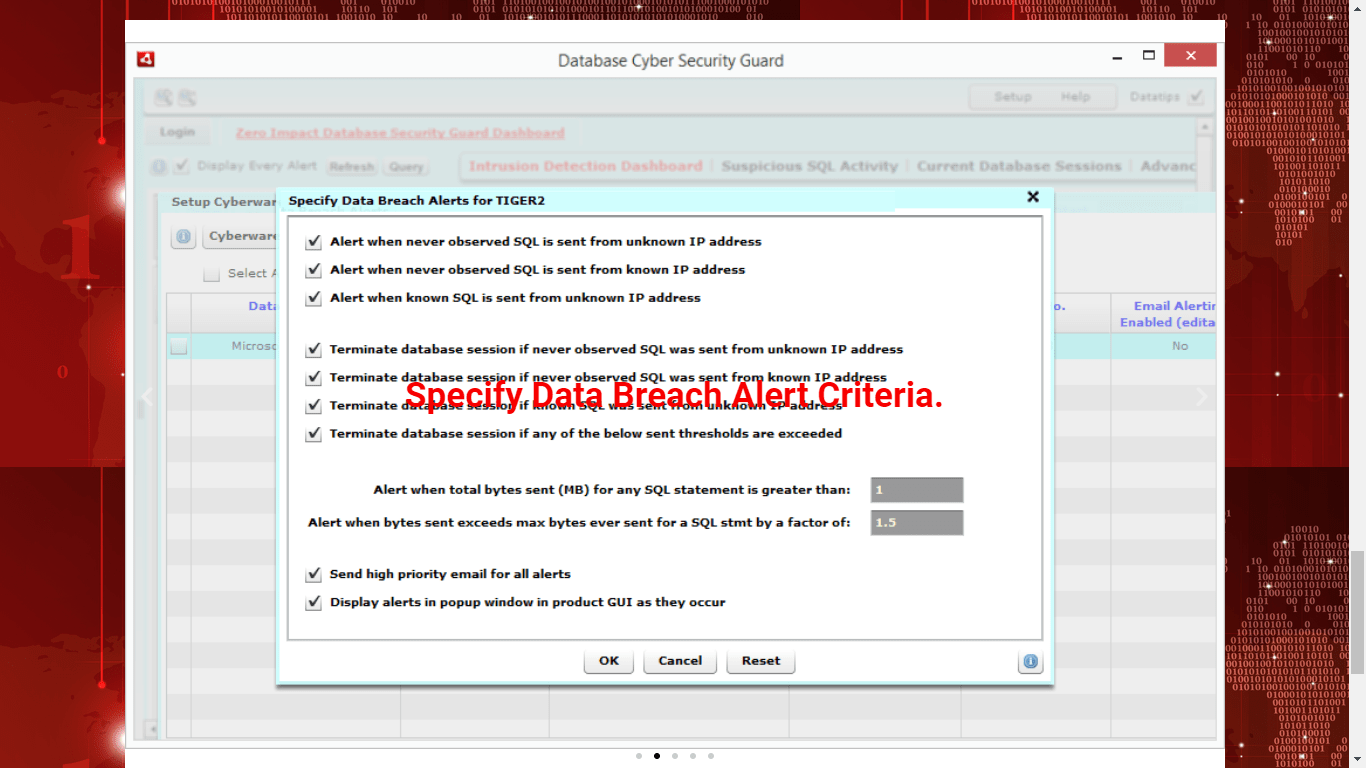
SQL Power Tools is an intelligent and robust solution that analyzes all SQL queries 24/7 to ensure that your database is safe at all times. Plus, it is a zero-impact database monitoring solution that significantly adds to its overall credibility.
Key Features:
- Performance Logging: Closely watch over multiple database instances at the same time
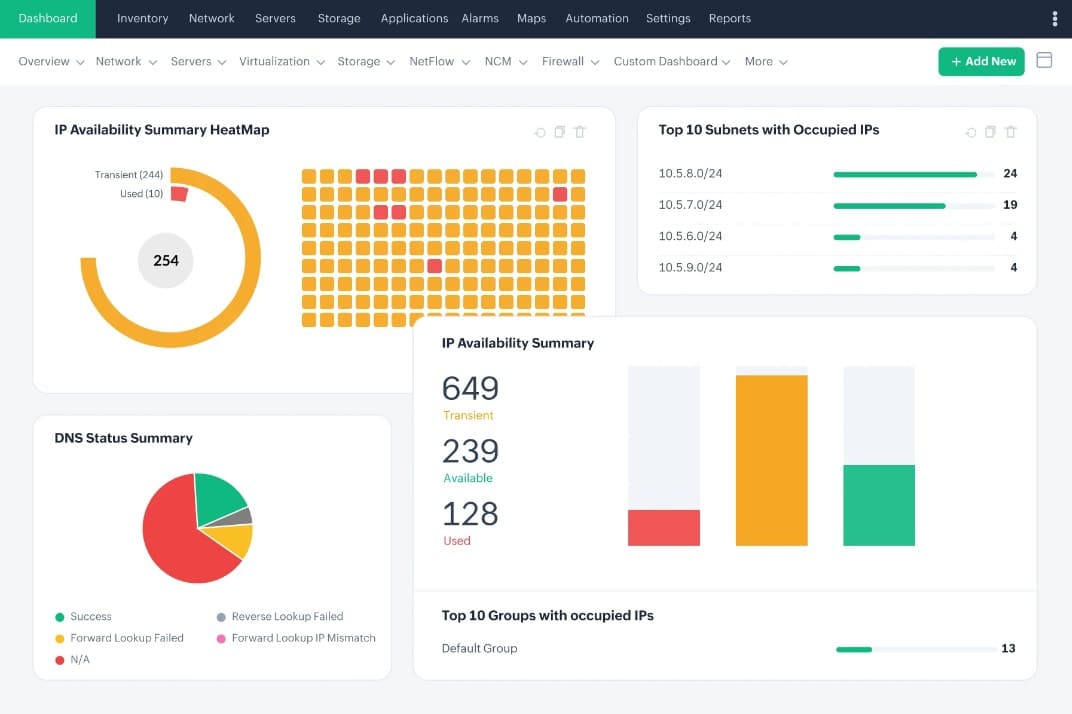
- Heatmaps: Evaluates the overall database performance using the dashboard and heatmaps settings
- Alert System: Notifies admins immediately on noticing the degradation in the SQL response time or any other issues via email
Why do we recommend it?
With its zero-impact monitoring and strong SQL query analysis available around the clock, SQL Power Tools is a very reliable option for database security and performance. In today’s digital world, its real-time analytics and capacity to recognize and neutralize security risks provide an extra layer of security that is priceless.
Who is it recommended for?
This utility is an on-premises package that may be used with cloud, Linux, Unix, and Windows operating systems. The program would only be of interest to large organizations because it only monitors databases, while SMBs desire a comprehensive package for system monitoring.
Pros:
- DBMS Monitoring: Watch over multiple types of databases including Oracle, MariaDB, MySQL, etc.
- Security Monitoring: Constantly tracks the activity and behavior for security purposes
- Less Impact: Instead of keeping track of database activities, it reads network traffic
Cons:
- Detailed Solution: Learning and understanding this tool and its features may take some time for users as it is a detailed platform
- Only Supports SQL: Other than SQL, the tool does not support other applications
Contact the sales team for a custom quote. Click here for a free trial.
Conclusion
To conclude, database monitoring tools are an essential part of your IT toolkit as they stay on top of the health and performance of your databases at all times. Also, their constant monitoring ensures that even the smallest of anomalies are detected, so they can be fixed before it impacts the larger organization or the end-users. Some of them even come with advanced tools for online security.
The tools we have described in this article are some of the most comprehensive database monitoring tools available on the market today. We hope you can zero in on the tool that best fits your needs.
