

Every tool and platform in your infrastructure must not only integrate well within your overall business requirements but must also add value to your operations. A good way to measure this value is to assess its performance against a set of established Key Performance Indicators (KPIs).
Here is our list of the best Cacti monitoring alternatives:
- Progress WhatsUp Gold – Best for IT teams needing multi-environment visibility and smart alerts
- SolarWinds NPM – Best for medium to large enterprises needing detailed path and performance analysis
- Zabbix – Best for enterprises wanting open-source, customizable multi-vendor monitoring
There are many tools available today to measure the actual performance against established KPIs to understand deviations and their causes. A popular choice is to use tools that gather data about a device or application and represent it in the form of graphs and charts for easy understanding.
One such tool is Cacti, a performance and fault management framework that stores information in a Time Series Database (TSDB) and creates performance graphs and charts based on it. Cacti is a LAMP (Linux, Apache, MySQL, and PHP) stack web application and over the years has evolved to work well on Windows as well.
While Cacti is widely-used across industries, it still comes with a bunch of shortcomings such as an elaborate configuration process that can be ridden with errors, difficulty in changing the configuration and managing change, difficulty in installing plugins, and more. This is why it merits to look at Cacti alternatives before deciding the appropriate tool for your business needs.
Let’s now take a detailed look at the features of each of these tools.
The Best Cacti Monitoring Alternatives
Methodology for Selecting the Best Cacti Monitoring Alternatives
When choosing the best Cacti Monitoring Alternatives, make sure to go through the below-listed pointers:
- Check if your selected tool can monitor multiple vendors
- Does it offer a critical path visualization feature?
- Can you customize your alerts and notify them in real-time?
- Does it offer autodiscovery or automatic network topology map creation functionalities?
1. ManageEngine OpManager – FREE TRIAL
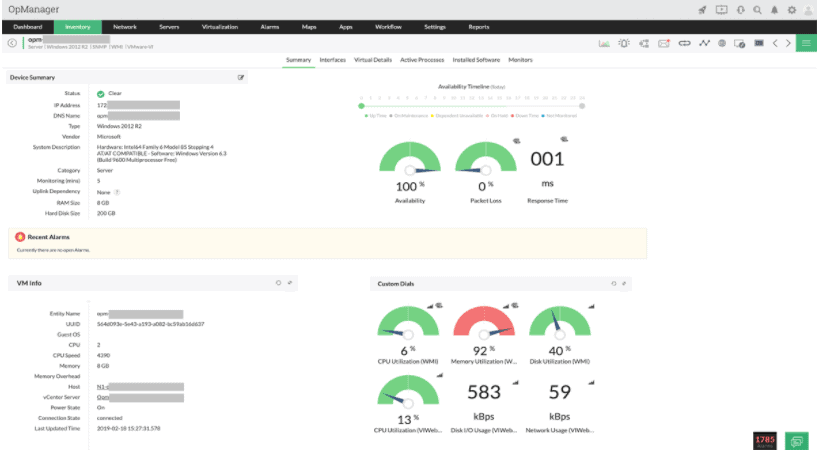
ManageEngine OpManager is an end-to-end monitoring solution that provides in-depth visibility into the availability and performance of critical resources such as servers, WAN devices, switches, and more by continuously monitoring their critical parameters.
Key Features
The features of OpManager are as follows.
- Live Monitoring OpManager monitors some critical parameters such as memory, bandwidth, and CPU utilization in real-time to help identify the root cause of network latency and performance degradation issues. It gathers all this information and presents it to you in the form of reports and intuitive dashboards. Based on these details, you can identify the root cause and troubleshoot quickly.
- Tracks Database Servers This tool’s comprehensive database monitoring capabilities track the health, availability, and performance of critical database servers. Using this information, you can do a gap analysis to proactively address issues before they impact your infrastructure.
- Manages Configurations OpManager stays on top of configurations and sends instant alerts when any critical changes are made to them. This helps to identify insider attacks at the earliest.
- Generates Reports OpManager generates detailed reports that can not only provide a visual representation of the situation but can also help with auditing and compliance to industry standards. Furthermore, it can also help the decision-makers to decide on capacity planning, resource utilization, and other aspects.
Why do we recommend it?
OpManager excels in providing real-time monitoring of critical parameters like memory, bandwidth, and CPU utilization. Its capabilities extend to thorough database server tracking and instant alerts for configuration changes, making it a go-to solution for both proactive and reactive network management.
In all, these are the features of OpManager and as you can see, it is comprehensive and covers all areas of operations.
Who is it recommended for?
OpManager is recommended for organizations that need continuous and in-depth monitoring of their critical resources such as servers, WAN devices, and switches. Its robust reporting features make it an excellent tool for compliance and auditing, making it suitable for businesses that have to adhere to industry standards and regulations.
Pros:
- Helps discover the underlying cause of network latency and performance degradation by monitoring a few critical parameters
- Allows monitoring of the efficiency, availability, and health of crucial database servers
- Automatically sends alerts on noticing any critical changes
- Generates detailed reports for auditing and analysis
- Uses insights to determine capacity planning and manage resource utilization
Cons:
- Topology-based models need attention
- Updating to a newer version frequently causes issues
For the pricing, register fro a quote and a 30-day free trial.
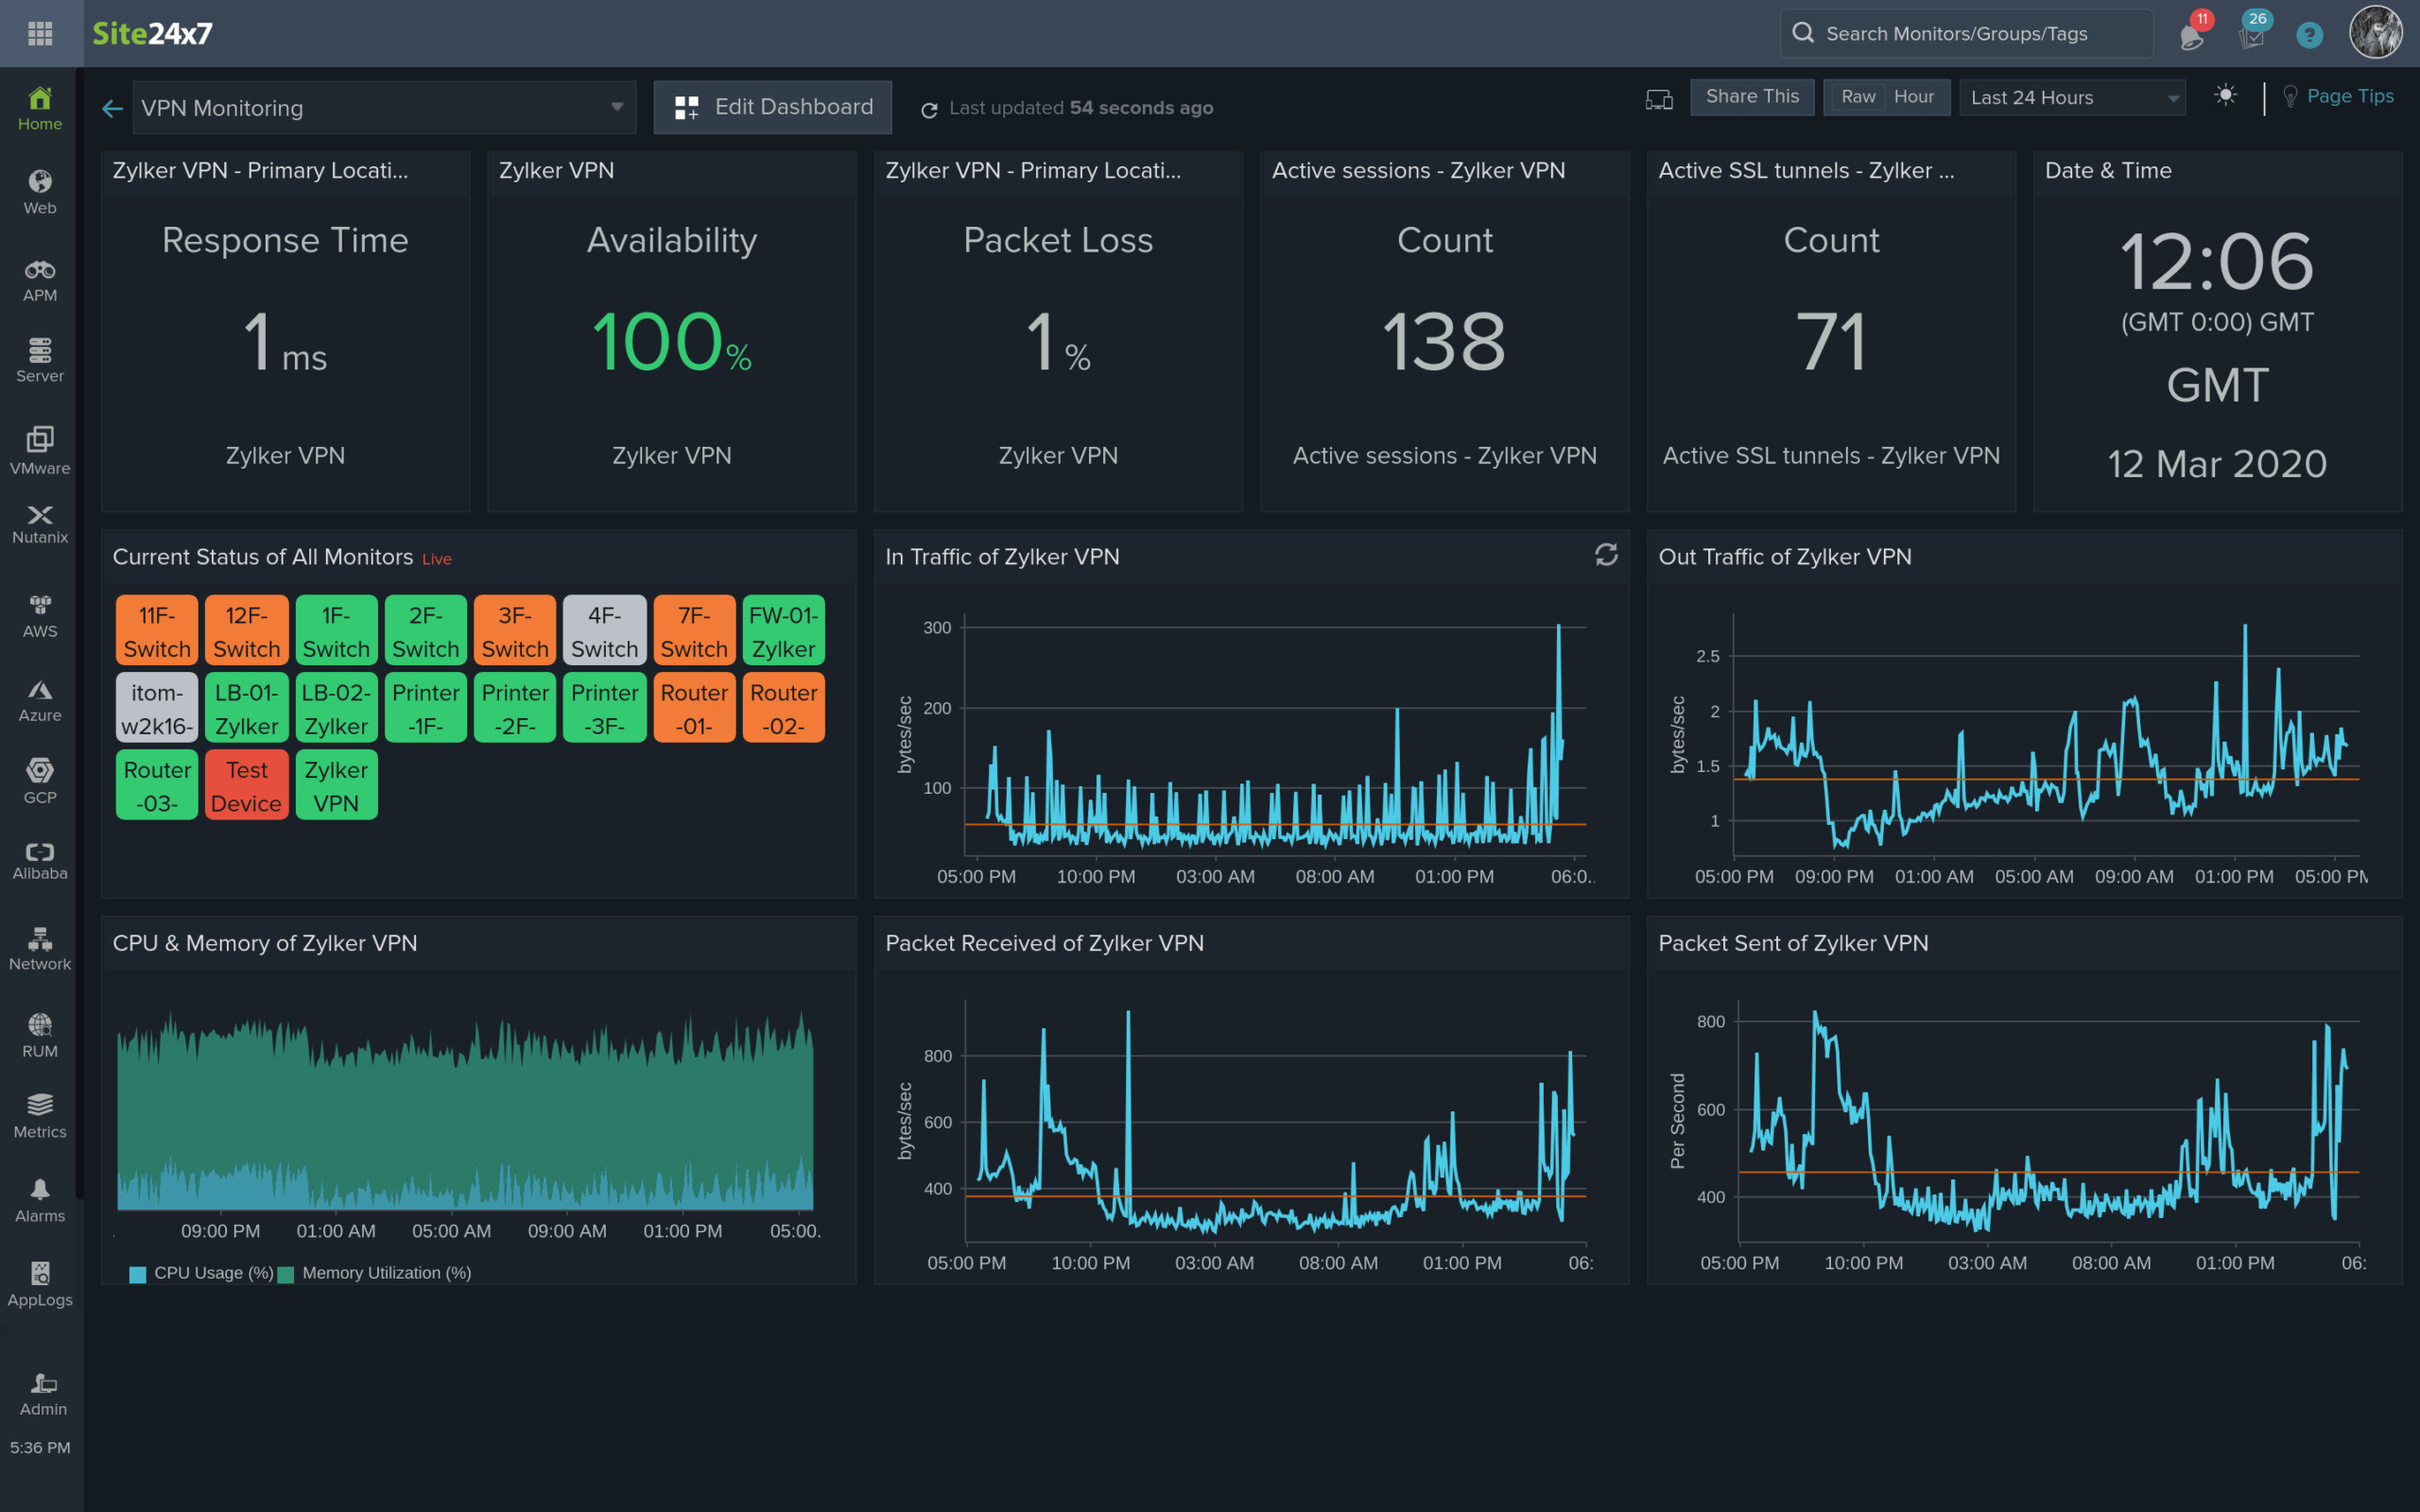
2. Site24x7 Network Monitoring – FREE TRIAL
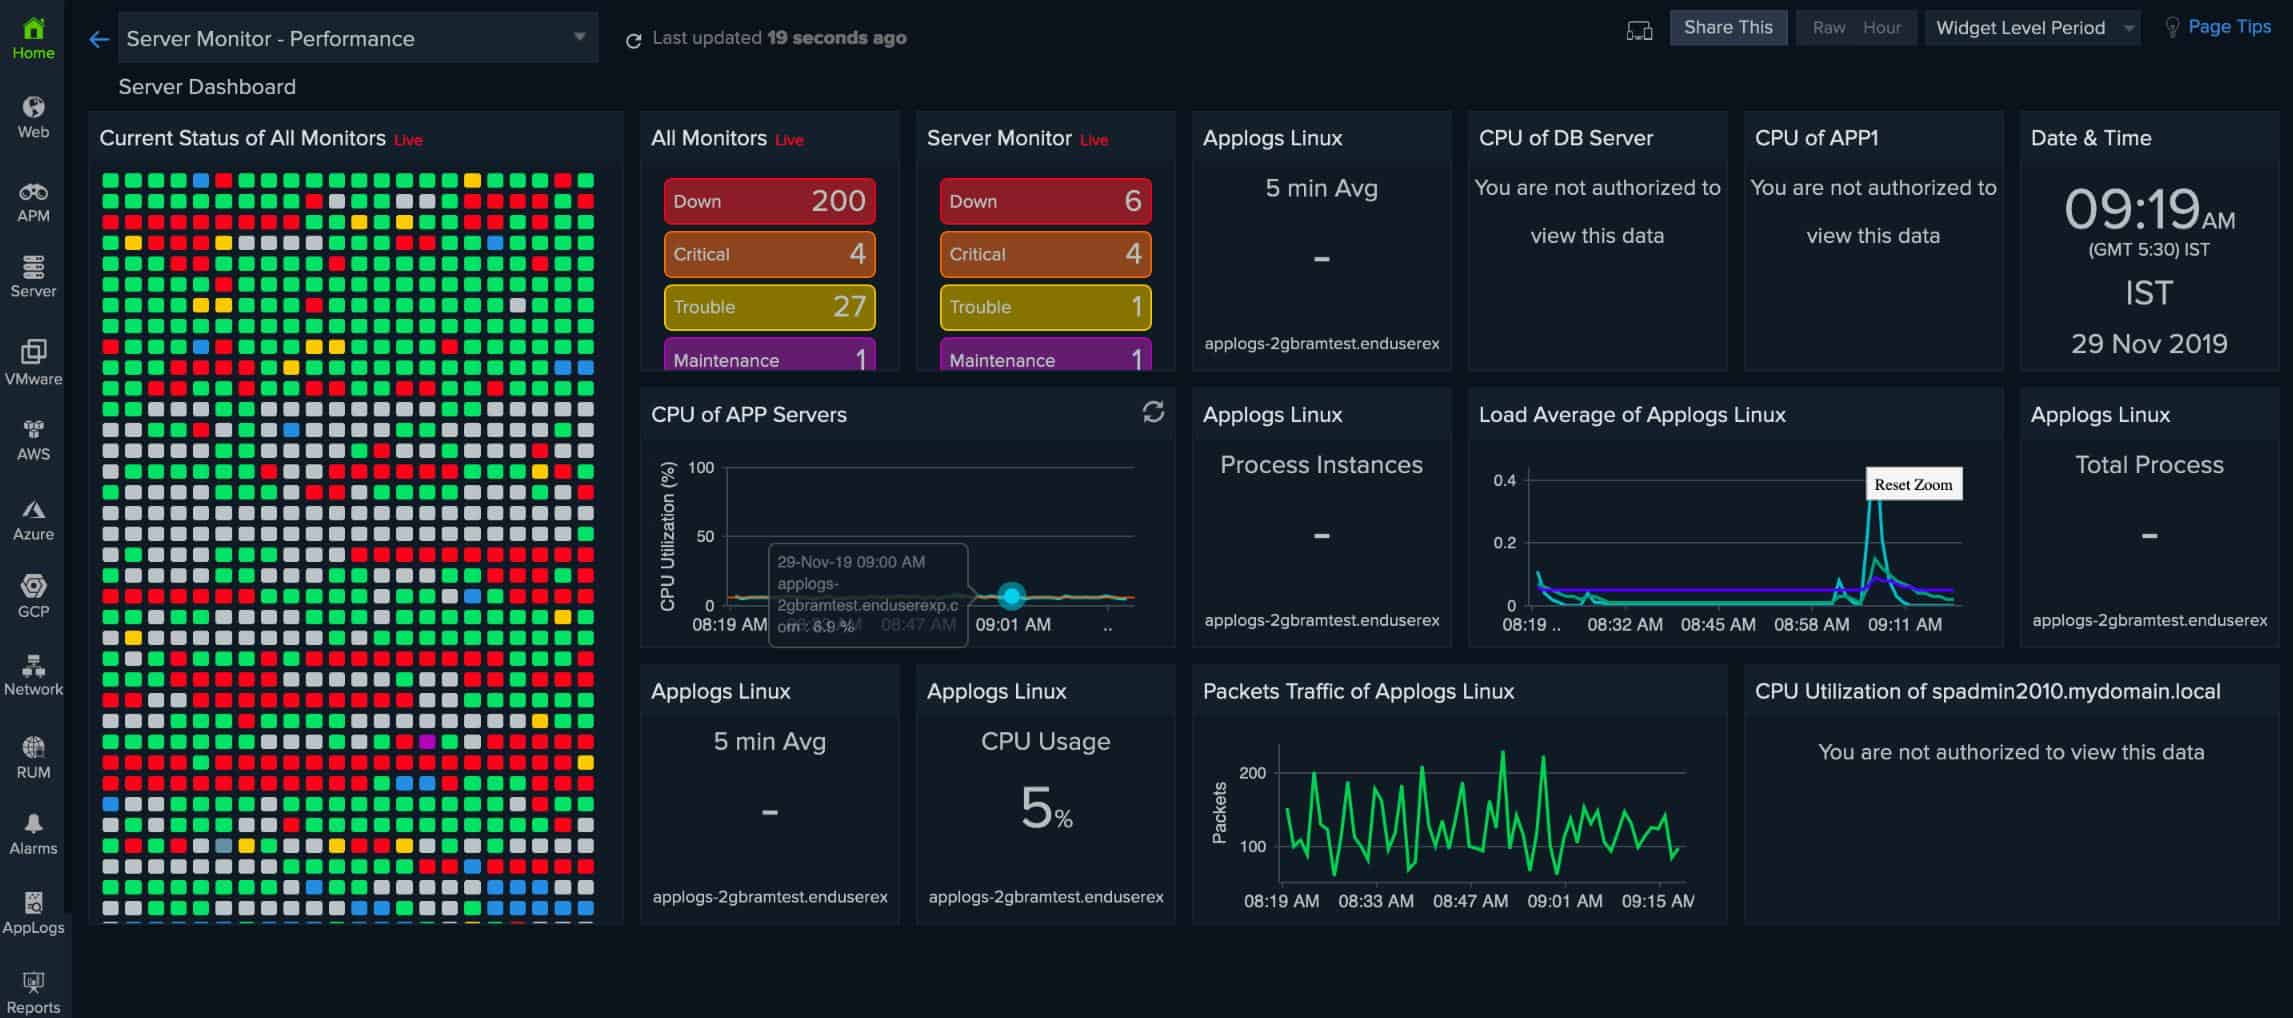
Site24x7 Network Monitoring provides network discovery, topology mapping, and continuous monitoring through SNMP. The package is also able to extract traffic statistics from network devices by using NetFlow, J-Flow, sFlow, CFlow, IPFIX, NetStream, and AppFlow to extract traffic statistics.
Key Features
- Network Documentation This package reaches out to your network from its cloud location through the installation of an agent. This acts as an SNMP Manager and polls the network for device responses. These responses enable the Site24x7 system to compile a network inventory and a topology map.
- Continuous Device Monitoring The Site24x7 agent keeps polling the network for device information this provides throughput statistics, CPU and memory capacity and utilization, and interface activity.
- Bandwidth Analysis By sampling the traffic data that routers and switches store, this package is able to identify the capacity of each link on the network. Overloaded switches and routers can be identified, enabling better capacity planning.
- Automated Monitoring The agent collects any SNMP Trap messages sent out by devices to warn of a problem and these become alerts in the Site24x7 system. The server also calculates its own alerts based on performance impairment or capacity shortages.
- Network Configuration Management The package scans the configuration of each network device. You can adjust settings through the Site24x7 interface and then store an image. The system prevents unauthorized changes by comparing live configurations to those stored in the library.
- VoIP Quality The network monitoring service provides statistics on throughput for VoIP traffic. You can see whether packet loss or jitter is present and take steps to improve transmission speed and regularity for interactive protocols.
Why do we recommend it?
Site24x7 Network Monitoring excels in providing a holistic view of your network’s health and performance. Its continuous device monitoring, bandwidth analysis, and automated alerts make it a robust tool for preemptive network management.
The Site24x7 system is a lot easier to set up and use than Cacti. An administrator can create individual user accounts for technicians and the console can be accessed from anywhere through any standard Web browser.
Who is it recommended for?
This tool is best suited for businesses that require multi-faceted network monitoring in a multi-vendor environment. Its ease of setup makes it accessible for administrators of varying technical backgrounds, and its cloud-based console means you can monitor your network from anywhere.
Pros:
- Combines device status monitoring and traffic analysis
- Can operate in a multi-vendor environment
- Plans combine network, server, and application monitoring
- Alerts for device component faults
- Alers for traffic issues
Cons:
- No on-premises version
The Site24x7 platform provides many modules and the Network Monitoring unit is just one of them. Rather than subscribing to one module, you sign up for a package of monitoring uniters that cover all IT assets, including Web systems. The cheapest package you can get starts at $9 per month when paid annually. Get a 30-day free trial.
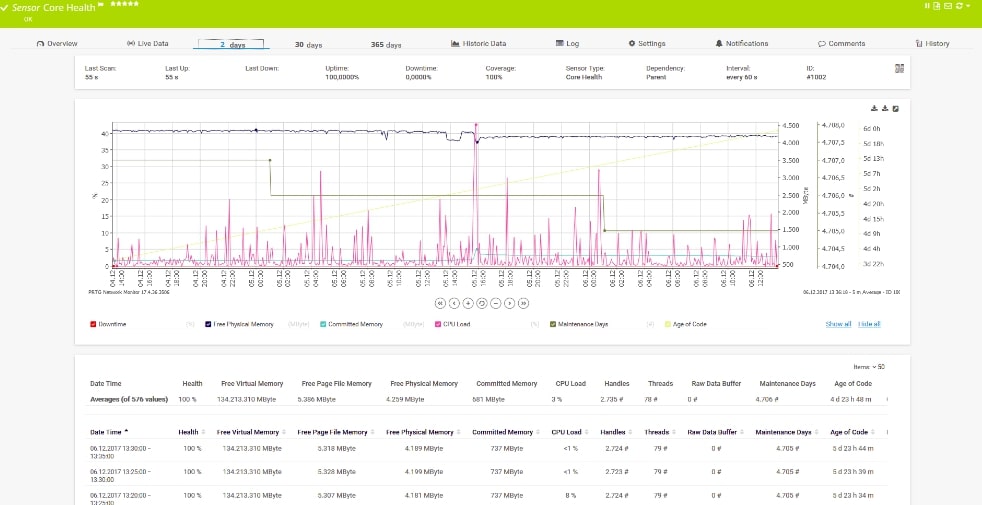
3. PRTG Network Monitor – FREE TRIAL
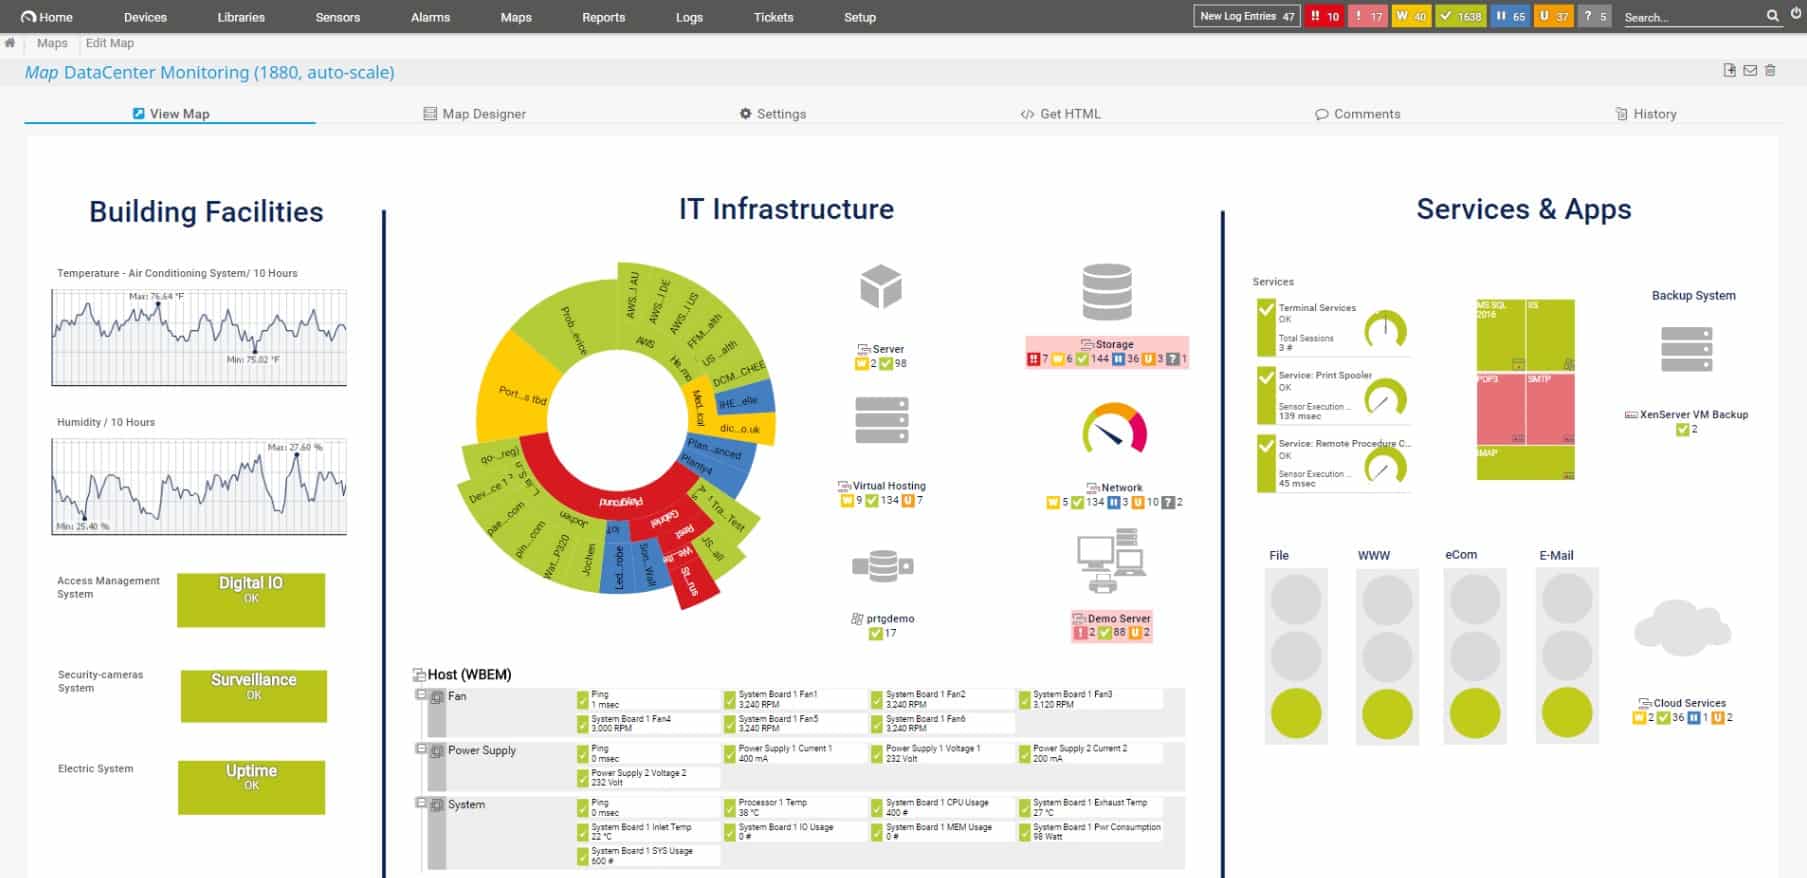
Paessler PRTG Network Monitor from Paessler is a sensor-based monitoring tool that probes the specific aspects of your devices or networks, so you can always stay on top of their performance and availability.
Key Features
Here’s a detailed look at the features of this tool.
- Simple and Extensive One of the highlights of the PRTG Network Monitor is that it is simple to set up and use. Since everything is included in this tool, there is no need for you to download or install additional tools or plugins. The entire process of setting up and usage is also intuitive and straightforward and doesn’t require extensive technical expertise. At the same time, PRTG is also extensive as it can monitor all devices, systems, and traffic in your IT infrastructure, thereby making it ideal for businesses of all sizes and across all industries.
- Sensor-based Monitoring PRTG is a sensor-based monitoring system, where one sensor monitors one aspect of a device. For example, if you want to monitor the bandwidth utilization and memory of a device, you need two sensors, one for each aspect. To monitor bandwidth utilization across three devices, you need three different sensors. PRTG comes with thousands of sensors for monitoring specific aspects of different devices. Some of the aspects you can monitor include bandwidth, database storage capacity, SQL queries, cloud computing metrics, server reliability, and more.
- Wide Support Another important feature of PRTG is that it supports a wide range of technologies such as SNMP, WMI, SSH, flow protocols, packet sniffing, REST APIs that return both XML and JSON, Ping, SQL, HTTP requests, and more.
- Visualizations PRTG generates maps and dashboards that comprise live information, which you can get a quick understanding of your infrastructure’s current state and its underlying problems. It also comes with a PRTG map designer using which you can create custom dashboards. On these dashboards, you can integrate more than 300 different map objects such as devices, status icons, etc. You can even use custom HTML to create maps for easy sharing.
- Alerts You can set up alerts just the way you want. When PRTG identifies an unusual behavior or if the values go below or above an established threshold, you can set up the system to alert you. PRTG has many built-in alerting options such as email, push, and HTTP requests. You can also use its API to write your custom alerts.
Why do we recommend it?
PRTG Network Monitor offers an all-in-one package for diverse and detailed network monitoring. Its sensor-based approach and extensive support for various technologies provide a comprehensive solution for tracking every aspect of your network performance.
Overall, PRTG is a popular choice for monitoring networks and devices, and is undoubtedly a good alternative for Cacti, given its powerful visualization options.
Who is it recommended for?
PRTG is ideal for businesses of all sizes seeking to closely monitor multiple facets of their IT infrastructure. The tool’s ease of setup and use makes it accessible for users with varying technical expertise, and its robust alerting options ensure that administrators are promptly notified of any issues.
Pros:
- You don’t need to acquire or set up any extra plugins or tools
- Thousands of sensors are included in PRTG to track bandwidth usage, SQL queries, server reliability, and other aspects of various devices
- Supports SSH, SNMP, flow protocols, and other technologies
- Allows integrating 300 different map objects on the dashboard
- Set alerts and notify on detecting unusual behavior
Cons:
- Problems arise when you are handling too many Linux computers
- Outdated configuration interface that is not easy to work
Pricing: Since PRTG is a sensor-based monitoring system, the cost depends on the number of sensors you use. The cost is as follows.
- 500 sensors – $1,750
- 1000 sensors – $3,200
- 2500 sensors – $6,500
- 5000 sensors – $11,500
- 10,000+ sensors – $15,500
Start a fully functional 30-day free trial.
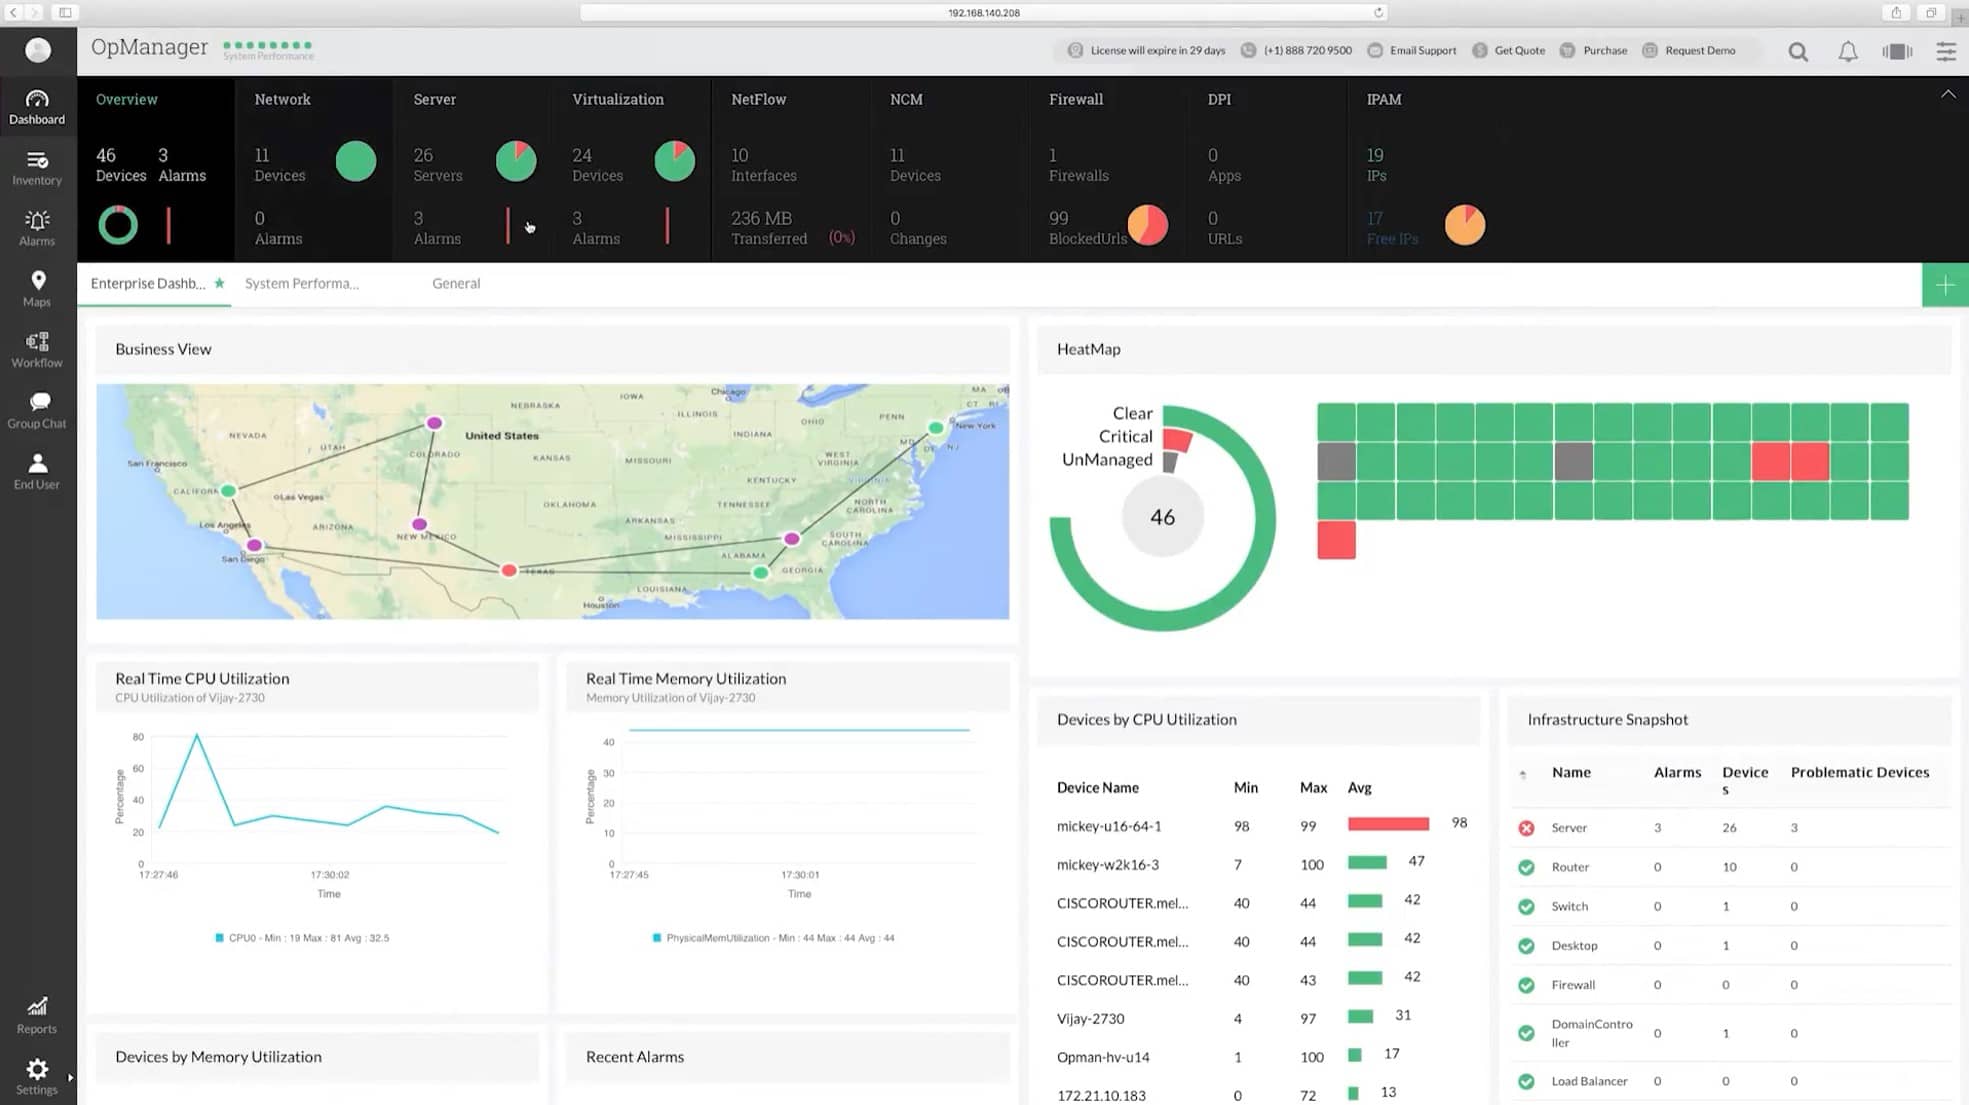
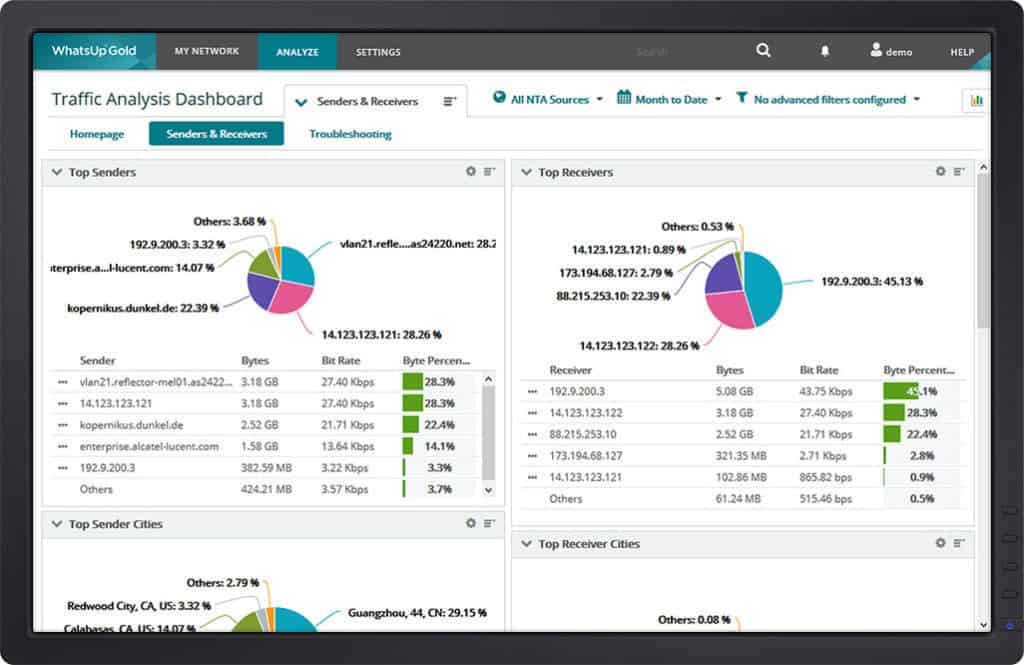
4. Progress WhatsUp Gold
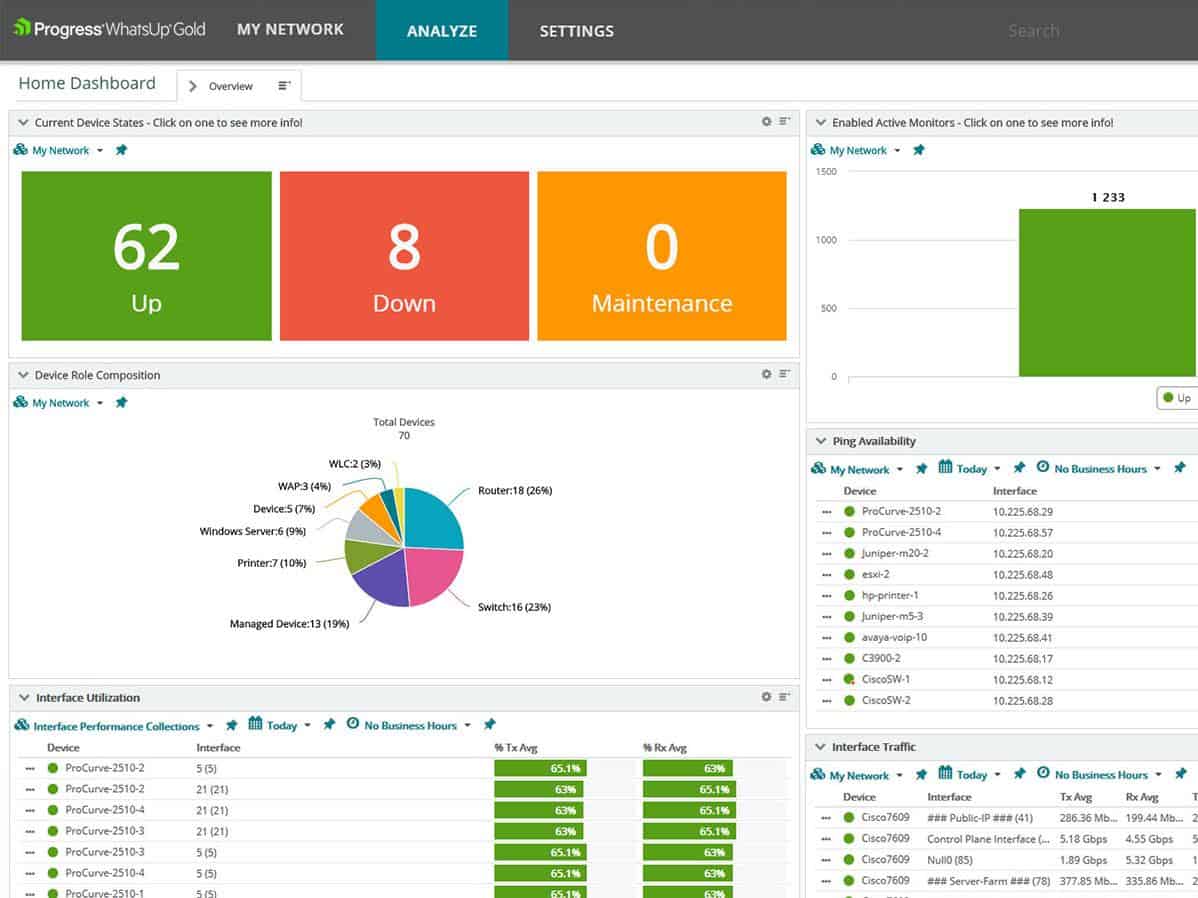
WhatsUp Gold is a multi-environment monitoring tool that provides all the information you need to catch issues and troubleshoot them more efficiently. As a result, the chances for downtime are greatly reduced.
Key Features
Let’s now take a look at some of the features of this tool.
- Complete Visibility WhatsUp Gold provides complete visibility into everything that’s connected to your device. It can monitor devices such as computers, servers, routers, sensors, storage devices, cloud devices, and more. It can also monitor a wide range of applications deployed across environments. It can manage configurations and analyze network traffic as well.
- Smart Alerts This tool provides smart alerts after considering the underlying topology and the related network dependencies, so the chances for false alerts are greatly reduced. You can also set up alerts through SMS, email, Slack, etc., to help fix issues before they impact end-users.
- Maps Dependencies WhatsUp Gold automatically discovers devices, applications, and their dependencies, and creates a map based on them. This map can come in handy for troubleshooting issues and quickly looking at dependencies.
- Custom Dashboards You can customize dashboards to see the data that matter the most to you! This way you can find the information you want quickly and take action accordingly. These dashboards can also be customized for reporting and auditing as well.
- Log Management WhatsUp Gold offers a streamlined log management system that comes with integrated log collection, management, alerting, and archiving. It gives extensive visibility of your devices’ log data and even displays them in a simplified interface for easy understanding.
Why do we recommend it?
WhatsUp Gold stands out for its comprehensive visibility across various devices and applications, along with its smart alerting system that minimizes false alarms. The tool’s capability to automatically map device and application dependencies simplifies troubleshooting and enhances efficiency.
Thus, these are the features of Progress WhatsUp Gold and as you can see, it is extensive and gives all the information you need.
Who is it recommended for?
WhatsUp Gold is best suited for businesses that require an in-depth view of their network’s health across multiple environments. Its custom dashboards and smart alerts make it ideal for IT administrators and teams who are looking to minimize downtime and improve operational efficiency.
Pros:
- Users can monitor devices, manage configurations, and perform analysis on network traffic
- Reduce false alerts and notifications using email, SMS, Slack, etc.
- Users can locate and build a map based on devices, programs, and their dependencies automatically
- You can customize the dashboard for reporting and auditing
- It provides a thorough insight into the log data from your devices
Cons:
- Bandwidth usage is not properly represented graphically
- Less user support communities are present
The cost depends on your requirements, get a custom quote. Click here for a free trial.
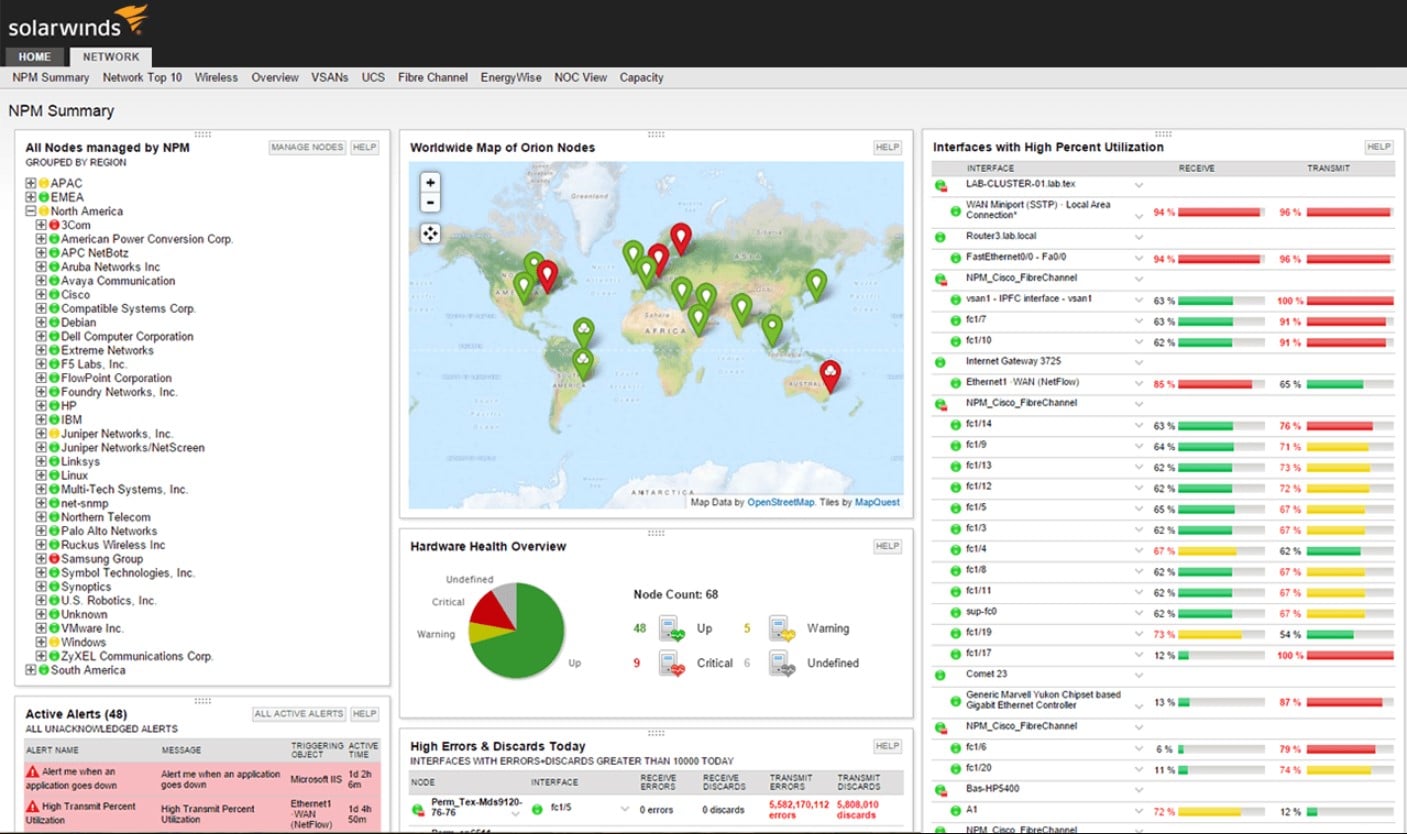
5. SolarWinds Network Performance Monitor (NPM) – FREE TRIAL
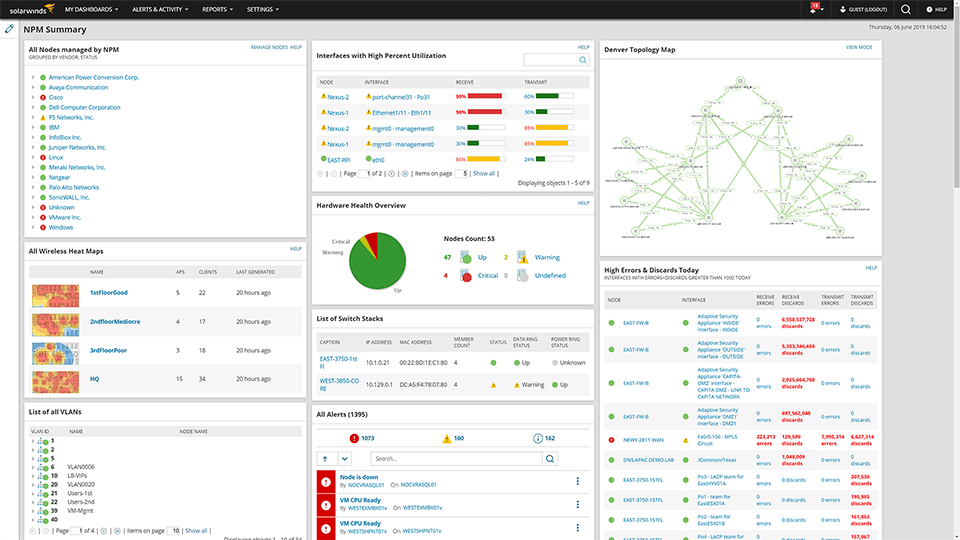
SolarWinds NPM is a comprehensive networking monitoring tool that works well across all devices and platforms. It not only scales well with your growing business but also provides all the in-depth insights you need for effective decision-making.
Key Features
Here is a detailed look at the features of SolarWinds NPM.
- Critical Path Visualization NPM provides a hop-by-hop analysis of the critical paths to understand the impact of every hop on the overall performance and speed of your network. It also maps this information along with a network map for quick visibility and understanding. This feature can be a game-changer for predicting outages and fixing them before they impact the end-users.
- Performance Analysis NPM analyzes the performance of different tools and platforms and the way they interact with the larger network. It comes with the capability to drag and drop metrics from different sources on a single chart to get a comprehensive understanding of the tool’s performance. These charts and graphs can also be shared across teams to facilitate collaboration.
- Custom Maps With NPM, you can create custom maps and visual paths to trace the root cause and troubleshoot faster. It also integrates with Orion Maps to correlate disparate information within your network, so you can get an idea of the bigger picture. These visualizations also highlight any traffic bottlenecks that may exist among the nodes in your network.
- Comprehensive Monitoring NPM is best known for collecting a wide range of metrics across different parts of your network. It gathers this information in great detail and facilitates historical comparison as well. With this information, you can reduce the chances of network downtime and ensure high availability for your employees and end customers. Also, identifying and resolving network issues is easier with the right data provided by NPM.
Why do we recommend it?
SolarWinds NPM offers a comprehensive suite of features that allows for deep insights into network performance. Its capabilities, such as critical path visualization and performance analysis, are essential for effective decision-making and proactive network management.
In all, NPM is a wide-arching service that helps you to make sense of all that is happening within your network, so you can address underlying issues, and make informed decisions.
Who is it recommended for?
This tool is ideal for medium to large enterprises that require detailed network monitoring and performance analysis. Its custom mapping and performance metrics make it a strong choice for network administrators looking for a scalable, in-depth solution to manage and monitor their Cacti environment.
Pros:
- Allows tracking of how each hop affects the network’s overall performance and speed by running a hop-by-hop analysis
- Users can use the drag-and-drop features to bring data from various sources onto a single chart for a better understanding of performance
- Use custom thresholds to determine when the capacity will be reached
- Discover root causes and troubleshoot faster with custom maps and visual paths
- Allows users to run a historical comparison for informed decisions
Cons:
- A more user-friendly interface would be helpful for the Network mapping function
The pricing starts at $1,638, download your SolarWinds Network Performance Monitor (NPM) fully functional 30-day free trial.
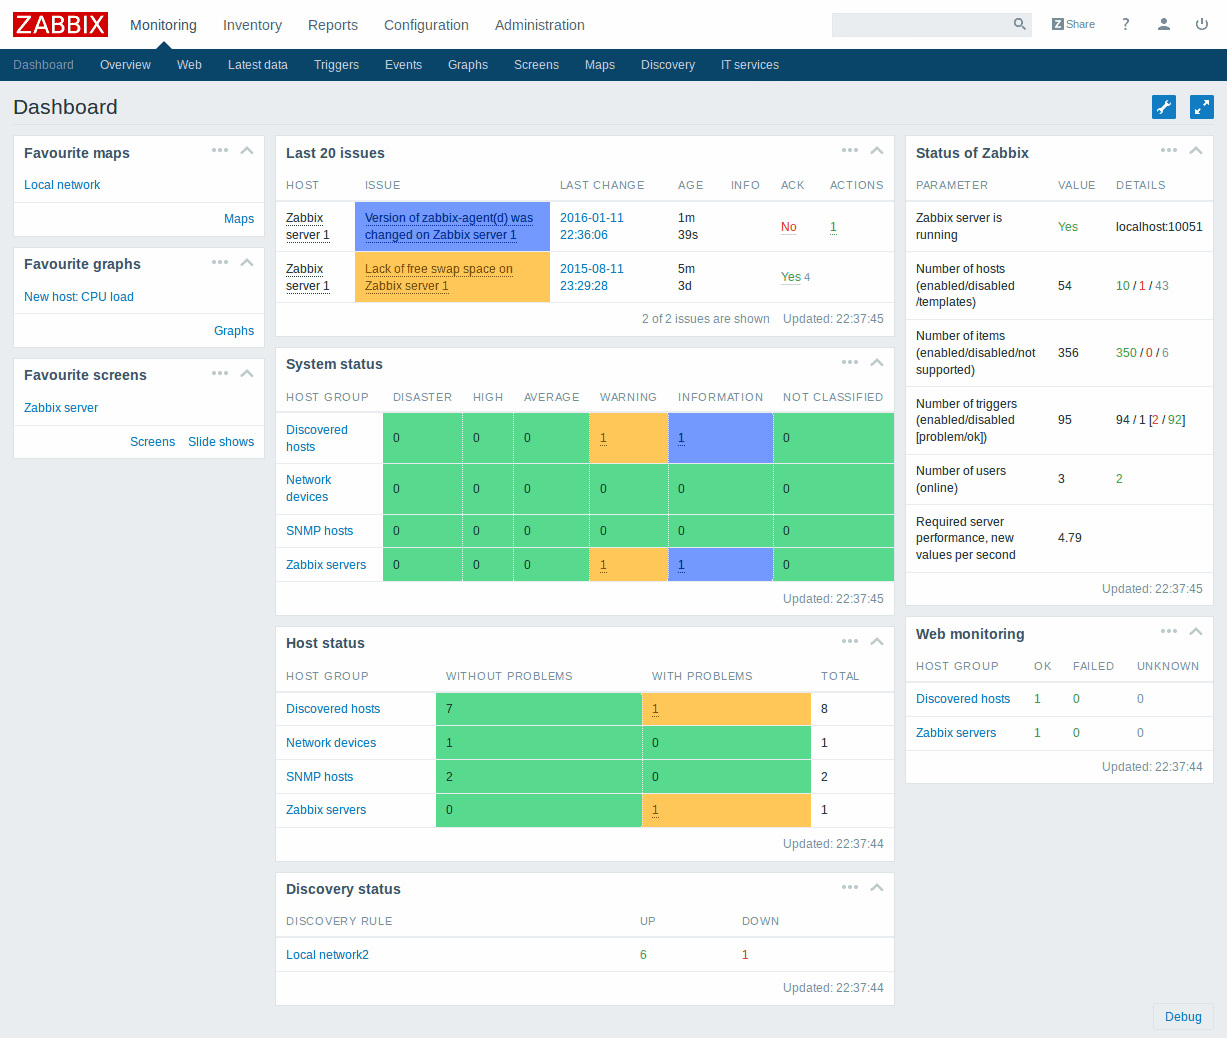
6. Zabbix
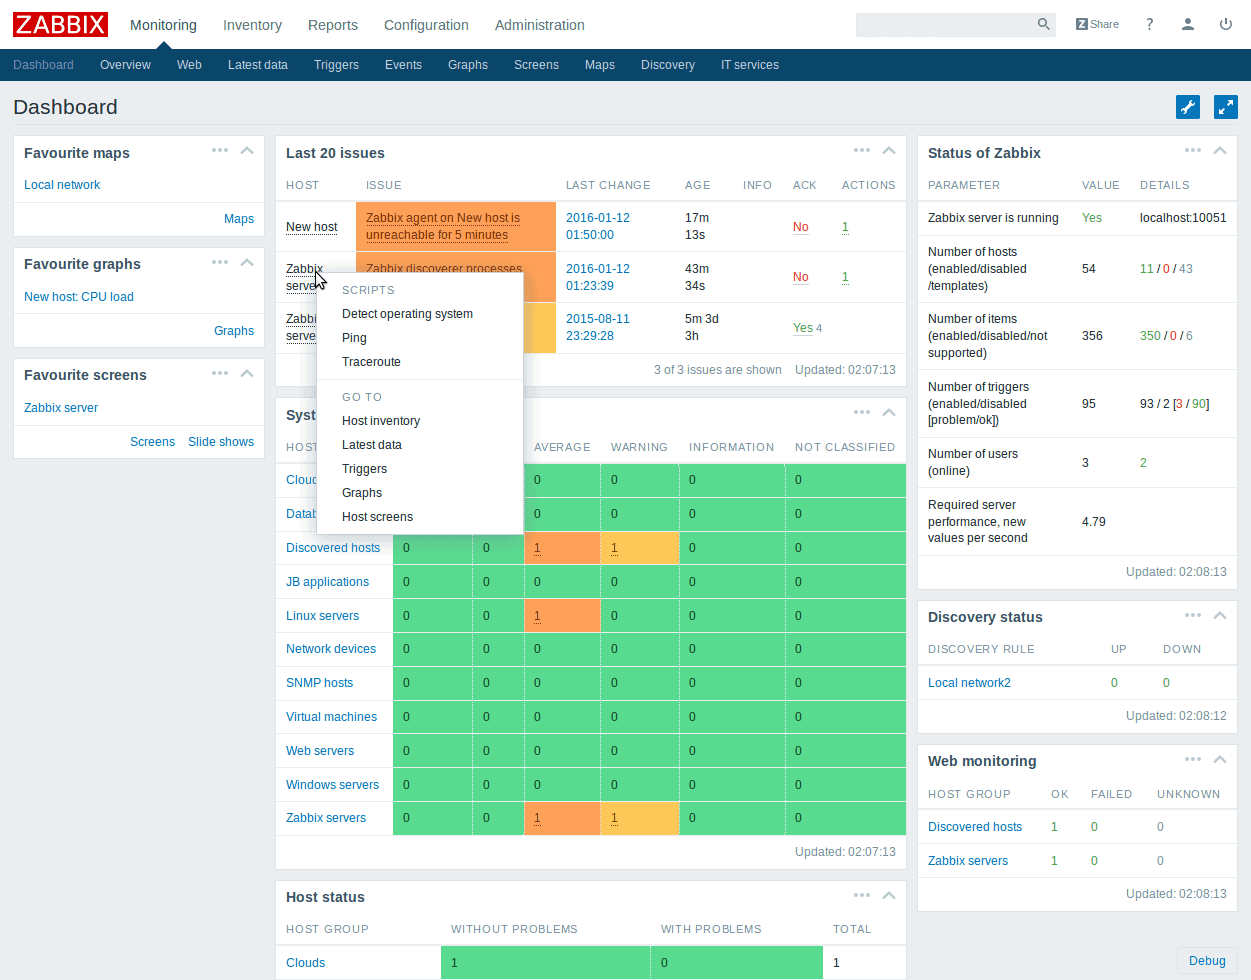
Zabbix is an enterprise-grade monitoring platform that tracks thousands of metrics spread across devices and applications within your network. This open-source tool is highly extensible as well.
Key Features
Here’s a detailed look at Zabbix’s features.
- Collects Metrics Zabbix collects metrics from any device or application. Some source examples include containers, virtual servers, IoT sensors, external API endpoints, log files, databases, applications, and more. It even provides a contextual background by correlating these disparate pieces of information, so you can make sense of them all.
- Advanced Alerting Mechanism Zabbix offers multiple messaging channels to notify anomalies and problems. Depending on your preferences, it can send notifications via third-party tools such as Opsgenie, PagerDuty, VictorOps, and more. This is in addition to regular channels such as email, SMS, communication platforms like Slack, Webhooks, and ITSM tools.
- Widget-based Dashboards Zabbix comes with an advanced web UI for presenting information just the way you want. It allows you to use multiple widgets on the dashboard, drag and drop them to suit your convenience, and more. Your dashboards can be private or public, and you can even have automatic scripts for refresh and for taking specific remedial actions when a particular event occurs. Cloning maps, generating flexible graphs, and creating map hierarchies are some of the other things you can do to better understand the data. Zabbix also supports the use of filters and user permissions for fine granularity and to discern the patterns and trends from data.
- Correlates Data Zabbix is well-known for its ability to correlate the data collected from different sources to identify problems and their root causes. Its advanced algorithms help to pinpoint issues to their correct cause and prevent secondary issues from emanating.
- Seamless Integration Zabbix integrates well with most vendors such as Cisco, HPE, Juniper, IBM, Microsoft, and more. It also works well with existing docker containers, web server backends, databases, operating systems, cloud services, etc.
Why do we recommend it?
Zabbix stands out for its ability to collect and correlate metrics from a diverse range of sources, including IoT sensors, databases, and applications. Its advanced alerting mechanisms and seamless integration with numerous vendors make it an incredibly versatile and reliable enterprise-grade monitoring solution.
In all, Zabbix is an advanced platform for monitoring your systems and generating stunning graphs and charts from the underlying data. Its open-source nature also supports extensibility, so you can customize it to meet your specific requirements.
Who is it recommended for?
Zabbix is ideal for enterprises that require comprehensive monitoring across a complex IT infrastructure. With its ability to integrate well with vendors like Cisco, HPE, and Juniper, it’s particularly well-suited for multi-vendor environments. The tool is also recommended for organizations that need customizable, widget-based dashboards for granular data analysis and reporting.
Pros:
- Collects metrics from several sources, devices, and applications for better analysis
- Alerts about anomalies and issues using multiple messaging channels
- Offers multiple widgets, and drag and drop features, and creates map hierarchies to better understand the data
- Helps pinpoint issues and their root causes
- Offers seamless integration with Cisco, HPE, etc.
Cons:
- Fewer templates are available to run detailed monitoring
- UI/UX that is less comprehensive
For the pricing, click here to talk to a customer representative and here to get started.
Thus, these are the best alternatives to Cacti.
Conclusion
To conclude, Cacti is a monitoring and visualization framework that takes data from the underlying Time Series Database to display them in graphs and charts for easy understanding and assimilation. Though this is an open source that can be extended easily into your environment, it is still limited and doesn’t provide the flexibility that some businesses may need.
That’s why we present a few alternatives to Cacti and they are SolarWinds NPM, PRTG Monitor, ManageEngine OpManager. Zabbix, and Progress WhatsUp Gold. We hope the detailed feature description of each of these tools will help you to pick the appropriate one for your business.
