
Today we’re going to Review the Top MySQL (SQL) Management and Performance Monitoring software and tools that will help you dial in your SQL servers as well as fine tuning their performance and speed.
MySQL is a powerful Open-Source Database Management System that helps companies to run a range of different applications such as websites and ERP storage systems.
Here is our list of the best MySQL Monitors:
- Paessler PRTG MySQL Monitoring – EDITOR’S CHOICE Watches system resource usage and transaction times for MySQL queries. This is part of a wider collection of network, server, and application monitors. Installs on Windows Server. Download a 30-day free trial.
- ManageEngine Application Manager – FREE TRIAL MySQL, SQL Server, PostgreSQL, DB2, Oracle, SAP MaxDB, SAP ASE, MongoDB, and NoSQL databases can all be monitored through this tool. Runs on Windows Server and Linux. Get a 30-day free trial.
- Site24x7 SQL Server Monitoring – FREE TRIAL A monitoring system for networks, servers, and applications includes MySQL monitoring. This is a cloud-based system. Access a 30-day free trial.
- Datadog Database Monitoring This is a function of the Datadog APM, a cloud-based application performance monitoring tool that can supervise Oracle, SQL Server, MySQL, DynamoDB, PostgreSQL, and SAP HANA databases.
- Idera SQL Diagnostic Manager for MySQL A live monitor for MySQL databases that includes extensive database and query performance analysis functions for MySQL databases. Available for Windows, Windows Server, and Linux.
- Nagios XI MySQL Monitoring This monitoring system for networks, servers, and applications watches the resource usage and transaction times of MySQL databases with alerts for performance issues. Installs on Linux.
- SolarWinds Database Performance Analyzer A database monitor that assesses Oracle, SQL Server, and MySQL performance with each query run and checks on database objects to ensure that queries are optimized.
- MySQL Enterprise Monitor Includes SQL query builder, a performance analyzer, and replication monitor. Installs on Windows, Windows Server, Linux, macOS, and FreeBSD.
- Percona Monitoring and Management Tool A free, open-source database management system that advises on query efficiency and security issues. Runs on Docker.
- LogicMonitor MySQL Monitoring This tool monitors query executions and tracks cache and tables space usage to recommend improvements in code and table indexing. This is a cloud-based system.
In fact, a DBMS like MySQL is a critical resource for any organization because of the many crucial tasks it does to keep the applications up and running.
This is why you need MySQL monitoring tools to ensure that your database management system is in good health always.
Related Post: Best Linux Monitoring Software
The Best MySQL Monitoring Software & Tools
Here are a few criteria that you must keep in mind when choosing the best MySQL Monitoring Software:
- Can you perform database instance resource efficiency analysis?
- Can you generate reports highlighting response time for MySQL instances?
- Does it provide recommendations for SQL query optimization?
- Generate insights into all MySQL database instances.
- Does it offer live monitoring of DBMS instance resource usage?
MySQL Monitoring Software and tools make it easy for DB administrators to monitor and fine-tune their databases. Here are some of the best MySQL monitoring software and tools available today.
1. Paessler MySQL Monitoring Tool – FREE TRIAL
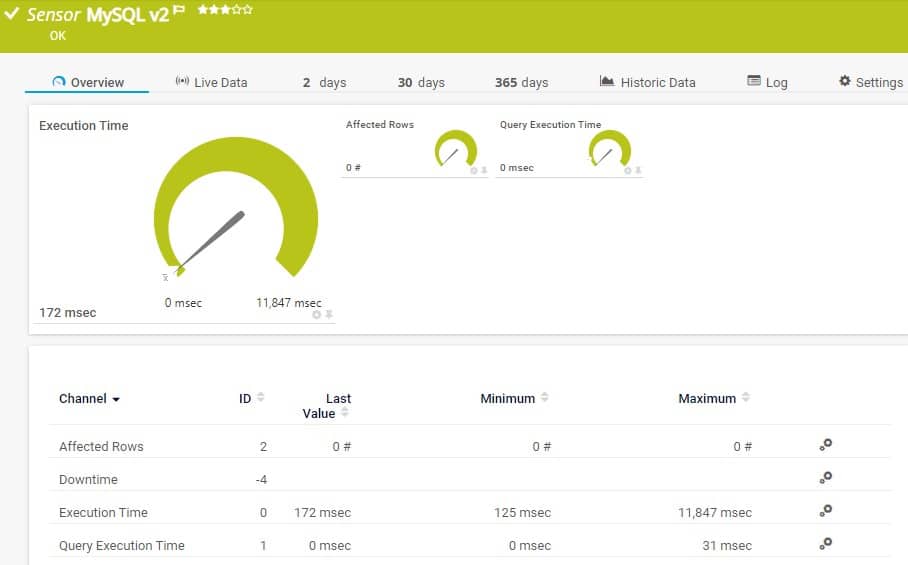
MySQL monitoring tool from PRTG is another comprehensive tool that is ideal for monitoring your MySQL databases. What makes them so ideal is their below-mentioned features.
Key Features
- PRTG keeps a constant eye on the critical MySQL databases to ensure that the downtime is minimal through an array of different sensors and monitoring parameters.
- It sends alerts immediately when any of the performance metric goes below the threshold limits, so you can fix the problem right away. These alerts are sent through emails, SMS and push notifications on your smartphone.
- It also monitors other key metrics that determine the health of your MySQL database. This measures the time taken to establish a connection, speed of execution of SQL queries, handling transactions and more to give you a complete insight into the health of your MySQL databases.
- You can even monitor specific data sets such as data generated on a particular day. To do that, you can define your SQL queries in PRTG tool, and in turn, the tool will monitor their values for you.
- You can set customized threshold values to monitor the performance of your database.
- You can create custom reports and even set a schedule to create report in a particular format. For example, you can ask the tool to create a weekly report every Friday at 5pm that contains the execution time of SQL queries over that week.
Why do we recommend it?
We recommend the Paessler MySQL Monitoring Tool for its real-time monitoring capabilities and diverse alerting mechanisms. It’s particularly strong in tracking performance metrics and offering immediate, multi-channel alerts, ensuring minimal downtime.
System Requirements
The system requirements for this tool depends on the number of sensors you install per core. Here is a table that details the system requirements for each option.
Number of cores |
CPU |
RAM |
Disk space |
| Up to 1,000 sensors | 2 CPU cores | 3GB RAM | 250GB |
| 1,000 to 2,500 sensors | 3 CPU cores | 5GB RAM | 500GB |
| 2,500 to 5,000 sensors | 5 CPU cores | 8GB RAM | 1TB |
| 5,000 to 10,000 sensors | 8 CPU cores | 16GB RAM | 2TB |
Contact the sales team if you plan to install more than 10,000 sensors.
Who is it recommended for?
This tool is well-suited for database administrators and IT professionals who need in-depth, real-time monitoring of MySQL databases. If you’re looking for a tool that not only monitors but also allows for custom reporting and alert thresholds, this is a strong candidate.
Pros:
- Always tracks critical MySQL databases
- Alerts on discovering performance metric reaches the threshold limit
- Generates insights into MySQL database’s health
- Track data generated on a particular day
- Allows setting up customized threshold values
Cons:
- Several features that would require time to learn
Price: The cost also depends on the number of sensors you install.
- 100 sensors – free
- 500 sensors – $1600
- $1000 sensors – $2850
- 2500 sensors – $5950
- 5000 sensors – $10,500
Besides this sensor-based pricing, Paessler also offers two packages. the XL1 Unlimited allows you to install any number of sensors on one core installation and it costs $14,500. XL5 Unlimited, on the other hand, allows you to install any number of sensors on a five-core installation and it costs $60,000.
You can download a 30-day free trial with no Limitations.
2. ManageEngine Applications Manager – FREE TRIAL
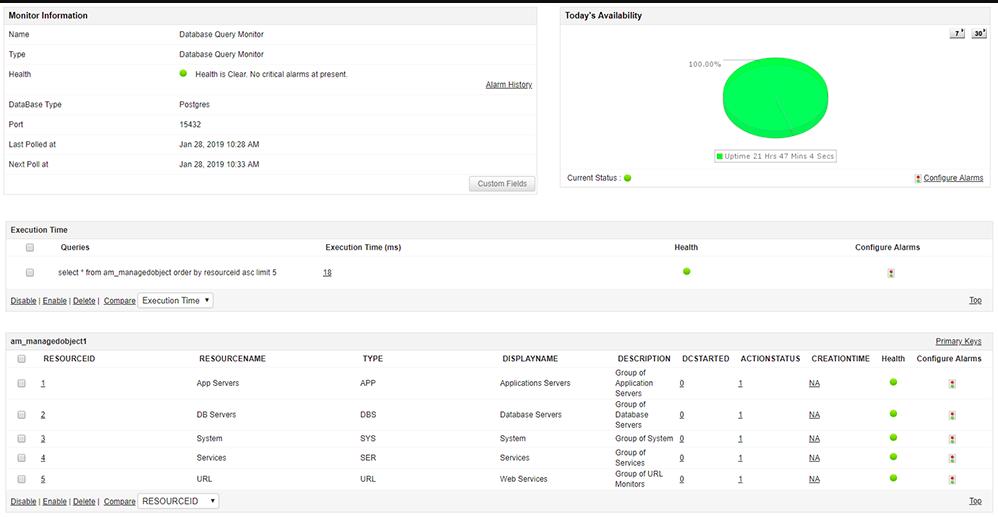
ManageEngine’s Applications Manager is an integrated application monitoring tool that is ideal for monitoring all servers, applications, databases like MySQL database management system, big data stores, ERP packages, virtual systems and cloud packages.
Key Features
- It is based on a single install and database architecture, which means, there is no need for any pre-installs.
- Monitors more than 100 key performance Indicators and Sensors such as response time, availability and memory utilization. As a result, even the slightest problems will be reported right away.
- Discovers applications with a single click.
- Sends notifications through email and SMS.
- You have the option to automate resolution with custom scripts, SNMP traps and trigger actions such as start, stop and restart.
- Advanced reporting tools make it easy to create custom reports within just a few minutes.
- Fixes baseline values for metric and checks these values constantly for anomalies.
- Reports also help with capacity planning.
- It provides REST APIs to get the necessary data from Applications Manager. In fact, these APIs make it easy to integrate Applications Manager with other internal applications of your organization.
- Assigns different user roles for restricted access.
- Offers support for languages such as English, German, French, Korean, Spanish, Chinese, Japanese and Vietnamese
Why do we recommend it?
We recommend ManageEngine Applications Manager for its ease of setup and robust monitoring capabilities, including tracking over 100 key performance indicators. Its advanced reporting tools and email/SMS notifications ensure that you’re always in the loop about your system’s health.
Who is it recommended for?
This tool is ideal for organizations looking for an all-in-one monitoring solution that covers servers, databases, and applications. It’s especially useful for teams that rely on a mix of on-premises and cloud-based solutions, as it offers diverse integration capabilities through REST APIs.
Pros:
- No need for pre-installs
- Track several key performance Indicators and Sensors
- Notifies admins using email and SMS
- Generates custom reports in minutes
- Supports REST APIs to collect critical data from the Applications Manager
Cons:
- May take time to completely understand all its features
ManageEngine’s Applications Manager price starts at $945, but for a more accurate quote, contact the sales team. A 30-day free trial is available and at the end of the trial period, it automatically converts to a free edition with limited features unless you purchase a commercial license.
3. Site24x7 SQL Server Monitoring – FREE TRIAL
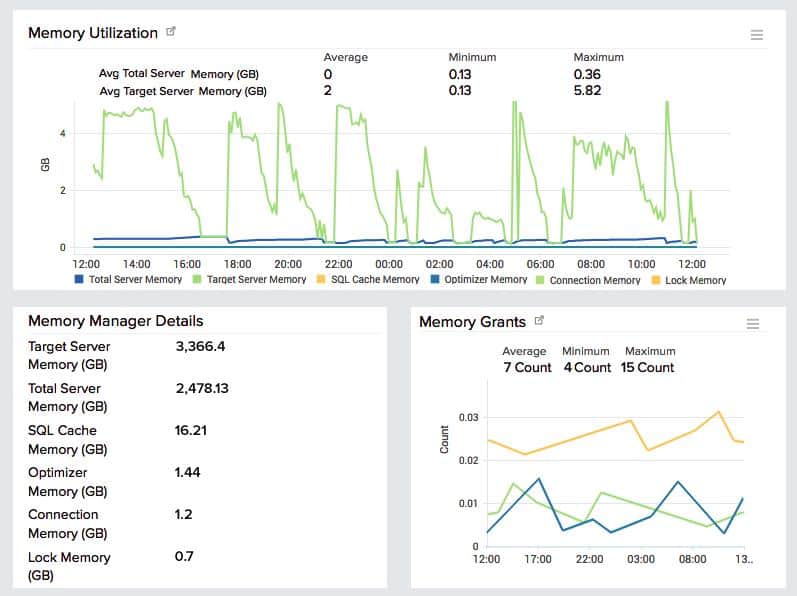
Site24x7 is a cloud-based network, server, and application monitor that includes a MySQL monitoring system. This is an “integration” that needs to be activated before it is accessible in the system dashboard.
Key Features
- Identifies application interdependencies that rely on MySQL instances.
- Monitors the physical server resources and identifies the effect of a MSQL query.
- Watches physical server capacity of memory, disk space, and CPU.
- Alerts when system resource availability reaches full capacity.
- Traces through the application t to give root cause analysis.
- Tracks reads, writes, slow queries, aborted clients, threads, and open files
- Monitors temporary tables on disk, total temporary tables, space used by temporary tables, and temporary table removal
- Displays aborted connections, maximum used connections, and connection usage
Why do we recommend it?
We recommend Site24x7 SQL Server Monitoring for its comprehensive view of both application interdependencies and physical server resources. It’s a robust solution that monitors and alerts you in real time when system resources are reaching full capacity.
System Requirements
Site24x7 is hosted so you don’t need to worry about system requirements for the processing module or the dashboard. Users access the console through any standard Web browser.
You need to activate the MySQL integration, which will download an agent onto the server that hosts the monitored MySQL database instances.
Who is it recommended for?
This tool is ideal for businesses that use MySQL databases and are looking for an all-encompassing monitoring solution. It’s particularly useful for those requiring real-time alerts and detailed root cause analysis, making it a good fit for small businesses and larger enterprises.
Pros:
- Discovers application interdependencies
- Monitors physical server capacity of CPU and memory
- Alerts on reaching resource shortage
- Tracks temporary tables on disk
- Displays connection usage
Cons:
- A detailed platform that may take time to understand all functionalities
Site24x7 costs $9 per month when paid annually, access a 30-day free trial.
4. Datadog Database Monitoring
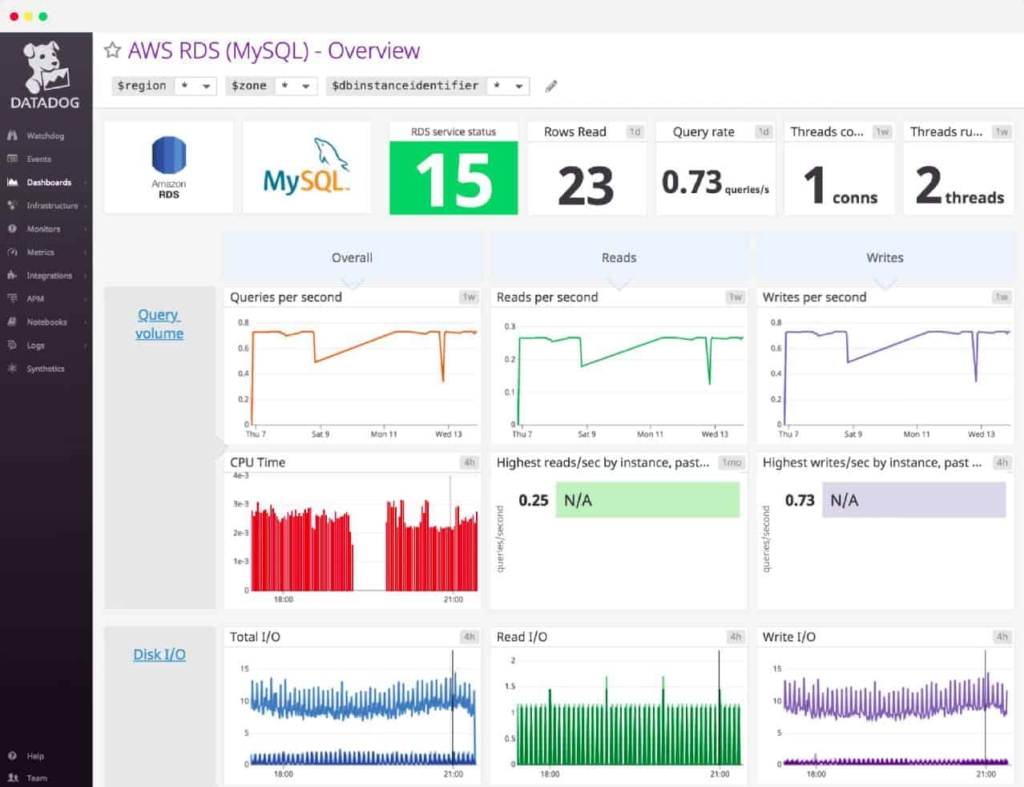
Datadog database monitoring functions are part of the Datadog APM. The Datadog system is based in the cloud and its application performance monitor can be extended by vendor-specific “integrations.” An integration adds on specific screens and gives the monitoring tool language-specific capabilities for a specific product. The MySQL integration is an example of this strategy. By activating the MySQL integration, the user turns on the functions of Datadog that are able to perform queries in MySQL databases and track transaction metrics.
Key Features
Here are some of the key features of Datadog database monitoring with the MySQL integration.
- Identifies slow-running queries and recommends solutions.
- Spots system resource locks and bottlenecks.
- Lists live metrics on error rates and resource usage.
- Provides end-to-end application tracing, detailing the supporting services stack.
- Identifies the root causes of slow response times.
- Registers transaction metrics, such as query throughput rates and average execution time, spotting outliers.
- Provides service maps that show application inter-dependencies.
- Analyses log files to quantify historical data into actionable remedies.
- Tracks performance of all the account holder’s MySQL instances whether they are on premises, on remote sites, or in the cloud.
- Creates aggregated summary views with drill-down paths to observe individual database instances.
Why do we recommend it?
We recommend Datadog Database Monitoring for its comprehensive monitoring capabilities, from identifying slow-running queries to offering end-to-end application tracing. Its cloud-based architecture makes it highly scalable and adaptable to your specific monitoring needs.
Who is it recommended for?
Datadog is well-suited for organizations that rely on cloud-based infrastructures and require real-time insights into their MySQL databases. It’s also ideal for development teams needing to trace application performance across multiple services, making it a versatile choice for complex tech stacks.
Pros:
- Discovers slow-running queries
- Locate bottlenecks and locks in the system’s resources
- end-to-end application tracing
- Finds underlying cause of slow response times
- Shows the interdependencies between applications using service maps
Cons:
- Short trials are available for testing
Datadog APM is a customizable package with the price starting at $31 per host per month. Get access to a 14-day free trial.
5. Idera SQL Diagnostic Manager for MySQL
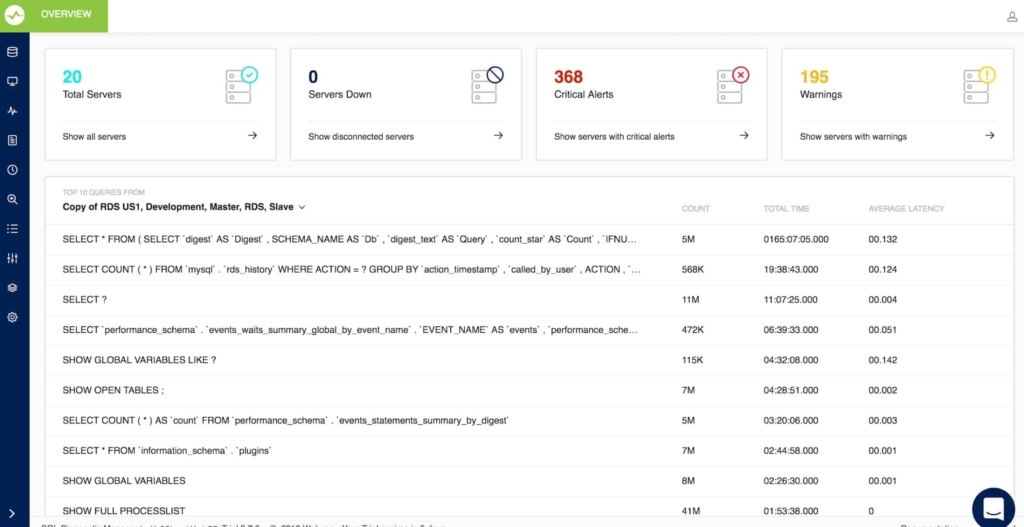
Idera SQL Diagnostic Manager for MySQL is both a monitoring system and a diagnostic tool for MySQL databases and the queries that run on them.
Key Features
- Idera offers live monitoring of database activities with graphical representations of resource usage.
- The system includes an alerting mechanism that will warn the DBA of approaching resource shortage so action can be taken before performance deteriorates noticeably.
- An SQL performance analyzer highlights where delivery can be improved by altering or adding database objects, such as indexes.
- Supervision for automated system processes, such as backup and replication.
Why do we recommend it?
We recommend Idera SQL Diagnostic Manager for MySQL for its dual functionality as both a monitoring system and a diagnostic tool. The real-time monitoring capabilities combined with an effective alerting mechanism make it an invaluable asset for proactive database management.
System Requirements
The SQL Diagnostic Manager for MySQL is an on-premises software package with the following hardware requirements for its host:
- Minimum CPU speed: 2 GHz
- Fee memory: 1 GB
- Minimum disk space: 40 MB
- Port availability: 5166, 5167, 5169
The system will run on the following operating systems:
- Linux
- Windows 7
- Windows 8
- Windows 10
- Windows Server 2008 SP1+
- Windows Server 2008 R2
- Windows Server 2012
- Windows Server 2012 R2
- Windows Server 2016
- Windows 2019
You will also need the following packages:
- Internet Explorer 7.0 or later
Who is it recommended for?
This tool is ideal for Database Administrators (DBAs) and IT managers who need to monitor and optimize MySQL databases. It’s also suitable for those managing databases in various environments such as MariaDB, Amazon RDS, and Azure, providing a one-stop solution for diverse database needs.
Pros:
- Monitors database activities in real-time
- Alerts on reaching resource shortage
- Track MariaDB, Amazon RDS, and other databases for MySQL
Cons:
- Idera SQL Diagnostic Manager for MySQL offers a short trial period
The Idera SQL Diagnostic Manager for MySQL package is priced at a rate of $399 per server but you can get a better deal by negotiation for more than 50 servers. Idera offers SQL Diagnostic Manager for MySQL on a 14-day free trial.
6. Nagios MySQL Monitoring

Nagios MySQL monitoring tool is a comprehensive monitoring tool that gives information about the availability, cache ratios and other key metrics of MySQL databases.
Key Features
Here are some of its important features.
- Increases application availability as it constantly monitors the health, and reports any issues right away.
- Improves database performances, as you can stay on top of many important metrics such as cache ratios.
- Detects outages, failures and database corruption quickly, so they can be fixed right away.
- Predicts the storage requirements and index performance to help with capacity planning.
- Gives the option to offload MySQL services from a central Nagios XI server to an external remote server.
- Comes with built-in templates and reports for easy reporting and compliance.
Why do we recommend it?
We recommend Nagios MySQL Monitoring for its ability to enhance database performance and swiftly detect issues like outages or database corruption. The tool is comprehensive, focusing not only on immediate alerts but also on long-term capacity planning.
Who is it recommended for?
This monitoring tool is ideal for organizations that require constant and comprehensive oversight of their MySQL databases. If you’re an IT manager or a database administrator focused on optimizing performance and forward planning, Nagios MySQL Monitoring is a strong option to consider.
Pros:
- Works on enhancing database performances
- Identifies outages faster
- Forecasts index performance and storage needs to aid in capacity planning
- Facilitates offloading MySQL services
- Offers built-in templates and reports
Cons:
- Enhancing the graphical user experience is necessary
- Only a few monitoring agents are available
The Nagios XI starts from $1,995. For custom pricing, contact the sales team. You can download a trial version.
7. SolarWinds Database Performance Analyzer
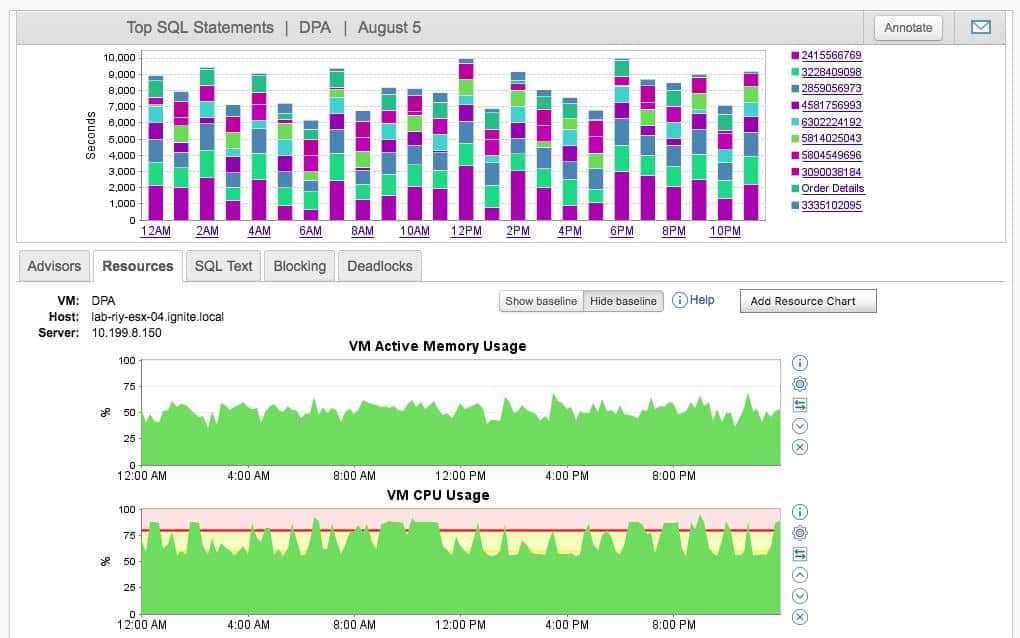
SolarWinds Database Performance Analyzer is a monitoring tool for Oracle, SQL Server, and MySQL instances. It analyzes the database structure, its supporting services, and the effectiveness of query construction.
Key Features
The Database Performance Analyzer is a crucial system optimization tool and has the following features:
- Identifies the root cause of long SQL execution by correlating SQL code with system resources.
- Analyzes queries and recommends SQL improvements.
- Displays live events in the database, which are tallied per event type.
- Can be used for cloud-based database instances as well as on-premises databases.
- Analyzes code in development for system impact.
- Performance analysis tool to identify capacity.
- Trend analysis and capacity planning assistance.
- Identifies resource locks and displays blocking actions.
- Recommends indexes and table normalization/denormalization.
- Spots unusual behavior in the database.
Why do we recommend it?
We recommend SolarWinds Database Performance Analyzer for its comprehensive approach to database monitoring and optimization. The tool excels in identifying the root cause of long SQL execution times and offers actionable recommendations for improvement.
System Requirements
You need the following resources in place to install SolarWinds Database Performance Analyzer:
- Requires Windows Server 2012 R2, 2016, or 2019, Windows 10 (evaluation only), or Linux.
- MySQL Community or Enterprise versions 5.6, 5,7, 8, Amazon RDS for MySQL 5.6 or 5.7, and Aurora 2.03.
- SQL Server database Standard or Enterprise versions 2014,2016, 2017, and 2019
- Oracle Standard or Enterprise editions versions 11.2, 12.1, 12.2, 18.4, and 19
- VMWare vCenter Server version 6.5 or 6.7
- VMWare ESX/ESXi Host version 6.5 or 6.7
- Web console browsers include the Chromium-based version of Microsoft Edge, Mozilla Firefox, or Google Chrome.
- Requires Java JDK 15.
Who is it recommended for?
This tool is highly recommended for database administrators and developers who work with Oracle, SQL Server, or MySQL databases. It’s particularly useful for those responsible for optimizing query performance, whether they are managing on-premises or cloud-based instances.
Pros:
- Helps analyze database structure
- Discover the root cause of long SQL execution
- Great for cloud-based database instances
- Helps identify capacity using the performance analysis tool
- Tracks database unusual behavior
Cons:
- It would be better if the tool offered longer free trials
SolarWinds Database Performance Analyzer offers a 14-day free trial.
8. MySQL Enterprise Monitor
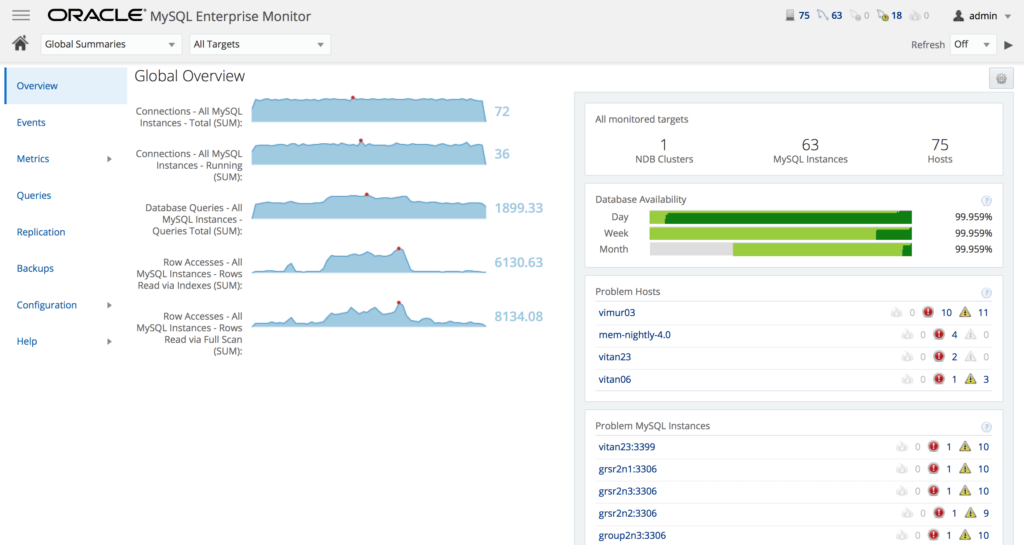
MySQL Enterprise Monitor provides visibility into the performance and availability of MySQL databases in real-time.
Key Features
- It does not require an agent for monitoring
- Installation is easy and you can start using the tool within just 10 minutes.
- Policy-based administration gives better access control.
- Provides automated guidance on how to fix problems such as poor indexing, long running processes and more. This guidance comes from 14 advisor groups and more than 225 advisors. You can also create custom advisors.
- Easily identifies trends for individual databases from your dashboard.
- Sends alerts based on customizable thresholds.
- Offers real-time monitoring for key metrics of your database.
- Monitors MySQL resource utilization, according to different users.
- Sends an alert when the capacity is nearing its limits, so you can avoid potential problems.
- Creates a list of SQL queries that have used the maximum resources over a user-defined time period.
- Automatically detects changes in MySQL cluster topology.
- Monitors MySQL Enterprise firewall activities to help you stay on top of any security vulnerability.
- Allows you to get complete information about backups.
- The user interface provides an excellent user experience.
Pros:
- No agent is needed for monitoring
- Installation hardly takes any time
- Better access control is provided by a policy-based management
- Notifies depending on customizable thresholds
- Generates data about backups
Cons:
- Only focuses on monitoring SQL server
- No yearly price discounts are available
Contact the sales team for more details while you can download the MySQL Enterprise Monitor.
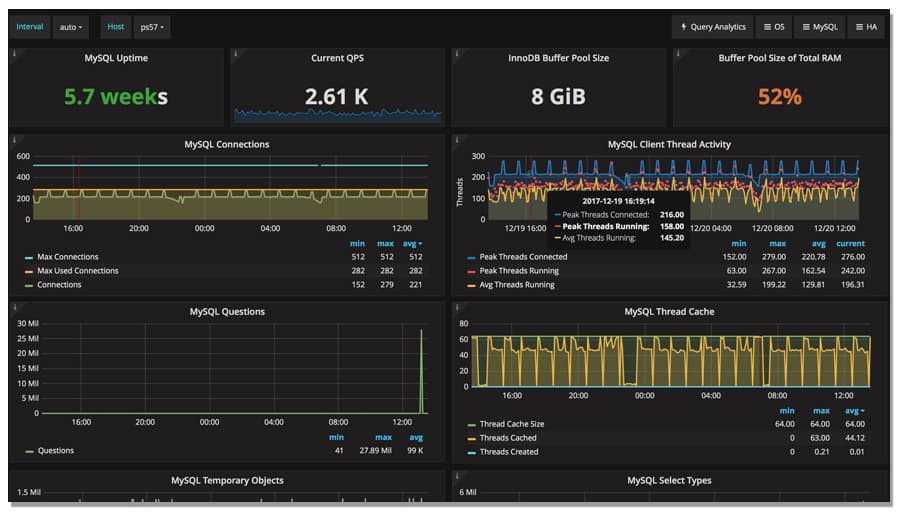
9. Percona Monitoring and Management Tool
Percona Monitoring and Management tool is a free and open-source software that manages MySQL, MongoDB and MariaDB databases.
Key Features
- You can run this tool in your own environment, so you’ll have maximum security and reliability.
- Provides a thorough time-based analysis for MySQL. This analysis helps you to better understand the health and performance of your database.
- Uses a client/server model, which means, you’ll have to download and install both the client and the server.
- Query Analytics (QAN) tool stays on top of the execution time of queries. You can even get details of SQL queries that take a long time to execute, and understand their root cause.
- Gives a historical view of the different parameters that are critical for the optimal performance of a MySQL Database Server.
- Offers point-in-time and historical visibility of MySQL database performance.
- Maps queries against metrics to give you the pertinent data to make important decisions.
- Displays current SQL queries and highlights issues to help you improve the performance of your database.
Why do we recommend it?
We recommend Percona Monitoring and Management Tool for its in-depth, time-based analysis that completely explains your MySQL database’s health. The Query Analytics feature is particularly helpful for diagnosing long-running SQL queries and their root causes.
Who is it recommended for?
This tool is best suited for organizations that use MySQL, MongoDB, or MariaDB and require detailed insights into their database performance over time. If you are a database administrator who values both real-time and historical data for performance tuning, this tool offers a comprehensive solution.
Pros:
- Performs in-depth time-based analysis for MySQL
- Requires installing both the client and the server
- Generates insights into SQL queries
- Allows viewing various parameters over time
- Maps queries against metrics for informed decisions
Cons:
- Adequate but does not offer outstanding documentation
- PMM alerting mechanism needs to be upgraded
Percona Monitoring and Management is Open-source and free to use.
10. LogicMonitor MySQL Monitoring
LogicMonitor MySQL Monitoring tool makes it easy to monitor your MySQL database and its associated infrastructure.
Key Features
- It requires no configuration. Simply download and start using it.
- Monitors many critical MySQL metrics such as MySQL Query Cache, MySQL Tablescans and MySQL InnoDB statistics.
- Provides weekly and monthly reports.
- Live support is available around the clock and this is backed by a vibrant community.
- Customizable dashboards provide comprehensive and aerial view of different metrics.
- Comes with a single sign-on and two-factor authentication for greater security.
- Gives trending graphs and alerts on the following metrics:
- Number and types of operations
- Cache hit rates
- Query response time
- Table scans
- Index usage
- Temporary disk tables
- Abnormal connection events
- Replication status
Why do we recommend it?
We recommend LogicMonitor MySQL Monitoring for its zero-configuration setup and comprehensive metric tracking capabilities. The tool’s added security features like single sign-on and two-factor authentication make it a reliable choice.
Who is it recommended for?
This tool is ideal for teams that need a quick-to-deploy solution for monitoring MySQL databases. If you are looking for live support, customizable dashboards, and robust security features, LogicMonitor is well-suited for your needs.
Pros:
- You can download it in minutes and use it without any configuration needed
- Tracks several critical MySQL metrics
- Can generate weekly and monthly reports
- Live support is available
- Uses single sign-on and two-factor authentication for security
Cons:
- A short testing period of only 14 days
- Only enables basic alerts by default
There are three editions – Starter, Pro and Enterprise contact the sales team for pricing. Download a 14-day free trial.
11. AppDynamics MySQL Performance Monitoring
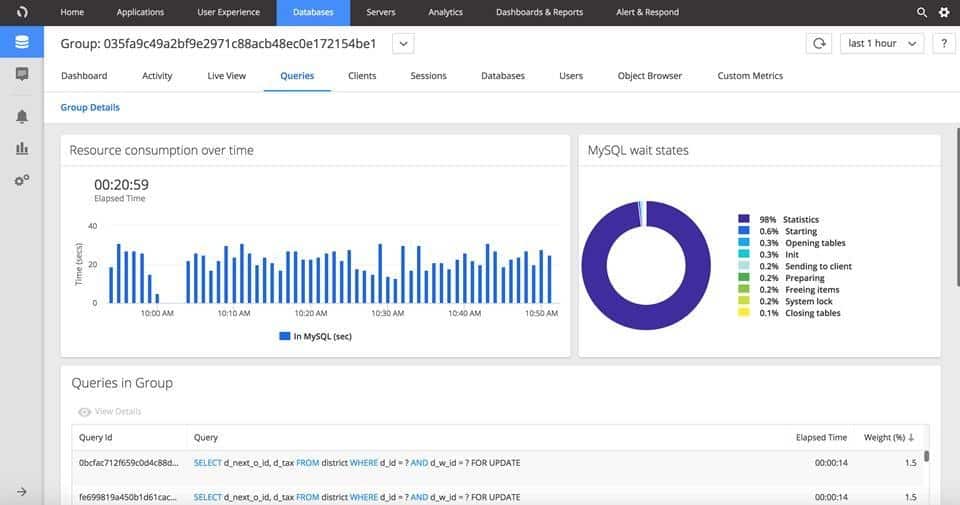
AppDynamics MySQL Performance Monitoring tool is a comprehensive tool that works around the clock to give you deep insights about MySQL databases.
Key Features
- Real-time visibility helps to get to the root cause of a problem quickly, so you can resolve it right away.
- Displays the delta graphs of MySQL servers throughout the entire organization.
- Metrics are collected and compared against established baselines to identify deviations.
- Customizable charts helps to know when the performance exceeds the historical baseline.
- Sends alerts and notifications when any metrics goes beyond the pre-determined threshold limits.
- Charts help with performance tuning and capacity planning
- Allows to quickly troubleshoot issues with a simply one-click SQL statement analysis.
- Gives comprehensive details of the wait and execution time of queries.
- Provides visibility into the objects and configuration of MySQL database.
Why do we recommend it?
We recommend AppDynamics MySQL Performance Monitoring for its real-time visibility and customizable alerting capabilities. Its in-depth metrics and one-click SQL statement analysis make troubleshooting swift and efficient.
Who is it recommended for?
This tool is recommended for organizations that need granular insights into MySQL performance and have a focus on real-time issue resolution. If you need to go beyond basic monitoring and engage in performance tuning and capacity planning, AppDynamics is the tool for you.
AppDtnamics offers two plans – Lite Plan and Pro Plans. Lite Plan is free to use and offers only limited units per module. Also, data retention is limited, but you’ll have full access to the documentation, community and other resources. Pro plans come up comprehensive support and data retention for one year. For pricing of pro plans, contact the team.
Both the plans start with a free 15-day trial. If you make a purchase, your software is given the corresponding access to different features. Otherwise, you continue with the Lite plan.
12. Zenoss MySQL Database ZenPack
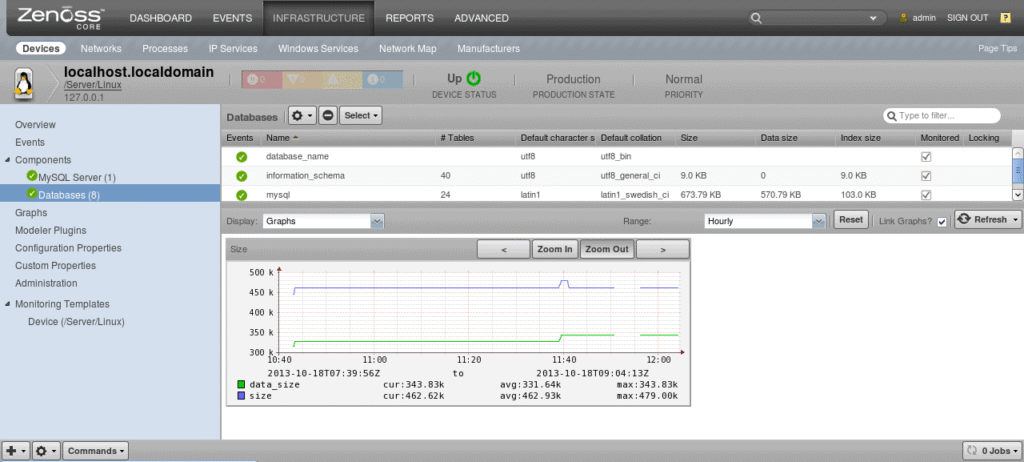
Zenoss MySQL Database ZenPack provides status and performance monitoring of MySQL servers.
Key Features
- Discovers MySQL entities based on the attribute, tag and collection attribute of MySQL servers.
- Monitors events and sends triggers, if necessary. Each trigger will be accompanied by a pertinent message to make it easy for you to understand what’s going on.
- Along with Zenoss Service Dynamics product, it provides service impact capability for MySQL.
- To use, you have to setup connection and bind it to the device containing MySQL servers.
- Monitors different MySQL database and server components. The following attributes are collected every five minutes and the average is calculated and graphed every second.
- Size
- Thread connected
- Aborted connects
- Com drop table
- Data size
- Max used connections
- Bytes received
- Com create user
- Index size
- Connections
- Aborted clients
- Uptime
- Bytes sent
- Key writes
- Open tables
- Handler update and more
Why do we recommend it?
We recommend Zenoss MySQL Database ZenPack for its robust event monitoring and service impact capabilities. The tool’s granularity in metrics collection, updated every second, provides comprehensive insights into MySQL server performance.
Who is it recommended for?
This tool is ideal for IT professionals who require a holistic view of their MySQL server environment, including performance, status, and event monitoring. If you need to keep track of a multitude of metrics and wish to integrate this data into service impact assessments, Zenoss is an excellent choice.
This is an open-source product and is free. However, support is available only for commercial customers who have an active subscription.
13. MySQL OpsPack
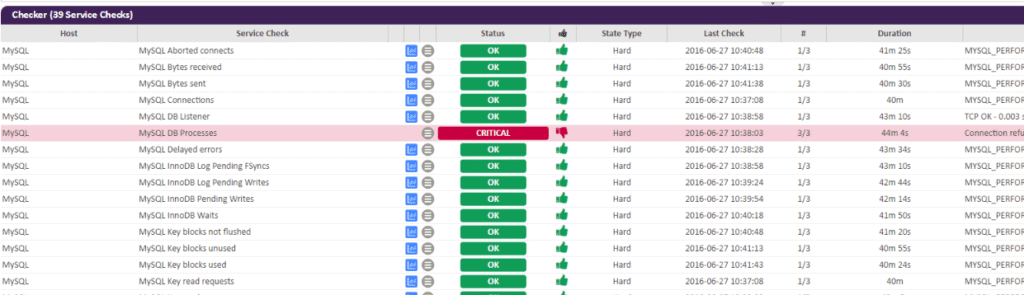
MySQL OpsPack is a monitoring tool that keeps an eye on many important performance metrics of MySQL databases, so you can get good visibility into its performance.
Key Features
- Keeps an eye out for any change and every change and notifies the same in the form of alerts.
- Setting up and configuration is easy.
- Comes as a part of the larger monitoring tool called OpsView Monitor.
- Monitors the following important performance metrics.
- Aborted connects – Number of aborted connects
- Bytes received – Number of bytes received (total)
- Bytes sent – Number of bytes sent (total)
- Connections – Number of Connections
- DB Listener – Checks MySQL on TCP port 3306
- DB Processes – Checks MySQL processes
- Delayed errors – Delayed errors
- InnoDB Log Pending FSyncs – InnoDB Log pending fsyncs
- InnoDB Log Pending Writes – InnoDB Log pending writes
- InnoDB Pending Writes – InnoDB Log waits
- InnoDB Waits – InnoDB Log waits
- Key blocks not flushed – Key blocks not flushed
- Key blocks unused – Key blocks unused
- Key blocks used – Key blocks used
- Key read requests – Key read requests
- Key reads – Key blocks unused
- Key write requests – Key write requests
- Key writes – Key writes
- Low memory prunes – Low memory prunes
- Max used connections – Maximum used connections
- Open Files – Open files on MySQL Server
- Open streams – Open streams MySQL Server
- Open tables – MySQL open tables
- Qcache free blocks – Qcache free blocks
- Qcache free memory – Qcache free memory
- Qcache hits – Qcache hits
- Qcache inserts – Qcache inserts
- Qcache not cached – Qcache not cached
- Qcache queries incache – Qcache queries in cache
- Qcache total blocks – Qcache total blocks
- Slave open temp tables – Number of open temp tables on slaves
- Slave retried transactions – Number of retried transactions on slaves
- SSL Renegotiates – SSL connect renegotiates
- SSL Session cache hits – SSL sessions cache misses
- SSL Session cache misses – SSL sessions cache misses
- SSL Session cache overflows – SSL sessions cache overflows
- SSL Session cache timeouts – SSL sessions cache timeouts
- Threads connected – Number of threads connected
- Threads running – Threads running
Why do we recommend it?
We recommend MySQL OpsPack for its focus on performance metrics and alerting capabilities. Its integration with OpsView Monitor makes it a seamless part of a larger monitoring ecosystem, simplifying the setup and configuration.
Who is it recommended for?
This tool is best suited for administrators who already use or plan to use OpsView Monitor and want a specialized tool for MySQL database monitoring. Its comprehensive metric tracking makes it ideal for those looking to maintain optimal database performance.
MySQL OpsPack is free to use and can be downloaded from Github.
Conclusion
In short, MySQL Monitoring Software and tools are essential to monitor the different metrics of your MySQL databases to ensure that they are always in a healthy state. Since MySQL is a critical resource that powers many of your applications, having a tool for monitoring your MySQL databases can greatly reduce the workload of DB administrators and can also help you address issues quickly.
Related Post: Best NetApp Monitoring Software
