
To write optimal SQL queries that perform well, you need to know how the query optimizer works. Generally speaking, SQL Query Optimizers analyze many options for a given query, estimate the cost of each of these options, and finally, pick the ones with the lowest cost. This should help you appreciate the importance of a query optimizer.
Here is our list of SQL Query Optimizer tools:
- Idera DB Optimizer – Best for DBAs tuning queries across multiple RDBMS platforms
- SolarWinds DBA – Best for DBAs needing real-time multi-database performance analysis
- EverSQL – Best for developers seeking quick web-based MySQL query optimization
- dbForge Studio for SQL Server – Best for SQL developers needing all-in-one SQL Server development tools
If a query optimizer chooses the wrong plan, the difference in performance can be from a few milliseconds to even a few minutes. This also explains why this optimizer has the biggest impact on the performance of a SQL server component.
Fortunately, there are many third-party SQL query optimizer tools available today that optimize every SQL query automatically.
These tools greatly ease the work of developers and database administrators, as they provide the right query-tuning suggestions and indexing recommendations.
The Best SQL Query Optimizer Tools
Methodology for selecting the Best SQL Query Optimizer tools
To help developers and database administrators select the right SQL query optimizer tool for their needs, we have listed factors:
- Do not miss to compare the tools based on different criteria such as performance, scalability, cost-effectiveness, and ease of use.
- Check if it can discover database problems in real-time
- Can it monitor SQL servers from a single view regardless of their location?
Here is a detailed look into each of these tools.
1. Site24x7 SQL Server Monitoring – FREE TRIAL
Site24x7 is a cloud-based monitoring system that covers networks, servers, and applications. The service includes database performance monitoring and SQL analysis utilities.
Key Features
Some of the key features of the SQL analyzer in Site24x7 are:
- Hosting included with the software
- The ability to monitor Windows Server and Linux
- An application stack feature that links together interfaces, databases, and other services, and the underlying resources of the hosting server.
- The tracking of key database transaction processing metrics
- Tracking of temporary table creations
- Recording of read-and-write activity
- Linking of transaction activity to server processes
- Alerts for when system resources are running low
- A web-based console that is accessed through any browser
- Secure connections for data transfers between the on-premises data collector and the Site24x7 servers.
Why do we recommend it?
Site24x7 SQL Server Monitoring offers a comprehensive set of features including the ability to monitor both Windows and Linux servers, an integrated application stack, and critical transaction metrics tracking. Its alerts for low system resources make it proactive in preventing performance issues.
Who is it recommended for?
The tool is ideal for businesses that have mixed OS environments and need a unified monitoring solution. It’s especially beneficial for IT teams and database administrators who are responsible for ensuring uptime and performance across multiple services and databases.
Pros:
- Tracks database transaction processing metrics as well as temporary table creations
- Users can easily monitor Windows Server and Linux using Site24x7 SQL Server Monitoring
- Has an application stack feature that helps connect the hosting server’s base resources with interfaces, databases, and other services
- Notifies when system resources are low
- Users can access the web-based console using any browser with the Site24x7 SQL Server Monitoring tool
Cons:
- The user interface is a little unclear and requires improvement
Site24x7 Infrastructure costs $9 per month when paid for annually. Get more information and access to a 30-day free trial.
EDITOR'S CHOICE
Site24x7 SQL Server Monitoring is our top pick for an SQL Optimizer because this monitoring system is able to track SQL query executions on premises and on cloud platforms. As this is a cloud-hosted service, every location for your database is remote to it. The monitor looks at how queries are executed within an instance, examining the objects in the database, such as normalized tables and indexes. The service also looks at the interactions between the database and server resources. This gives the package the ability to see whether a particular query places strain on the parameters of the database, such as allocated resources for memory and disk space.
Download: Access a 30-day FREE Trial
Official Site: https://www.site24x7.com/signup.html?pack=44&l=en
OS: Cloud-based
2. ManageEngine Applications Manager – FREE TRIAL
ManageEngine Applications Manager monitors the performance of applications and services and also the hosts that all of that software runs on. This remit includes the monitoring of databases and SQL query execution.
Key Features
Some of the important features of the Applications Manager are:
- Monitors on-premises, remote, and cloud-based databases.
- Aggregates all of the metrics for all database instances of each DBMS and includes a drill-down path to get data on each individual instance.
- Automatically discovers, and categorizes, all of your databases and starts monitoring them without any human intervention. Settings can be adjusted manually.
- A troubleshooting assistant that includes code-level guidance.
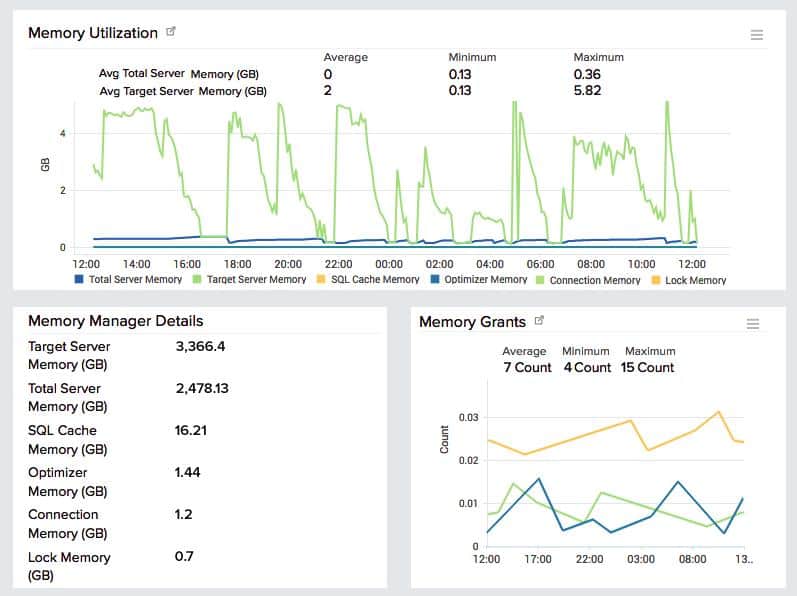
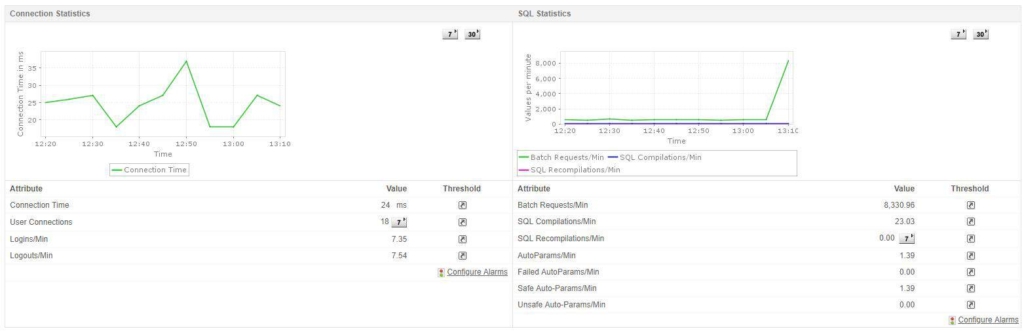
- Monitors database instance factors, including CPU and memory utilization, buffer cache, resource pools, connection statistics, and user sessions.
- The live monitor examines query performance, deadlock issues, plus system and user errors.
- Maps each query execution with resource usage.
- The monitor includes database structure analysis with recommendations for improved indexing and table relationships.
- Supervises replication and backup processes.
- Deploys machine learning to recommend resource allocations for database instances.
- Regularly scheduled performance reports.
Why do we recommend it?
ManageEngine Applications Manager stands out for its intelligent automation and comprehensive monitoring capabilities. The tool not only tracks key performance metrics but also provides code-level guidance for troubleshooting and uses machine learning to optimize resource allocations.
Who is it recommended for?
This tool is a strong fit for enterprises that require deep insights into their database performance, including CPU and memory utilization. Its capabilities make it ideal for DBAs and IT professionals who manage complex, multi-instance database systems and are looking for automated monitoring and optimization recommendations.
Pros:
- Keeps track of CPU and memory utilization, and resource pools, and offers code-level assistance
- The live monitor checks and updates deadlock problems, query performance, and user and system failures
- Relates the use of resources to each query’s execution
- Aggregates all metrics for each DBMS’s database instances and uses techniques to drill down and gather information on each specific instance
- Helps discover, categorize, and monitor all of your databases automatically without human interaction
Cons:
- Does not have a user-friendly graphical interface
There is a Free edition of Applications Manager. That version is limited to monitoring five application statuses. The Professional edition can monitor up to 500 Applications for $945 per year. The Enterprise edition can monitor up to 10,000 application statuses at a price of $9,595. You can download a 30-day free trial.
3. Redgate SQL Monitor
Redgate’s SQL Monitor proactively monitors your SQL server and reports problems, before they turn into full-fledged disasters.
Key Features
Some of the important features of Redgate are:
- Gives you the option to install one base monitor per location. This means you can get the reports of all your data centers in one single interface without having to install a separate UI in each location. With this, you can monitor the performance of all locations through a single SQL monitor dashboard, so there is no security compromises.
- One base monitor can cover more than 200 servers.
- All alerts are single expandable objects in your inbox, so you have all the necessary information clustered together. In addition, it avoids cluttering your inbox as well.
- Alerts deadlocks as they happen, to make it easy to recover any lost processes and to put measures to reduce their future occurrences.
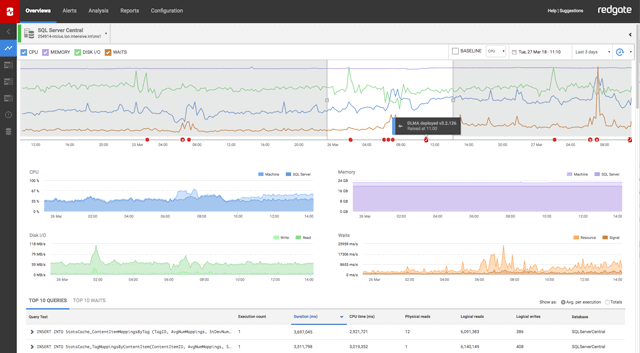
- Creates advanced graphs that give you a quick glance into the state of SQL queries.
- Query History Graph helps to see the impact of queries. This makes it easy to identify problems at the earliest.
- Blocking processes are displayed on an overview page for easy readability.
- Identifies the tool that carried out the deployment and displays the same on your timeline.
- You can bulk-load details through the import-export API.
- Identifies bad database deployments.
Why do we recommend it?
We recommend Redgate SQL Monitor because it provides a comprehensive, one-stop solution for SQL server monitoring. It not only scales to monitor over 200 servers but also centralizes all crucial data and alerts, making it one of the best in this category.
Who is it recommended for?
This tool is recommended for database administrators and IT teams overseeing multiple SQL server instances, especially those spread across different locations. Its scalability and centralized monitoring make it particularly useful for large organizations seeking efficient server oversight.
Pros:
- Displays blocking processes in the overview page for better readability
- Highlights the tool that carried out deployment on your timeline after being identified
- More than 200 servers can be covered by one base monitor
- Since each alert is a single expandable item in your inbox, all the data gathered in one place prevents your inbox from becoming cluttered
- Generates improved graphics that allow you to quickly see how SQL queries are progressing
Cons:
- Assign a separate section of code to handle missing indexes
- Does not support WebHooks but will help in enhancing integration to other subsystems
The pricing depends on the number of servers on which you want to install this tool. The cost is $1,495 per server for up to four servers and $1,271 per server for five to nine servers. If you want to install more than ten servers, contact the sales team for a personalized quote. You can download a 14-day free trial.
4. Idera DB Optimizer
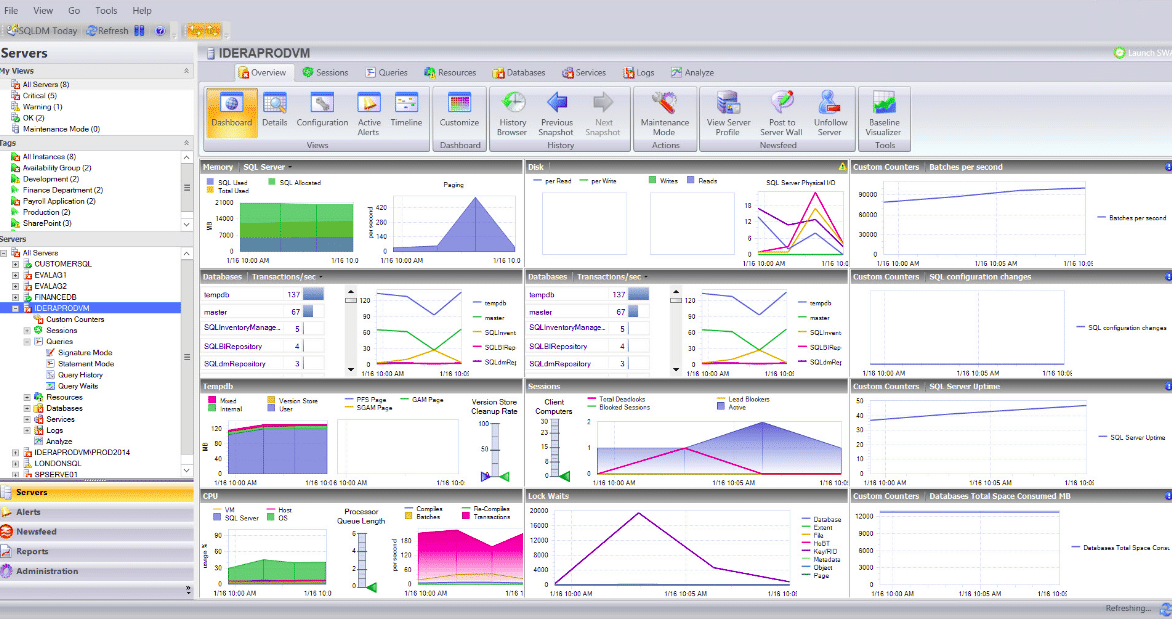
Idera DB Optimizer is a comprehensive tool that tunes poorly performing SQL code and helps you identify problems and their root causes at the earliest.
Key Features
Idera comes with the following features:
- Tunes SQL code across all major RDBMS such as Oracle, Sybase, DB2, and SQL Server through a single common interface.
- Reduces training needs and streamlines collaboration among different teams within an organization.
- The wizard that comes with this tool automatically suggests solutions to improve optimization.
- Color-coded index analysis view shows the missing indexes and offers recommendations to fix the same.
- Its unique Visual SQL Tuning diagram turns text-based SQL code into graphical SQL diagrams. This helps DBAs to understand the impact of SQL queries on the database.
- Gives a graphical representation of wait time analysis to identify poor database performance.
- Allows information to be shared across the process.
- Load testing verifies the performance of existing and alternative SQL queries against the database
- Helps to run multiple queries in parallel to stimulate the environment you want.
- Appropriate SQL rewrites are suggested.
Why do we recommend it?
Idera DB Optimizer excels in SQL code tuning across multiple major RDBMS platforms. Its unique Visual SQL Tuning diagram simplifies complex SQL code into graphical representations, aiding in quicker problem identification and optimization.
Who is it recommended for?
Idera DB Optimizer is particularly beneficial for database administrators and SQL developers who have to work across different types of RDBMS such as Oracle, DB2, and SQL Server. The tool’s capabilities are also a boon for teams seeking to improve collaboration while reducing the time spent on training.
Pros:
- You do not need to spend extra time training with the tool. Also, it helps improve communication among team members
- With its special Visual SQL Tuning diagram, text-based SQL code can be easily transformed into graphical SQL diagrams that help in comprehending how SQL queries affect the database
- Runs several queries simultaneously to trigger the desired environment
- Using a single common interface, SQL code is synchronized across all significant RDBMS, including Oracle, DB2, and SQL Server
- It’s built-in wizard automatically proposes ways to boost optimization
Cons:
- The interface occasionally appears sluggish
- Running the web client requires more time than running the Windows client
Idera DB Optimizer starts at $429 per user or workstation. This cost includes one year of maintenance as well. You can download a fully functional 14-day free trial.
5. SolarWinds Database Performance Analyzer
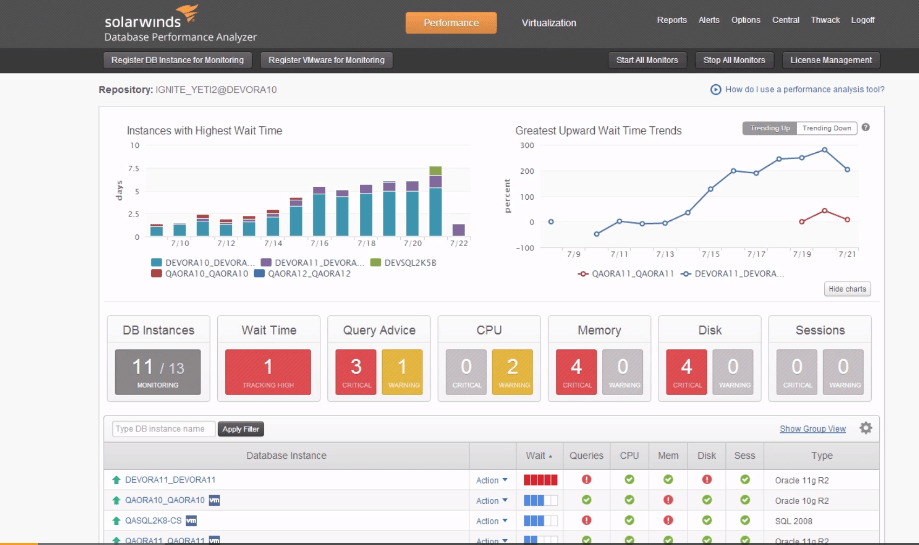
Database Performance Analyzer from SolarWinds is an advanced tool for monitoring, analysis, and tuning of database and SQL query performance.
Key Features
Its salient features include:
- Identifies database problems in real-time.
- Tracks every query in every active session and identifies those areas that cause delays in query execution and performance.
- Monitors and optimizes SQL server from a single view, regardless of whether it is on-premises, virtualized, or in the cloud.
- Captures multiple metrics of response time and server statistics and stores them in a data warehouse repository for future analysis.
- Installs no software or agent on the monitored server, and hence places less than 1% of the load on the monitored instance.
- Takes you to the root cause in three to four clicks
- Correlates SQL statements, context, system, storage health, wait type, and response times to give you a complete picture of a query’s performance.
- Proactively monitors the system and identifies problems before it starts affecting users.
- Identifies SQL blocks and its corresponding locks.
- Automatically creates graphical reports and even emails them to specified addresses.
- Alerts proactively through email or SNMP traps.
- Integrates well with Orion platform.
- Provides cross-vendor database support from a single interface.
- Works well on different databases such as SQL Server, Oracle, MySQL, MariaDB, Aurora, DB2, and ASE.
Why do we recommend it?
SolarWinds Database Performance Analyzer shines in real-time monitoring and issue identification, helping to proactively resolve problems before they impact users. Its agentless architecture minimizes system load, making it a high-efficiency solution for optimizing database performance.
Who is it recommended for?
This tool is particularly suitable for DBAs, system administrators, and IT managers who need to keep an eye on various types of databases like SQL Server, Oracle, MySQL, and more. It’s also great for organizations that require in-depth analytics as it stores metrics in a data warehouse for future analysis.
Pros:
- It is not necessary to install software or agents on the monitored server which also helps reduce the load on the monitored instance
- Monitor, identify, and fixes issues before it creates any impact on users
- Graphics reports are generated automatically, and some even include email addresses
- Identifies the locks that go with each SQL block
- Tracks parameters like server statistics and response time and stores them in a data warehouse for better analysis in the future
Cons:
- Difficult to navigate and is not always clear
SolarWinds Database Performance Analyzer starts at $1,995
6. EverSQL
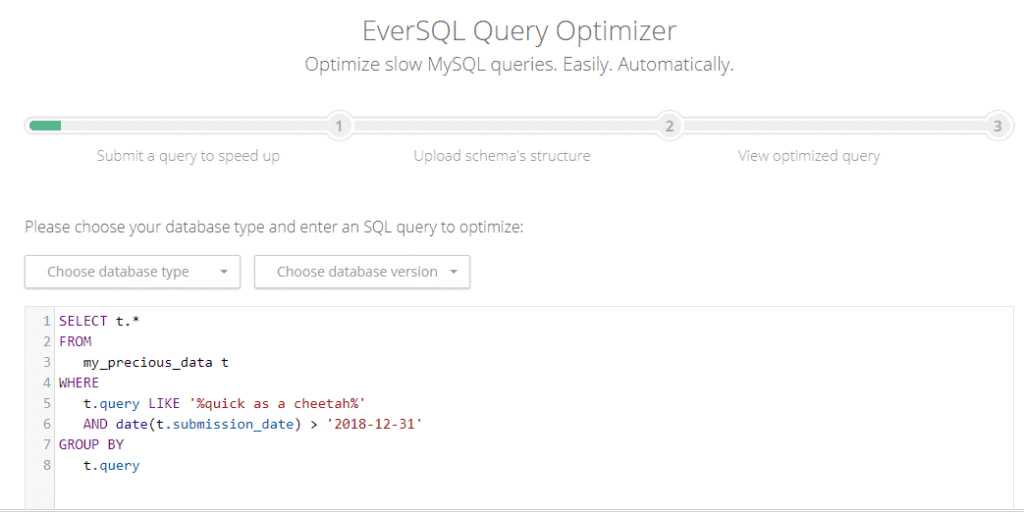
EverSQL is an online SQL query optimizer that provides the easiest way to monitor the performance of SQL queries.
Key Features
EverSQL comes with the below-mentioned features:
- Optimizes SQL queries easily
- Simple to use.
- Comes with an intuitive interface
- No downloads or installations are required.
- Simply upload or type a query, upload the schema structure, and get optimized query results
- Doesn’t require any access to the database.
- Supports MySQL, MariaDB, and PerconaDB databases.
- Provides the best indexing recommendations.
Why do we recommend it?
We recommend EverSQL for its user-friendly interface and capabilities to optimize SQL queries without requiring direct database access. Its support for multiple database types like MySQL, MariaDB, and PerconaDB makes it versatile and essential for performance tuning.
Who is it recommended for?
EverSQL is ideal for database developers, SQL enthusiasts, and database administrators who are looking to optimize the performance of their SQL queries without complex setups. It’s especially useful for those working with MySQL, MariaDB, or PerconaDB databases and in need of quick indexing recommendations.
Pros:
- Intuitive interface simplifies SQL query optimization.
- Versatile support for MySQL, MariaDB, and PerconaDB.
- No direct database access required, enhancing security.
Cons:
- Limited functionality in the free plan restricts extensive use.
The cost depends on the number of credits you buy. There are four plans, namely, Free, then from: Basic ($29 a month), Plus ($135 a month) and Pro ($749 a month). This tool can be accessed online.
7. dbForge Studio
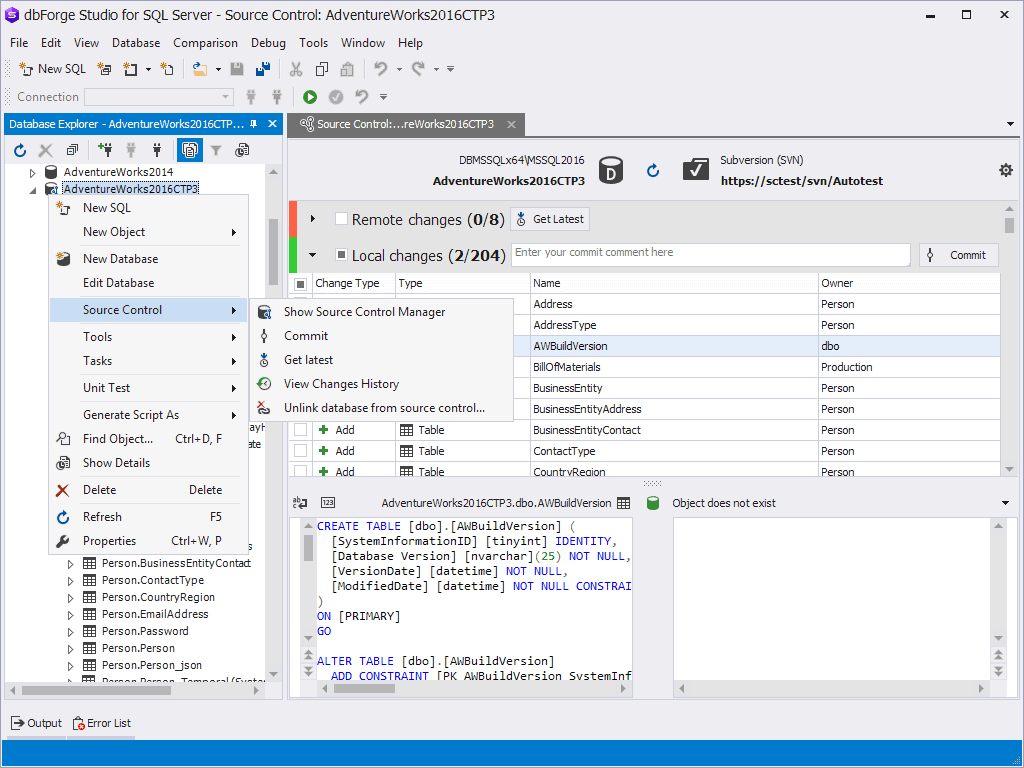
dbForge Studio is a powerful tool designed for an integrated development environment. It helps to develop, manage, administer, analyze, and report SQL Server queries and performance.
Key Features
dbForge Studio has the following features:
- Provides SQL coding assistance in the form of auto code completion to create SQL statements with just a few keystrokes, SQL formatting to follow a commonly accepted coding standard, T-SQL analyzer to improve your code quality with configurable rules, SQL snippets to store and reuse repeated code snippets and advanced code navigation.
- Gives complete control over your server.
- Analyzes the status of SQL indexes and fixes issues with index fragmentation.
- Allows to instantly rebuild and reorganize SQL indexes in a visual manner.
- Implements automated unit testing
- Optimizes slow queries
- Each query is analyzed and displayed along with its cost. It is also represented as a percentage of the total cost of the batch if you’re executing batch queries.
- Wait Stats tab allows you to easily detect bottlenecks in your query
- Displays a list of waits and events associated with each query
- PLAN tree gives information on the execution of every query, including positions, to make optimization easy.
- Displays the most expensive operations.
- Provides the input-output statistics for all tables.
- Helps you see profiling results for multiple queries after you change the query every time.
Why do we recommend it?
We recommend dbForge Studio because of its comprehensive SQL development, management, and optimization feature set. The tool excels in SQL coding assistance, automated unit testing, and detailed query performance analysis, making it a top pick in its category.
Who is it recommended for?
dbForge Studio is highly recommended for SQL developers, database administrators, and analysts looking for an all-in-one solution for SQL Server management. The tool’s advanced features make it particularly beneficial for professionals who require extensive SQL code optimization and in-depth performance analytics.
Pros:
- Comprehensive SQL development and management tools.
- Advanced index analysis and management features.
- Professional and Enterprise editions offer extensive capabilities.
Cons:
- Higher cost of Professional and Enterprise editions may be prohibitive for some users.
Comes in three flavors starting at – Standard ($249.95), Professional ($499.95), and Enterprise ($699.95). Download a free trial.
Conclusion
In short, SQL Query Optimization software and tools help you to choose the right queries that take minimal time and resources to execute and at the same time, give you the best performance. The above-mentioned tools are great choices to optimize your SQL queries.
