![]()
![]()
![]()
Awarded by industry experts & highly rated by users


Why choose PRTG Azure cloud monitoring?
- Quick setup with preconfigured Microsoft Azure sensors
- Visualize your Azure resource data & cost in real time
- The challenge: Microsoft Azure-native monitoring
- Why PRTG is the perfect Azure monitoring solution for you
- Video tutorials: How to set up & use PRTG Microsoft Azure sensors
- FAQ about Azure monitoring
Start Azure monitoring with PRTG and see how it can make your IT infrastructure more reliable and your job easier.
Quick setup with preconfigured Microsoft Azure sensors
With Paessler PRTG, you get native sensors for monitoring your Azure resources out of the box. Just download and install PRTG, deploy a Microsoft Azure device by connecting your Azure account with PRTG, and add the PRTG Azure sensors you need.
![]() How PRTG defines sensors
How PRTG defines sensors
In PRTG, “sensors” are the basic monitoring elements. One sensor usually monitors one measured value in your network, e.g. the traffic of a switch port, the CPU load of a server, the free space of a disk drive. On average you need about 5-10 sensors per device or one sensor per switch port.
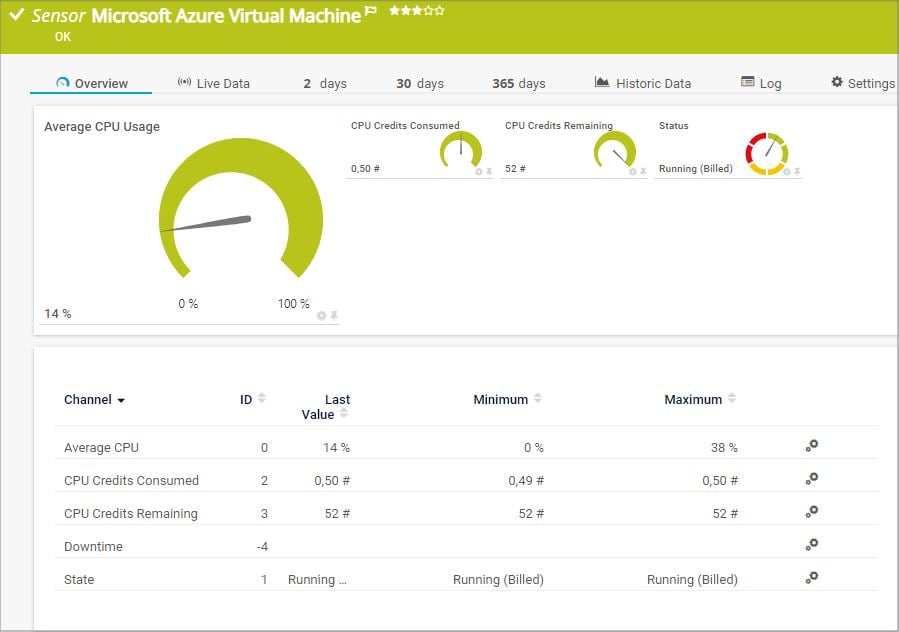
Monitor the health of your Azure VMs
PRTG makes sure that your Microsoft Azure virtual machines are up and running around the clock. Its Microsoft Azure Virtual Machine sensor monitors the status of each VM in your Microsoft Azure subscription and displays the CPU usage as well as used and remaining CPU credits.
A quick glance is all it takes to determine whether your virtual machines are available and performing as expected.
Have your Azure subscription cost under control
The Microsoft Azure Subscription Cost sensor monitors the cost of an Azure subscription. This includes the overall cost of the current and previous period as well as a cost forecast.
In addition, the sensor shows the used amount of a budget that you specified in your subscription. You can choose the specific budget during sensor setup.
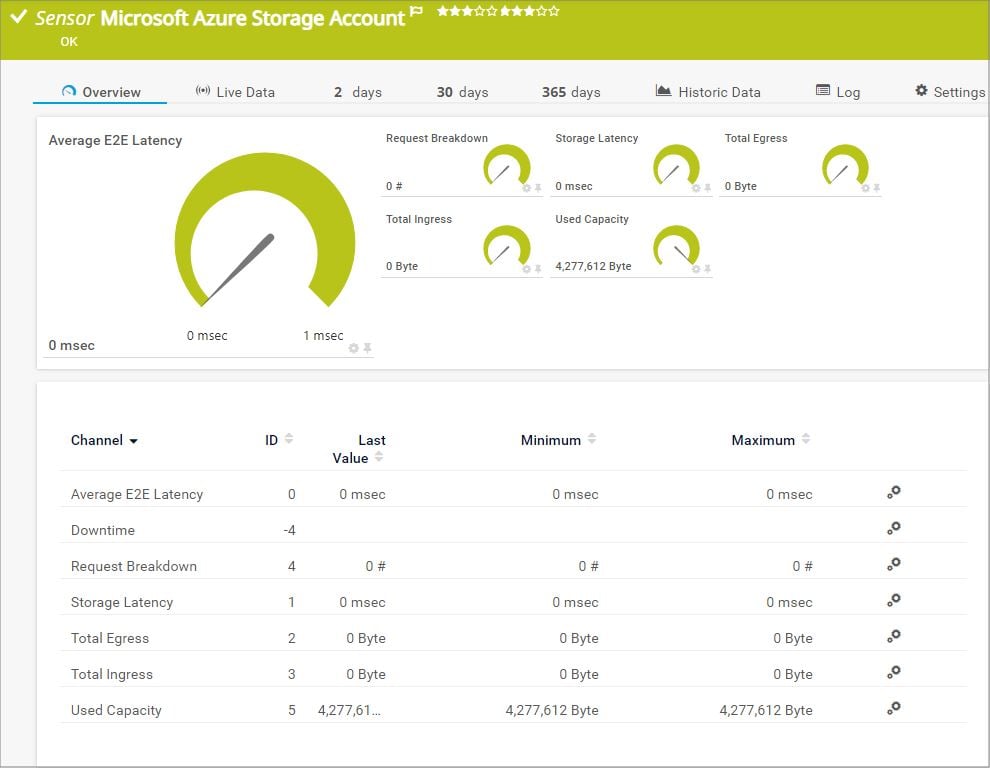
Check the performance of your Azure storage account
With the Microsoft Azure Storage Account sensor, you can ensure that everything is fine with the storage accounts in your Azure subscription.
The sensor lets you keep an eye on the average E2E latency, the storage latency, total ingress and egress, the used capacity, and the number of request breakdowns.
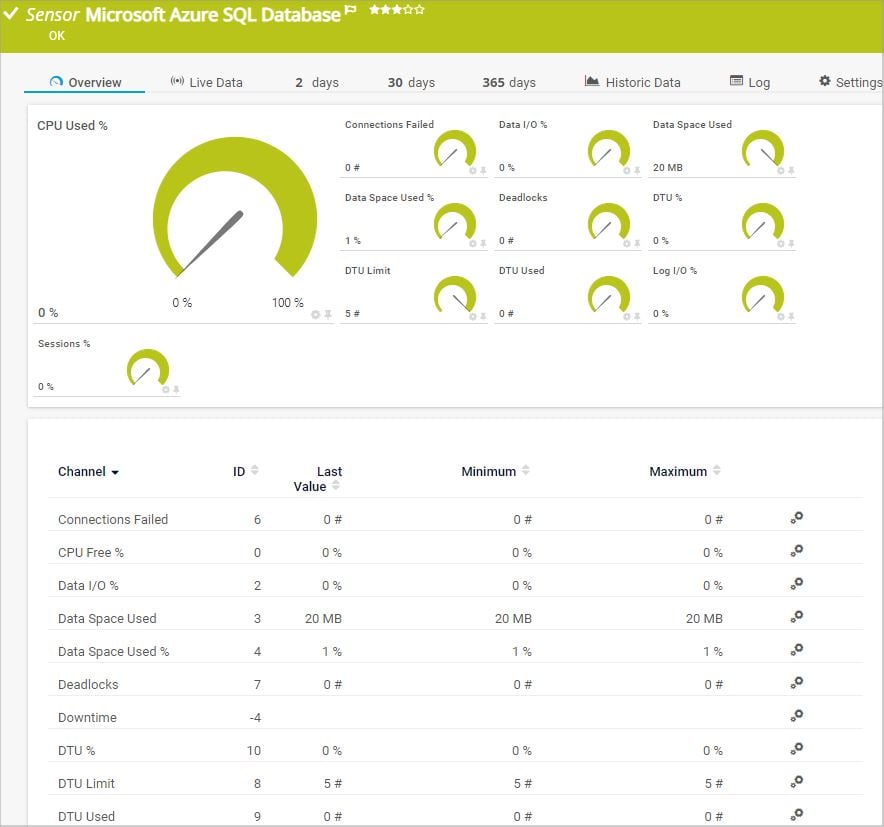
Get Azure SQL Database metrics at a glance
The Microsoft Azure SQL Database sensor monitors the metrics of an Azure SQL Database, either a single database or an elastic pool. This way, you can check if your database storage and processes are all working as intended.
The sensor monitors the number of failed connections and deadlocks, CPU and data space usage, data and log input and output, the session percentage, and more.
PRTG is compatible with all major vendors & manufacturers
![]()
Visualize your Azure resource data & cost in real time
PRTG makes it easy for you to check the health and performance of your Azure virtual machines, storage accounts, and SQL databases. The Azure monitoring tool also lets you keep track of your Azure subscription cost to have an overview of your budget spending and help you with future budget planning.
Azure virtual machines
Azure SQL databases
Azure storage accounts
Start Azure monitoring with PRTG and see how it can make your IT infrastructure more reliable and your job easier.
Your Azure performance monitoring at a glance – even on the go
Set up PRTG in minutes and use it on almost any mobile device.


The challenge: Microsoft Azure-native monitoring
If you have tried monitoring your Azure applications and services with Azure-native monitoring from Microsoft, you might have encountered several challenges.
1. Lack of consolidated monitoring
A typical Azure architecture is usually very complex and dynamic. Applications and services are made up of various siloed Azure resources (for example, virtual machines) and each resource needs to be monitored individually.
This means that to comprehensively monitor an Azure application or service, you must navigate between the different monitored resources to get the full picture.
2. Lack of easily customizable alerting
Microsoft Azure-native monitoring only allows you to set a very limited number of alerting conditions per rule.
This means that in order to be notified of an issue in a comprehensive way, you need to add multiple alerts for the same issue – and, of course, each alert costs extra.
In addition, notification methods are very limited and it is not possible to customize the available email notification templates.
3. Lack of monitoring the entire IT infrastructure
While Azure-native monitoring from Microsoft lets you monitor all kinds of metrics of an Azure resource itself, it is not possible to deploy it as a monitoring solution for monitoring your entire IT environment.
This means that in order to get insights into the full IT stack including hardware like servers, routers, and switches, or other operating systems and software, you need further monitoring tools – which will make monitoring not only more complicated, but also way more expensive than necessary.
Not anymore!
Why PRTG is the perfect Azure monitoring solution for you
![]()
Keep an eye on your entire IT stack
PRTG monitors your complete IT infrastructure – no matter if you have an on-premises, cloud, or hybrid environment. Watch your Microsoft Azure applications and services alongside everything else: as an all-in-one monitoring tool, every PRTG license or subscription includes more than 250 preconfigured sensors and out-of-the-box support for the most popular vendors.
![]()
Customize alerts & notifications
Sit back, relax, and let PRTG do the monitoring and alerting for you. If there is an issue with your Azure resources or any other problem in your network, PRTG alerts you immediately via highly customizable notifications. Define, for example, threshold values that trigger an alert, set granular alerting rules, and choose if you want to be informed via email, SMS, push notification, Teams or Slack message, and more.
![]()
Monitor Azure via easy-to-read dashboards
Gone are the days where you have to log in to each Azure resource separately to check their health status. PRTG provides you with a central overview that consolidates all your monitoring data in an easy-to-read dashboard. What’s more: with PRTG, you can create your own, customized maps and dashboards that show your Azure monitoring metrics the way you want.
PRTG makes your job easier
Our monitoring software frees you to focus on other tasks by promptly notifying you of potential issues.
![]()
Save effort
PRTG gives you one central monitoring tool for your servers and entire network. Enjoy a quick overview of your whole infrastructure via our dashboard and app.
![]()
Save time
Getting started with PRTG is a breeze. Setting up or switching from another network monitoring tool is easy thanks to the auto-discovery and pre-configured device templates.
![]()
Save money
80% of our customers report substantial cost savings with network monitoring. Your costs of licenses will likely pay for themselves within weeks.
IT experts agree: Paessler PRTG is a great solution for IT infrastructure monitoring

“All-around winning
network monitor”

“The real beauty of PRTG is the endless possibilities it offers”

“Outstanding cloud
monitoring”
Start Azure monitoring with PRTG and see how it can make your IT infrastructure more reliable and your job easier.
“Excellent tool for detailed monitoring. Alarms and notifications work greatly. Equipment addition is straight forward and server initial setup is very easy. ...feel safe to purchase it if you intend to monitor a large networking landscape.”
Infrastructure and Operations Engineer in the Communications Industry, firm size 10B - 30B USD
FAQ about Azure monitoring
1. What is Microsoft Azure?
Microsoft Azure, formerly known as Windows Azure, is a public cloud computing platform from Microsoft. It offers a broad range of cloud services including Infrastructure as a Service (IaaS), Platform as a Service (PaaS), and Software as a Service (SaaS).
2. What is Azure monitoring?
Azure monitoring with Paessler PRTG keeps track of all the cloud services, VMs, and the subscription costs of your Microsoft Azure infrastructure and visualizes all data on easy-to-read dashboards.
3. What is Azure Monitor?
Azure Monitor is a built-in service in the Azure cloud that offers basic monitoring functionalities. For a more sophisticated monitoring with custom alerts and a complete overview over your entire IT infrastructure, you should choose a professional tool like Paessler PRTG.
4. Why should I monitor my Azure Cloud Services?
By monitoring your Microsoft Azure Cloud, you cab assure all service are running smoothly. As soon as a problem occurs, you'll be notified immediately, and you'll be able to fix it quickly before great costs arise.
More than just a monitoring tool:
Reasons our customers love PRTG


Create innovative solutions with Paessler’s partners
Partnering with innovative vendors, Paessler unleashes synergies to create
new and additional benefits for joined customers.

With the combination of PRTG and Insys, the monitoring specialist Paessler and the industrial gateway manufacturer INSYS icom offer a practical possibility to merge IT and OT.
INSYS icom


PRTG: The multi-tool for sysadmins
Adapt PRTG individually and dynamically to your needs and rely on a strong API:- HTTP API: Access monitoring data and manipulate monitoring objects via HTTP requests
- Custom sensors: Create your own PRTG sensors for customized monitoring
- Custom notifications: Create your own notifications and send action triggers to external systems
- REST Custom sensor: Monitor almost everything that provides data in XML or JSON format
Still not convinced?
More than 500,000
sysadmins love PRTG
Paessler PRTG is used by companies of all sizes. Sysadmins love PRTG because it makes their job a whole lot easier.
Monitor your entire IT infrastructure
Bandwidth, servers, virtual environments, websites, VoIP services – PRTG keeps an eye on your entire network.
![]()
Start Azure monitoring with PRTG and see how it can make your IT infrastructure more reliable and your job easier.
|
PRTG |
Network Monitoring Software - Version 24.2.94.1400 (April 10th, 2024) |
|
Hosting |
Download for Windows and cloud-based version PRTG Hosted Monitor available |
Languages |
English, German, Spanish, French, Portuguese, Dutch, Russian, Japanese, and Simplified Chinese |
Pricing |
Up to 100 sensors for free (Price List) |
Unified Monitoring |
Network devices, bandwidth, servers, applications, virtual environments, remote systems, IoT, and more |
Supported Vendors & Applications |
|